Comfort Systems USA, Inc. (FIX) and EMCOR Group, Inc. (EME) are two prominent players in the engineering and construction sector, specializing in mechanical and electrical services. Both companies serve overlapping markets in the U.S., focusing on innovation in building systems integration and facility management. Their distinct approaches to growth and operational scale make them worthy of comparison. In this article, I will help you identify which company presents the most compelling investment opportunity in 2026.
Table of contents
Companies Overview
I will begin the comparison between Comfort Systems USA, Inc. and EMCOR Group, Inc. by providing an overview of these two companies and their main differences.
Comfort Systems USA, Inc. Overview
Comfort Systems USA, Inc. specializes in mechanical and electrical installation, renovation, maintenance, repair, and replacement services across the United States. The company serves commercial, industrial, and institutional markets by offering HVAC systems, plumbing, electrical, piping, and fire protection. Founded in 1917 and headquartered in Houston, Texas, it operates through Mechanical and Electrical segments and focuses on integrated building system solutions.
EMCOR Group, Inc. Overview
EMCOR Group, Inc. provides electrical and mechanical construction and facilities services primarily in the U.S. and the U.K. Its offerings include power systems, energy solutions, HVAC, fire protection, plumbing, and building services such as facility management, maintenance, and industrial services. Founded in 1987 and based in Norwalk, Connecticut, EMCOR serves commercial, government, and industrial clients with broad infrastructure and maintenance expertise.
Key similarities and differences
Both companies operate in the Engineering & Construction industry, focusing on mechanical and electrical services. Comfort Systems USA concentrates on U.S. markets with emphasis on HVAC and building systems integration, while EMCOR has a broader geographic reach including the U.K. and offers more extensive facility management and industrial services. EMCOR also employs more staff and provides a wider range of building and industrial support services compared to Comfort Systems USA.
Income Statement Comparison
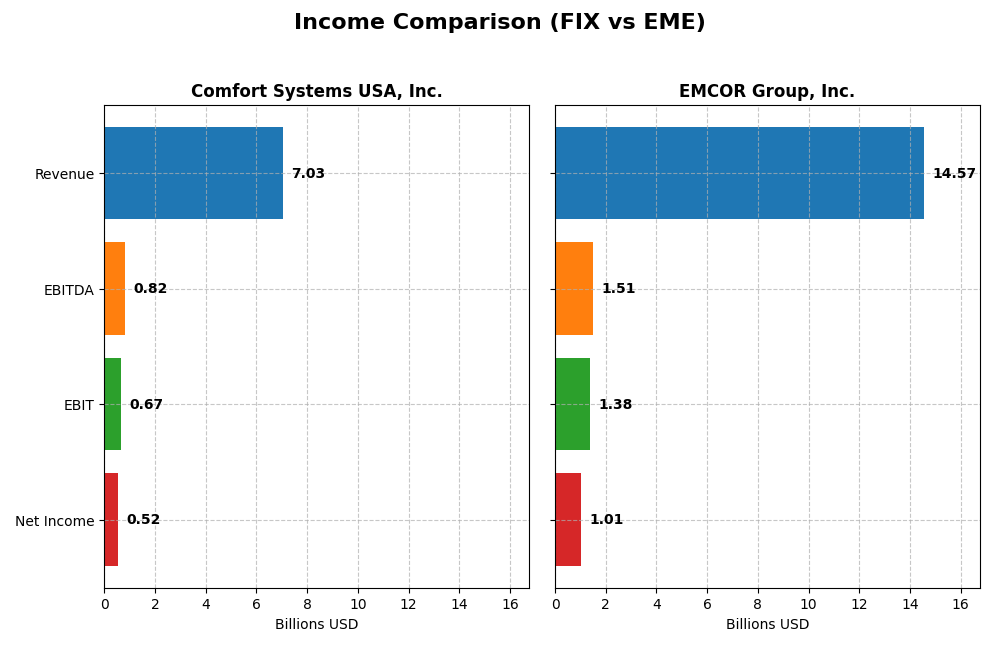
The table below compares the most recent fiscal year income statement metrics for Comfort Systems USA, Inc. and EMCOR Group, Inc., providing a snapshot of their financial performance in 2024.
| Metric | Comfort Systems USA, Inc. (FIX) | EMCOR Group, Inc. (EME) |
|---|---|---|
| Market Cap | 35.8B USD | 29.0B USD |
| Revenue | 7.03B USD | 14.57B USD |
| EBITDA | 817M USD | 1.51B USD |
| EBIT | 672M USD | 1.38B USD |
| Net Income | 522M USD | 1.01B USD |
| EPS | 14.64 USD | 21.61 USD |
| Fiscal Year | 2024 | 2024 |
Income Statement Interpretations
Comfort Systems USA, Inc.
Comfort Systems USA, Inc. demonstrated strong revenue growth from 2020 to 2024, with a 146% increase overall and a notable 35% rise in the last year. Net income more than doubled, showing a 248% increase over the period, supported by a favorable net margin growth of 41%. The 2024 fiscal year saw significant improvements in both gross profit and EBIT margins, reflecting enhanced operational efficiency.
EMCOR Group, Inc.
EMCOR Group’s revenue grew steadily by 66% between 2020 and 2024, with a 16% increase in the most recent year. Net income exhibited an impressive 658% growth over the period, with net margin expanding by 358%. Although operating expenses grew in line with revenue, slightly impacting margin stability, the company improved its EPS substantially, indicating strong profitability gains in 2024.
Which one has the stronger fundamentals?
Comfort Systems USA, Inc. shows a higher percentage of favorable income statement metrics (93%) compared to EMCOR Group’s 79%, highlighting stronger margin stability and growth consistency. EMCOR’s exceptional net income and EPS growth rates are tempered by some unfavorable expense growth. Both companies present favorable fundamentals, but Comfort Systems USA displays more balanced income growth and margin improvements.
Financial Ratios Comparison
Below is a comparison of key financial ratios for Comfort Systems USA, Inc. (FIX) and EMCOR Group, Inc. (EME) based on their most recent fiscal year 2024 data.
| Ratios | Comfort Systems USA, Inc. (FIX) | EMCOR Group, Inc. (EME) |
|---|---|---|
| ROE | 30.6% | 34.3% |
| ROIC | 27.2% | 26.4% |
| P/E | 29.0 | 21.0 |
| P/B | 8.88 | 7.20 |
| Current Ratio | 1.08 | 1.30 |
| Quick Ratio | 1.06 | 1.27 |
| D/E (Debt-to-Equity) | 0.18 | 0.12 |
| Debt-to-Assets | 6.6% | 4.5% |
| Interest Coverage | 113.0 | 356.0 |
| Asset Turnover | 1.49 | 1.89 |
| Fixed Asset Turnover | 13.9 | 27.8 |
| Payout Ratio | 8.2% | 4.3% |
| Dividend Yield | 0.28% | 0.21% |
Interpretation of the Ratios
Comfort Systems USA, Inc.
Comfort Systems USA exhibits mostly favorable ratios, including a strong return on equity (30.65%) and return on invested capital (27.16%), supported by a low debt-to-equity ratio (0.18) and excellent interest coverage (101.02). However, its price-to-earnings (28.97) and price-to-book (8.88) ratios appear elevated, posing valuation concerns. The company pays dividends with a low yield of 0.28%, which may reflect cautious distribution given the payout ratio and cash flow coverage.
EMCOR Group, Inc.
EMCOR Group displays robust financial health with favorable returns on equity (34.28%) and invested capital (26.38%), alongside a moderate debt-to-equity ratio (0.12) and strong interest coverage (365.48). Its valuation ratios are more moderate, with a price-to-earnings ratio of 21.01. The dividend yield is low at 0.21%, indicating modest shareholder returns, consistent with stable payout policies and solid free cash flow support.
Which one has the best ratios?
Both companies show predominantly favorable ratios with strong profitability and healthy leverage metrics. Comfort Systems USA has slightly higher valuation multiples and a marginally better return on equity, but EMCOR Group benefits from superior interest coverage and asset turnover ratios, suggesting more efficient capital use. Overall, the ratio profiles are favorable for both, with nuanced differences in valuation and operational efficiency.
Strategic Positioning
This section compares the strategic positioning of Comfort Systems USA, Inc. and EMCOR Group, Inc. across Market position, Key segments, and Exposure to technological disruption:
Comfort Systems USA, Inc.
- Market position and competitive pressure
- Key segments and business drivers
- Exposure to technological disruption
EMCOR Group, Inc.
- Larger market cap at 35.8B USD, operating primarily in U.S. mechanical and electrical services.
- Focused on mechanical (5.5B USD) and electrical (1.5B USD) segments in commercial, industrial, and institutional MEP markets.
- Provides remote monitoring and integration services for MEP and building systems, addressing evolving building technology needs.
Comfort Systems USA, Inc. vs EMCOR Group, Inc. Positioning
Comfort Systems USA concentrates on mechanical and electrical MEP services mainly in the U.S., delivering specialized building system solutions. EMCOR pursues a more diversified approach across multiple service lines and geographies, including U.K. markets, with broader industrial and facilities offerings.
Which has the best competitive advantage?
Both companies demonstrate very favorable MOAT evaluations with growing ROIC above WACC, indicating durable competitive advantages. EMCOR shows a higher ROIC trend, suggesting potentially stronger profitability growth, while Comfort Systems maintains a solid value-creation profile.
Stock Comparison
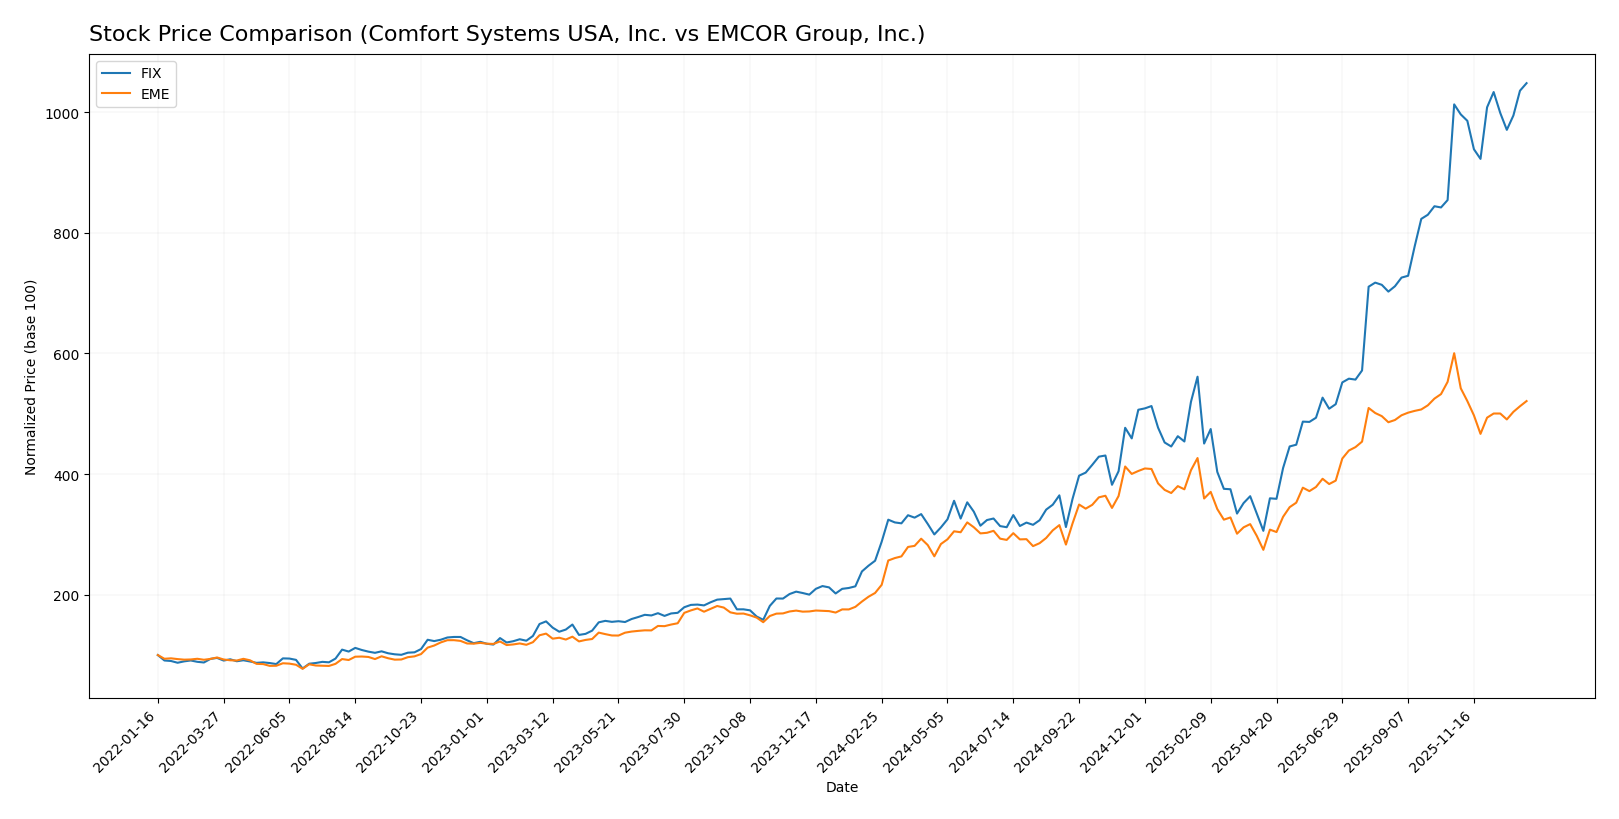
The stock price chart highlights significant bullish gains for both Comfort Systems USA, Inc. (FIX) and EMCOR Group, Inc. (EME) over the past 12 months, with distinct patterns of decelerating momentum and recent divergent trading dynamics.
Trend Analysis
Comfort Systems USA, Inc. (FIX) exhibited a strong bullish trend over the past year with a 308.75% price increase, although the acceleration of gains has decelerated. The stock showed high volatility with a standard deviation of 221.04 and reached a peak price of 1015.74.
EMCOR Group, Inc. (EME) also posted a bullish trend, rising 156.74% in the same period but with decelerating momentum. Volatility was lower, at a standard deviation of 112.78, and the stock peaked at 748.24 before recent declines.
Comparing the two, FIX delivered a substantially higher market performance over the past year, outperforming EME by more than 150 percentage points in price appreciation.
Target Prices
The current analyst consensus suggests positive upside potential for both Comfort Systems USA, Inc. and EMCOR Group, Inc.
| Company | Target High | Target Low | Consensus |
|---|---|---|---|
| Comfort Systems USA, Inc. | 1200 | 1069 | 1136.33 |
| EMCOR Group, Inc. | 800 | 713 | 754.33 |
Analysts expect Comfort Systems USA’s stock to rise above its current price of 1014.25 USD, while EMCOR Group’s consensus target is also notably higher than its current price of 648.63 USD, indicating bullish sentiment.
Analyst Opinions Comparison
This section compares analysts’ ratings and grades for Comfort Systems USA, Inc. (FIX) and EMCOR Group, Inc. (EME):
Rating Comparison
FIX Rating
- Rating: B+, classified as Very Favorable by analysts.
- Discounted Cash Flow Score: 3, indicating a moderate valuation assessment.
- ROE Score: 5, reflecting very favorable efficiency in generating profit.
- ROA Score: 5, showing very favorable asset utilization to generate earnings.
- Debt To Equity Score: 3, indicating moderate financial risk and stability.
- Overall Score: 3, representing a moderate overall financial standing.
EME Rating
- Rating: B+, classified as Very Favorable by analysts.
- Discounted Cash Flow Score: 3, indicating a moderate valuation assessment.
- ROE Score: 5, reflecting very favorable efficiency in generating profit.
- ROA Score: 5, showing very favorable asset utilization to generate earnings.
- Debt To Equity Score: 3, indicating moderate financial risk and stability.
- Overall Score: 3, representing a moderate overall financial standing.
Which one is the best rated?
Both FIX and EME have identical ratings and financial scores, including a B+ rating and moderate overall scores. Neither company is rated better than the other based on the data provided.
Scores Comparison
The comparison of Comfort Systems USA, Inc. and EMCOR Group, Inc. on key financial scores is as follows:
Comfort Systems USA, Inc. Scores
- Altman Z-Score: 8.39, indicating a safe zone and low bankruptcy risk.
- Piotroski Score: 8, categorized as very strong financial health.
EMCOR Group, Inc. Scores
- Altman Z-Score: 6.94, also in the safe zone with low bankruptcy risk.
- Piotroski Score: 5, considered average financial strength.
Which company has the best scores?
Comfort Systems USA, Inc. holds higher Altman Z and Piotroski scores than EMCOR Group, Inc., reflecting stronger financial health and lower bankruptcy risk based on the provided data.
Grades Comparison
Here is the comparison of the most recent grades provided by recognized grading companies for Comfort Systems USA, Inc. and EMCOR Group, Inc.:
Comfort Systems USA, Inc. Grades
The following table summarizes the latest grades from several reputable firms for Comfort Systems USA, Inc.:
| Grading Company | Action | New Grade | Date |
|---|---|---|---|
| DA Davidson | Buy | Buy | 2025-12-19 |
| Stifel | Buy | Buy | 2025-12-16 |
| UBS | Buy | Buy | 2025-10-27 |
| Stifel | Buy | Buy | 2025-10-13 |
| UBS | Buy | Buy | 2025-09-15 |
| DA Davidson | Buy | Buy | 2025-07-28 |
| UBS | Buy | Buy | 2025-07-25 |
| Stifel | Buy | Buy | 2025-07-11 |
| DA Davidson | Buy | Buy | 2025-06-30 |
| Stifel | Buy | Buy | 2025-05-23 |
Comfort Systems USA, Inc. has consistently received “Buy” ratings from DA Davidson, Stifel, and UBS, showing stable positive sentiment and no changes in outlook.
EMCOR Group, Inc. Grades
The following table presents recent grades from recognized grading firms for EMCOR Group, Inc.:
| Grading Company | Action | New Grade | Date |
|---|---|---|---|
| DA Davidson | Buy | Buy | 2025-10-31 |
| Stifel | Buy | Buy | 2025-10-13 |
| Goldman Sachs | Neutral | Neutral | 2025-10-08 |
| DA Davidson | Buy | Buy | 2025-08-01 |
| UBS | Buy | Buy | 2025-07-25 |
| Stifel | Buy | Buy | 2025-07-11 |
| Goldman Sachs | Sell | Sell | 2025-07-08 |
| Stifel | Buy | Buy | 2025-05-01 |
| Stifel | Buy | Buy | 2025-02-27 |
| DA Davidson | Buy | Buy | 2024-07-26 |
EMCOR Group, Inc. shows a predominantly favorable rating trend from DA Davidson, Stifel, and UBS, but Goldman Sachs has maintained a more cautious stance, issuing Neutral and Sell ratings.
Which company has the best grades?
EMCOR Group, Inc. holds a consensus “Buy” rating with more buy recommendations overall, while Comfort Systems USA, Inc. has a “Hold” consensus despite steady buy ratings from specific firms. This suggests EMCOR’s broader analyst support may reflect stronger market confidence, potentially affecting investor perception and portfolio inclusion.
Strengths and Weaknesses
Below is a comparison table highlighting key strengths and weaknesses of Comfort Systems USA, Inc. (FIX) and EMCOR Group, Inc. (EME) based on their most recent financial and operational data.
| Criterion | Comfort Systems USA, Inc. (FIX) | EMCOR Group, Inc. (EME) |
|---|---|---|
| Diversification | Moderate: Focus on Electrical (1.5B) and Mechanical (5.5B) segments; less international exposure | High: Multiple US segments plus UK building services, providing broader service and geographic diversification |
| Profitability | Favorable ROIC (27.16%), ROE (30.65%), but moderate net margin (7.43%) | Favorable ROIC (26.38%) and ROE (34.28%), slightly lower net margin (6.91%) |
| Innovation | Steady growth in Mechanical and Electrical services, but limited direct innovation indicators | Strong operational scale with extensive facilities and industrial services, implying continuous process improvements |
| Global presence | Primarily US-based with no notable international revenue | US-based with meaningful UK segment, showing modest international presence |
| Market Share | Strong in Mechanical services, growing Electrical segment | Larger scale and broader service offerings suggest higher market share in the US contracting sector |
Key takeaways: Both companies demonstrate very favorable economic moats with growing ROICs and efficient capital use. EMCOR has an edge in diversification and international presence, while Comfort Systems excels in focused mechanical services with strong profitability metrics. Investors should weigh diversification versus specialization based on risk tolerance.
Risk Analysis
Below is a comparative risk table for Comfort Systems USA, Inc. (FIX) and EMCOR Group, Inc. (EME) based on their most recent 2024 financial and operational data:
| Metric | Comfort Systems USA, Inc. (FIX) | EMCOR Group, Inc. (EME) |
|---|---|---|
| Market Risk | High beta at 1.664 indicates elevated sensitivity to market fluctuations | Moderate beta at 1.174 suggests moderate market sensitivity |
| Debt level | Low debt-to-equity ratio (0.18) and debt-to-assets (6.55%) – favorable leverage | Even lower debt-to-equity (0.12) and debt-to-assets (4.52%) – very favorable leverage |
| Regulatory Risk | Moderate, operating primarily in US construction industry with standard compliance requirements | Moderate, operates in US and UK with exposure to multi-jurisdictional regulations |
| Operational Risk | Moderate, with 18.3K employees and complex mechanical/electrical installations | Higher, larger workforce (40.4K) and broader service scope increasing complexity |
| Environmental Risk | Moderate, HVAC and building services may face regulations on emissions and sustainability | Moderate to high, given involvement in energy, industrial, and infrastructure services |
| Geopolitical Risk | Low, primarily US-based operations | Moderate, exposure to UK operations adds some geopolitical uncertainty |
In synthesis, Comfort Systems USA faces higher market risk due to its beta but maintains low financial leverage and strong operational efficiency. EMCOR has lower market volatility risk and better debt profiles but faces more operational complexity and geopolitical exposure. The most impactful risks for both are market sensitivity (especially for FIX) and operational scale complexity (notably for EME), requiring cautious monitoring in volatile economic periods.
Which Stock to Choose?
Comfort Systems USA, Inc. (FIX) shows a strong income evolution with a 147% revenue increase over five years and a 248% net income growth. Its financial ratios are largely favorable, including a 30.65% ROE and 27.16% ROIC, supported by low debt levels and a very favorable rating of B+. The company maintains a very favorable moat with a growing ROIC, signaling durable competitive advantage.
EMCOR Group, Inc. (EME) presents solid income growth, with a 66% revenue rise and a remarkable 658% net income increase over the same period. Its financial ratios are mostly favorable, including a 34.28% ROE and 26.38% ROIC, with manageable debt and a B+ rating. The firm also enjoys a very favorable moat and an increasing ROIC trend, indicating sustained profitability.
For investors, FIX’s stronger recent income growth and very strong financial health scores might appeal to those prioritizing quality and growth, while EME’s higher net income growth and stable financial ratios could be attractive for those valuing robust profitability and income statement resilience. Both stocks show favorable ratings and moats, suggesting potential suitability depending on investor risk tolerance and investment focus.
Disclaimer: Investment carries a risk of loss of initial capital. The past performance is not a reliable indicator of future results. Be sure to understand risks before making an investment decision.
Go Further
I encourage you to read the complete analyses of Comfort Systems USA, Inc. and EMCOR Group, Inc. to enhance your investment decisions: