Home > Comparison > Communication Services > VZ vs CMCSA
The strategic rivalry between Verizon Communications Inc. and Comcast Corporation shapes the evolution of the Communication Services sector. Verizon operates as a capital-intensive telecommunications provider focusing on network infrastructure and wireless connectivity. Comcast combines cable communications with diversified media and entertainment assets, emphasizing high-margin content and distribution. This analysis aims to identify which business model delivers superior risk-adjusted returns amid sector convergence and competitive pressure.
Table of contents
Companies Overview
Verizon Communications Inc. and Comcast Corporation dominate US telecommunications with distinct market strategies and scale.
Verizon Communications Inc.: Telecommunications Powerhouse
Verizon stands as a leading telecommunications services provider, generating revenue through wireless plans, broadband, and fixed connectivity. Its 2021 strategy focused on expanding its 115M wireless connections and strengthening business services like private networking and IoT. Verizon’s core advantage lies in its extensive network infrastructure and diversified communication offerings.
Comcast Corporation: Media and Technology Giant
Comcast operates as a broad media and technology conglomerate, earning from broadband, video, voice services, and media content via NBCUniversal and Sky. In 2021, it prioritized growth in streaming, advertising, and theme park experiences. Comcast’s strength centers on its integrated media assets and wide consumer reach across multiple entertainment platforms.
Strategic Collision: Similarities & Divergences
Both firms compete fiercely in telecom and broadband markets but diverge in business models: Verizon focuses on network services, while Comcast blends telecom with media content. Their battleground is broadband subscriber growth and content delivery. Investors face contrasting profiles—Verizon offers network stability; Comcast presents diversified entertainment exposure.
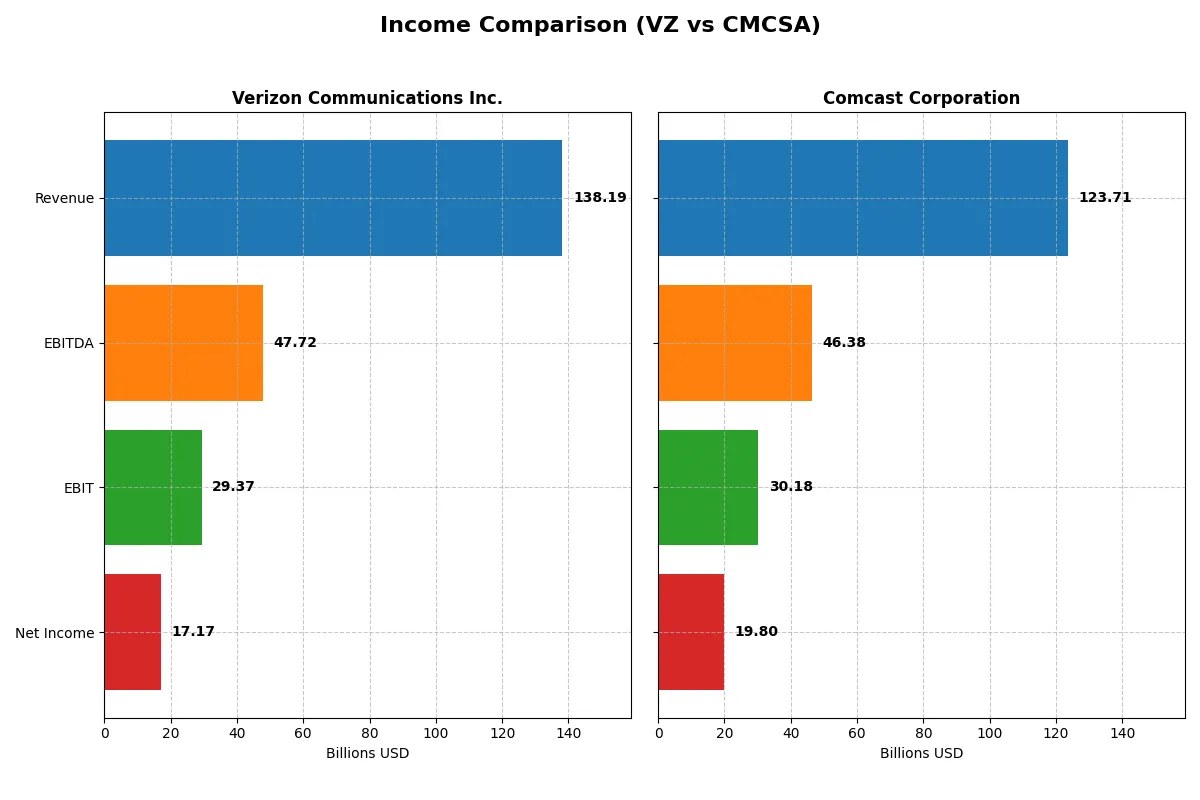
Income Statement Comparison
This data dissects the core profitability and scalability of both corporate engines to reveal who dominates the bottom line:
| Metric | Verizon Communications Inc. (VZ) | Comcast Corporation (CMCSA) |
|---|---|---|
| Revenue | 138.2B | 123.7B |
| Cost of Revenue | 75.1B | 49.4B |
| Operating Expenses | 33.8B | 53.6B |
| Gross Profit | 63.1B | 74.3B |
| EBITDA | 47.7B | 46.4B |
| EBIT | 29.4B | 30.2B |
| Interest Expense | 6.7B | 4.4B |
| Net Income | 17.2B | 20.0B |
| EPS | 4.06 | 5.41 |
| Fiscal Year | 2025 | 2025 |
Income Statement Analysis: The Bottom-Line Duel
This income statement comparison reveals which company operates with superior efficiency and profitability in a competitive landscape.
Verizon Communications Inc. Analysis
Verizon’s revenue edged up modestly to 138B in 2025, but net income declined to 17.2B, reflecting margin pressures. Gross margin remains healthy at 45.6%, yet net margin slid to 12.4%, signaling rising costs and slight efficiency erosion. The past year shows weakening momentum, with declining EBIT and EPS growth marking caution.
Comcast Corporation Analysis
Comcast’s revenue remained stable near 124B in 2025, while net income surged to 20B, driven by margin expansion. Gross margin improved to 60.1%, and net margin rose to 16%, highlighting robust cost control and operational leverage. Strong EBIT and EPS growth over the last year underscore Comcast’s accelerating profitability and capital allocation prowess.
Margin Strength vs. Growth Momentum
Comcast outperforms Verizon in both profitability and growth, boasting superior margins and a 40% net income rise over five years. Verizon’s shrinking net margin and earnings caution investors about operational challenges. Comcast’s profile suits those seeking dynamic earnings growth, while Verizon reflects a more mature but pressured business model.
Financial Ratios Comparison
These vital ratios act as a diagnostic tool to expose the underlying fiscal health, valuation premiums, and capital efficiency of the companies analyzed below:
| Ratios | Verizon Communications Inc. (VZ) | Comcast Corporation (CMCSA) |
|---|---|---|
| ROE | 16.4% | 20.4% |
| ROIC | 6.2% | 9.9% |
| P/E | 10.0x | 5.1x |
| P/B | 1.65x | 1.05x |
| Current Ratio | 0.91 | 0.88 |
| Quick Ratio | 0.87 | 0.88 |
| D/E | 1.92 | 0.06 |
| Debt-to-Assets | 49.6% | 3.2% |
| Interest Coverage | 4.37x | 4.69x |
| Asset Turnover | 0.34 | 0.66 |
| Fixed Asset Turnover | 1.04 | 1.88 |
| Payout ratio | 66.9% | 24.7% |
| Dividend yield | 6.67% | 4.81% |
| Fiscal Year | 2025 | 2025 |
Efficiency & Valuation Duel: The Vital Signs
Ratios serve as a company’s financial DNA, exposing hidden risks and operational strengths that raw figures alone cannot reveal.
Verizon Communications Inc.
Verizon posts a solid 16.4% ROE and a respectable 12.4% net margin, indicating steady profitability. Its P/E of 10.02 suggests the stock trades at a reasonable valuation. The 6.7% dividend yield rewards shareholders, reflecting a preference for returning cash rather than aggressive reinvestment.
Comcast Corporation
Comcast delivers a stronger 20.4% ROE and a higher 16.0% net margin, signaling robust efficiency. Its P/E ratio at 5.14 shows the stock is attractively priced. With a 4.8% dividend yield and favorable leverage metrics, Comcast balances shareholder returns with growth potential.
Balanced Strength vs. Undervalued Efficiency
Comcast outperforms Verizon in profitability and valuation, with fewer financial red flags. Verizon offers a higher dividend yield but faces some leverage and liquidity concerns. Investors seeking operational efficiency and value may prefer Comcast, while income-focused profiles might lean toward Verizon.
Which one offers the Superior Shareholder Reward?
I compare Verizon and Comcast’s payout philosophies in 2026. Verizon yields 6.7% with a payout ratio near 67%, reflecting strong free cash flow coverage and consistent dividends around 2.7/share. Comcast yields 4.8% with a 25% payout, showing a conservative dividend policy and robust reinvestment. Comcast’s buybacks are intense, boosting free cash flow/share to 6.0 versus Verizon’s 4.8, enhancing total return. Verizon’s high payout risks cash flow strain amid heavy debt (D/E ~1.9). Comcast’s lower leverage and capital allocation to growth and buybacks suggest a more sustainable model. I favor Comcast for superior total shareholder reward in 2026, balancing yield, buybacks, and long-term value creation.
Comparative Score Analysis: The Strategic Profile
The radar chart reveals the fundamental DNA and trade-offs of Verizon Communications Inc. and Comcast Corporation, highlighting their financial strengths and vulnerabilities:
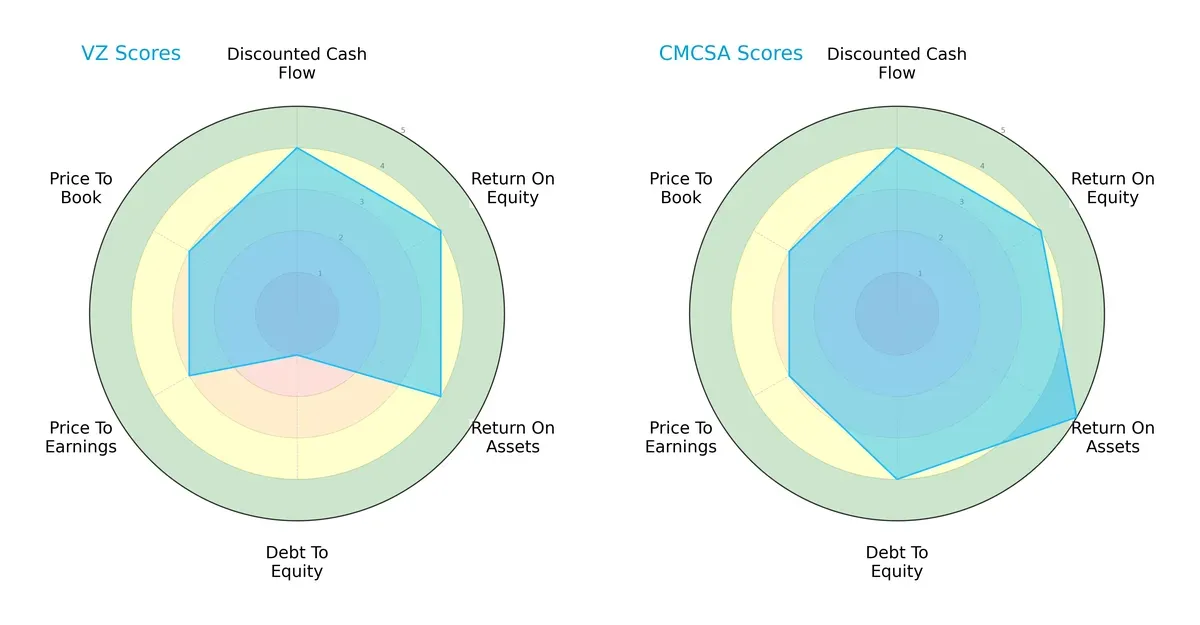
Comcast boasts a more balanced profile with strong scores in ROA (5) and a solid debt-to-equity score (4), signaling efficient asset use and financial prudence. Verizon matches Comcast in DCF, ROE, and valuation metrics but suffers from a very unfavorable debt-to-equity score (1), indicating a riskier capital structure. Comcast’s advantage lies in financial stability, while Verizon leans on operational efficiency but carries higher leverage risk.
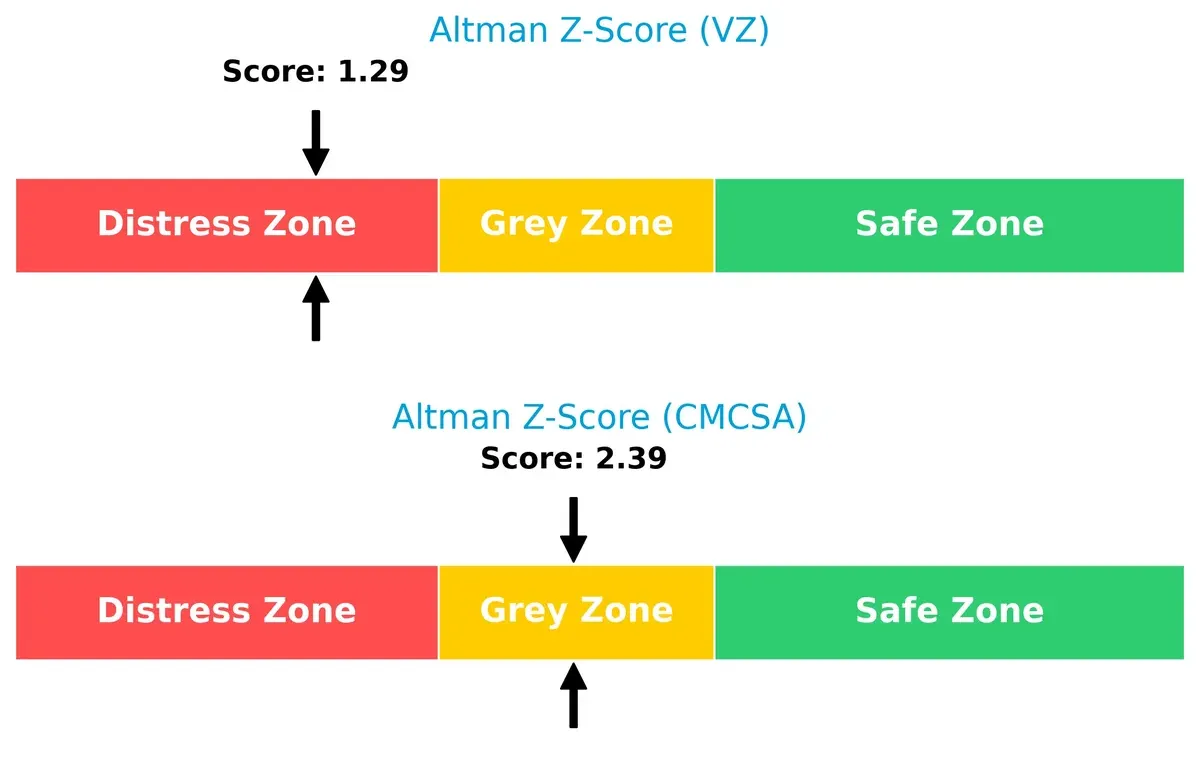
Bankruptcy Risk: Solvency Showdown
Verizon’s Altman Z-Score of 1.29 places it firmly in the distress zone, raising significant bankruptcy concerns. Comcast’s score of 2.39 falls in the grey zone, indicating moderate risk but generally better solvency prospects:
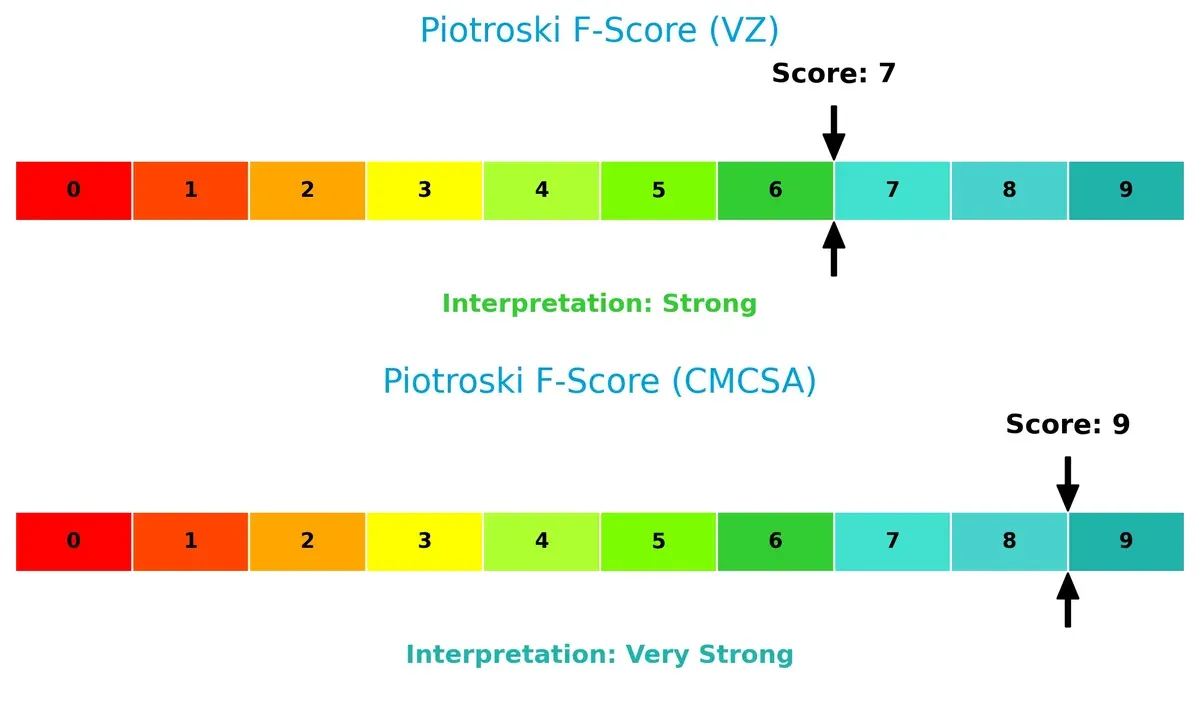
Financial Health: Quality of Operations
Comcast’s perfect Piotroski F-Score of 9 signals peak financial health with robust profitability, liquidity, and operational efficiency. Verizon’s score of 7 is strong but reveals minor red flags compared to Comcast’s pristine metrics:
How are the two companies positioned?
This section dissects Verizon and Comcast’s operational DNA by comparing revenue distribution and internal dynamics. The goal is to confront their economic moats and identify which model delivers the most resilient competitive advantage today.
Revenue Segmentation: The Strategic Mix
This visual comparison dissects how Verizon Communications and Comcast Corporation diversify income streams and where their primary sector bets lie:
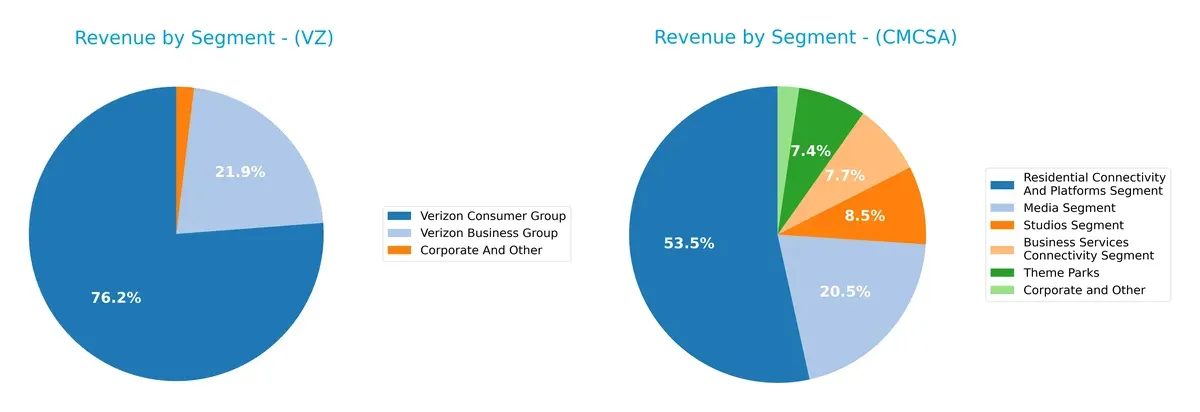
Verizon anchors revenue in its Consumer Group with $103B in 2024, overshadowing its Business Group at $29.5B. Comcast shows a more balanced portfolio: Residential Connectivity leads at $71.6B, but Media ($28.1B), Studios ($11.1B), and Theme Parks ($8.6B) also contribute sizable shares. Verizon’s heavy consumer telecom focus risks concentration, whereas Comcast’s diverse media and connectivity mix supports ecosystem lock-in and revenue resilience.
Strengths and Weaknesses Comparison
This table compares the strengths and weaknesses of Verizon Communications Inc. and Comcast Corporation:
Verizon Strengths
- Diverse revenue from Business and Consumer groups
- Favorable net margin (12.43%) and ROE (16.44%)
- Low WACC (4%) indicating cost-effective capital
- Strong dividend yield at 6.67%
Comcast Strengths
- Higher net margin (16.01%) and ROE (20.44%)
- Favorable debt-to-equity ratio (0.06) and interest coverage (6.84)
- Broad segment diversity including Media, Studios, Theme Parks
- Global revenue presence including Europe and Other locations
Verizon Weaknesses
- Current ratio below 1 (0.91) signaling liquidity risk
- High debt-to-equity (1.92) indicating leverage concerns
- Low asset turnover (0.34) reflecting asset inefficiency
- Neutral ROIC (6.22%) barely above WACC (4%)
Comcast Weaknesses
- Current ratio below 1 (0.88) also indicates liquidity pressure
- Neutral asset turnover (0.66) suggests moderate asset use efficiency
- ROIC (9.88%) only modestly above WACC (5.27%)
Verizon shows solid profitability but faces balance sheet leverage and liquidity challenges. Comcast excels in profitability with stronger capital structure metrics and global footprint. Both companies must manage liquidity carefully to support growth strategies.
The Moat Duel: Analyzing Competitive Defensibility
A structural moat defends long-term profits from relentless competition and market shifts. Only a durable advantage ensures lasting value creation:
Verizon Communications Inc.: Switching Costs Moat
Verizon’s primary moat lies in high switching costs embedded in its wireless and fixed connectivity services. This manifests in stable margins despite modest revenue growth. In 2026, expanding 5G and IoT solutions could deepen this advantage, though margin pressures persist.
Comcast Corporation: Scale and Content Ecosystem Moat
Comcast leverages a vast content ecosystem combined with scale in cable and media services, contrasting Verizon’s telecom focus. Its ROIC growth shows efficient capital use and margin expansion. Opportunities include streaming platform growth and international expansion in 2026.
Scale and Ecosystem vs. Switching Costs: The Strategic Moat Battle
Comcast’s growing ROIC and content ecosystem provide a wider moat compared to Verizon’s stable but declining profitability from switching costs. Comcast is better positioned to defend and expand its market share.
Which stock offers better returns?
Over the past year, Verizon Communications Inc. gained 17.3%, showing accelerating bullish momentum, while Comcast Corporation declined 26.7% despite recent recovery signs.
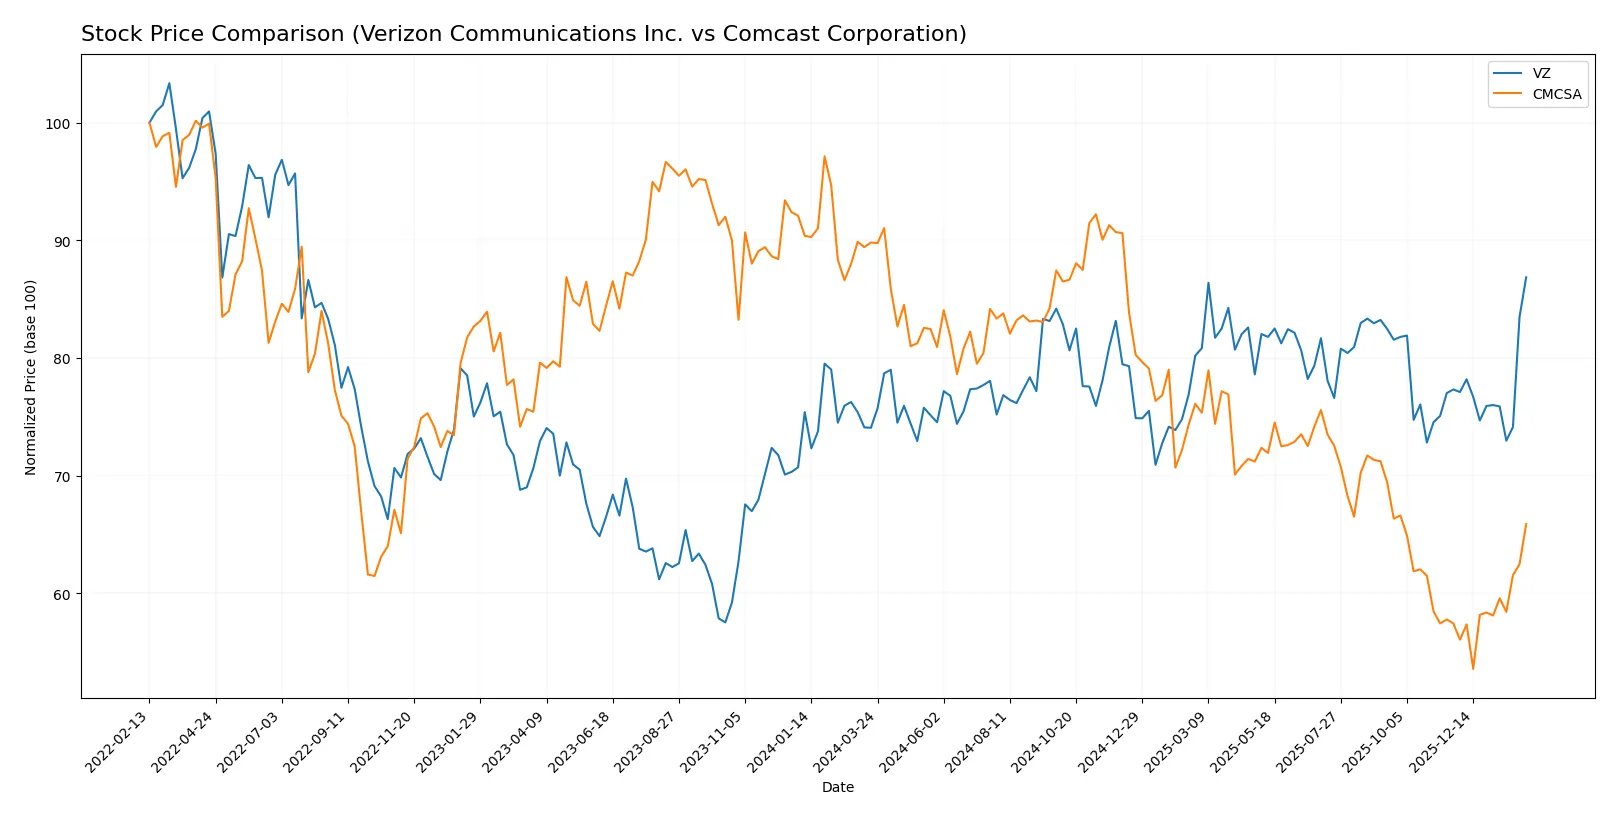
Trend Comparison
Verizon’s stock rose 17.3% over 12 months, confirming a bullish trend with accelerating gains and a relatively low 1.85 volatility. Its recent 12-week trend gained 12.3% with a steady positive slope.
Comcast’s stock fell 26.7% over the same period, marking a bearish trend with increasing acceleration and high 4.74 volatility. However, its recent trend shows a 14.7% rise, indicating a short-term rebound.
Verizon outperformed Comcast with a sustained 17.3% gain versus Comcast’s overall 26.7% loss, despite Comcast’s recent recovery momentum.
Target Prices
Analysts present a moderate target price consensus for Verizon Communications Inc. and Comcast Corporation, reflecting cautious optimism.
| Company | Target Low | Target High | Consensus |
|---|---|---|---|
| Verizon Communications Inc. | 44 | 54 | 48.28 |
| Comcast Corporation | 23 | 40 | 32.71 |
Verizon’s consensus target of 48.28 sits just above its current price of 46.31, implying limited upside. Comcast’s consensus target at 32.71 slightly exceeds its current 31.37, signaling modest growth expectations.

Don’t Let Luck Decide Your Entry Point
Optimize your entry points with our advanced ProRealTime indicators. You’ll get efficient buy signals with precise price targets for maximum performance. Start outperforming now!
How do institutions grade them?
Here is a summary of institutional grades assigned to Verizon Communications Inc. and Comcast Corporation:
Verizon Communications Inc. Grades
The table below shows recent grades from major financial institutions for Verizon Communications Inc.
| Grading Company | Action | New Grade | Date |
|---|---|---|---|
| Citigroup | Maintain | Buy | 2026-02-03 |
| RBC Capital | Maintain | Sector Perform | 2026-02-03 |
| JP Morgan | Maintain | Neutral | 2026-02-03 |
| Evercore ISI Group | Maintain | Outperform | 2026-02-02 |
| Morgan Stanley | Maintain | Equal Weight | 2026-02-02 |
| Scotiabank | Maintain | Sector Perform | 2026-02-02 |
| Wells Fargo | Maintain | Equal Weight | 2026-02-02 |
| Wells Fargo | Maintain | Equal Weight | 2026-01-26 |
| Bernstein | Maintain | Market Perform | 2026-01-16 |
| Morgan Stanley | Maintain | Equal Weight | 2025-12-10 |
Comcast Corporation Grades
Below are recent institutional grades for Comcast Corporation from recognized analysts.
| Grading Company | Action | New Grade | Date |
|---|---|---|---|
| Rosenblatt | Maintain | Neutral | 2026-01-30 |
| TD Cowen | Maintain | Buy | 2026-01-30 |
| Citigroup | Maintain | Buy | 2026-01-30 |
| Scotiabank | Maintain | Sector Perform | 2026-01-30 |
| Bernstein | Maintain | Market Perform | 2026-01-16 |
| Barclays | Maintain | Equal Weight | 2026-01-13 |
| B of A Securities | Upgrade | Buy | 2026-01-12 |
| Benchmark | Maintain | Buy | 2026-01-06 |
| Morgan Stanley | Maintain | Equal Weight | 2025-12-10 |
| Rosenblatt | Maintain | Neutral | 2025-12-01 |
Which company has the best grades?
Comcast Corporation shows a stronger consensus with multiple Buy ratings and an upgrade from B of A Securities. Verizon’s grades are more mixed with several Equal Weight and Sector Perform ratings. Investors may view Comcast’s more bullish grades as a signal of higher confidence among analysts.
Risks specific to each company
The following categories identify the critical pressure points and systemic threats facing both firms in the 2026 market environment:
1. Market & Competition
Verizon Communications Inc.
- Faces intense competition in wireless and fixed connectivity with pressure on margins.
Comcast Corporation
- Competes across diversified sectors including media, broadband, and theme parks, facing cross-industry challenges.
2. Capital Structure & Debt
Verizon Communications Inc.
- High debt-to-equity ratio at 1.92 signals leverage risk and limits financial flexibility.
Comcast Corporation
- Extremely low debt-to-equity at 0.06 indicates strong balance sheet and lower financial risk.
3. Stock Volatility
Verizon Communications Inc.
- Low beta of 0.316 suggests less price volatility, appealing to conservative investors.
Comcast Corporation
- Beta of 0.793 indicates higher volatility, reflecting broader market sensitivity.
4. Regulatory & Legal
Verizon Communications Inc.
- Subject to stringent telecom regulations impacting pricing and network expansion.
Comcast Corporation
- Faces complex regulations across media, broadcasting, and telecom sectors, increasing compliance costs.
5. Supply Chain & Operations
Verizon Communications Inc.
- Operational challenges in network infrastructure upgrades and device supply constraints.
Comcast Corporation
- Diverse operations face supply chain complexities across technology, media production, and park operations.
6. ESG & Climate Transition
Verizon Communications Inc.
- Pressure to reduce carbon footprint in network operations and improve sustainability reporting.
Comcast Corporation
- ESG risks arise from energy use in theme parks and media production, requiring active climate strategies.
7. Geopolitical Exposure
Verizon Communications Inc.
- Limited direct geopolitical risks but vulnerable to global supply chain disruptions.
Comcast Corporation
- International media and theme park operations expose Comcast to geopolitical and currency risks.
Which company shows a better risk-adjusted profile?
Verizon’s most significant risk is its high leverage, evident in a debt-to-equity ratio of 1.92 and an Altman Z-score in the distress zone (1.29). Comcast’s key risk lies in operational complexity across diverse sectors, but its strong balance sheet and a safer Altman Z-score (2.39) mitigate this. Comcast’s favorable debt profile and very strong Piotroski score (9) support a superior risk-adjusted profile. Recent data show Verizon’s financial distress signals outweigh Comcast’s broader operational risks.
Final Verdict: Which stock to choose?
Verizon Communications Inc. boasts a superpower in its robust cash generation and consistent value creation, evidenced by its ROIC exceeding WACC. However, its declining profitability and stretched balance sheet remain points of vigilance. It suits portfolios seeking steady income with moderate growth—typically aligned with conservative or dividend-focused investors.
Comcast Corporation’s strategic moat lies in its growing ROIC and strong operating efficiency, supported by a healthier balance sheet and superior profitability trends. Its safety profile surpasses Verizon’s, offering a more favorable risk-return balance. Comcast fits well in Growth at a Reasonable Price (GARP) portfolios aiming for capital appreciation with controlled risk.
If you prioritize reliable cash flow and income stability, Verizon presents a compelling case despite some margin pressures. However, if you seek growth fueled by improving profitability and stronger financial health, Comcast outshines Verizon, commanding a premium for its sustainable competitive advantage and operational momentum.
Disclaimer: Investment carries a risk of loss of initial capital. The past performance is not a reliable indicator of future results. Be sure to understand risks before making an investment decision.
Go Further
I encourage you to read the complete analyses of Verizon Communications Inc. and Comcast Corporation to enhance your investment decisions: