Home > Comparison > Communication Services > TMUS vs CMCSA
The strategic rivalry between T-Mobile US, Inc. and Comcast Corporation shapes the future of Communication Services. T-Mobile operates as a capital-intensive mobile network provider with a focus on wireless connectivity. Comcast, by contrast, is a diversified media and technology conglomerate spanning cable, content, and theme parks. This analysis examines their contrasting models to identify which offers superior risk-adjusted returns for a diversified portfolio in an evolving digital landscape.
Table of contents
Companies Overview
T-Mobile US and Comcast Corporation stand as titans shaping the US telecommunications landscape with distinct market roles.
T-Mobile US, Inc.: Mobile Communications Powerhouse
T-Mobile US dominates the mobile telecommunications market, serving 108.7M customers across postpaid, prepaid, and wholesale segments. Its revenue stems primarily from voice, messaging, and data services. In 2021, T-Mobile focused on expanding its network infrastructure, operating 102K macro cell sites and 41K small cell sites, underpinning its competitive edge in wireless connectivity.
Comcast Corporation: Media and Technology Giant
Comcast operates as a diversified media and technology powerhouse, generating revenue from broadband, video, voice, and wireless services under the Xfinity brand. It also owns NBCUniversal’s content platforms, film studios, and global theme parks. In 2021, Comcast emphasized content delivery and consumer services integration, leveraging its broad portfolio to capture multiple segments within telecommunications and entertainment.
Strategic Collision: Similarities & Divergences
Both companies pursue growth in telecommunications but differ fundamentally: T-Mobile centers on a mobile-first wireless network, while Comcast integrates wired broadband with rich media content. Their primary battleground lies in broadband and wireless service penetration. Investors face contrasting profiles—T-Mobile as a pure-play wireless disruptor and Comcast as a diversified media conglomerate with expansive infrastructure.
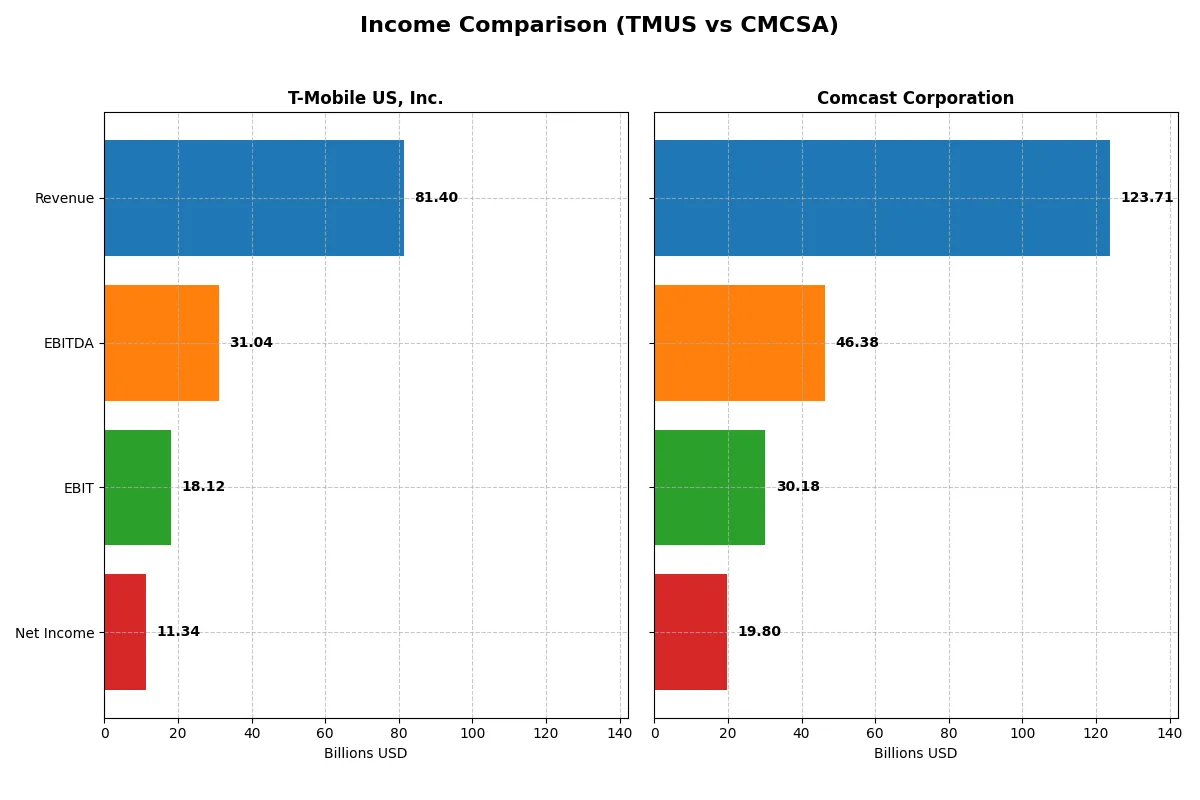
Income Statement Comparison
This data dissects the core profitability and scalability of both corporate engines to reveal who dominates the bottom line:
| Metric | T-Mobile US, Inc. (TMUS) | Comcast Corporation (CMCSA) |
|---|---|---|
| Revenue | 81.4B | 123.7B |
| Cost of Revenue | 29.7B | 51.8B |
| Operating Expenses | 33.7B | 48.6B |
| Gross Profit | 51.7B | 71.9B |
| EBITDA | 31.0B | 37.6B |
| EBIT | 18.1B | 22.8B |
| Interest Expense | 3.4B | 4.1B |
| Net Income | 11.3B | 16.2B |
| EPS | 9.7 | 4.17 |
| Fiscal Year | 2024 | 2024 |
Income Statement Analysis: The Bottom-Line Duel
This income statement comparison reveals which company operates its business more efficiently and grows profitably over time.
T-Mobile US, Inc. Analysis
T-Mobile’s revenue grew steadily from $68B in 2020 to $81.4B in 2024, with net income surging from $3B to $11.3B. Its gross margin improved to 63.6%, and net margin reached 13.9%, reflecting strong operational leverage. The 2024 year showed robust momentum with a 31.6% net margin growth and a 39.4% EPS increase, signaling rising profitability.
Comcast Corporation Analysis
Comcast’s revenue hovered around $121B-$124B from 2021 to 2025, ending at $123.7B in 2025, with net income climbing from $14.2B in 2021 to $20B in 2025. Gross margin remained solid at 60.1%, with the net margin at 16%. Despite flat revenue in 2025 (-0.02%), EBIT and net margin grew over 22%, showing efficiency gains and earnings resilience.
Margin Expansion vs. Scale Stability
T-Mobile outpaces Comcast in revenue growth (19% vs. 6.3%) and net income surge (270% vs. 40%) over their respective periods. Comcast’s higher net margin (16% vs. 13.9%) reflects superior scale benefits. T-Mobile’s rapid margin expansion and EPS growth highlight a dynamic growth profile, while Comcast’s stable scale and margin indicate steady cash flow generation. Investors seeking growth might favor T-Mobile’s accelerating profitability; those prioritizing stable margins may prefer Comcast’s scale.
Financial Ratios Comparison
These vital ratios act as a diagnostic tool to expose the underlying fiscal health, valuation premiums, and capital efficiency of each company:
| Ratios | T-Mobile US, Inc. (TMUS) | Comcast Corporation (CMCSA) |
|---|---|---|
| ROE | 18.37% | 20.44% |
| ROIC | 7.05% | 9.88% |
| P/E | 22.76 | 5.14 |
| P/B | 4.18 | 1.05 |
| Current Ratio | 0.91 | 0.88 |
| Quick Ratio | 0.83 | 0.88 |
| D/E (Debt-to-Equity) | 1.85 | 0.06 |
| Debt-to-Assets | 54.99% | 3.18% |
| Interest Coverage | 5.28 | 4.69 |
| Asset Turnover | 0.39 | 0.66 |
| Fixed Asset Turnover | 1.21 | 1.88 |
| Payout Ratio | 29.10% | 24.71% |
| Dividend Yield | 1.28% | 4.81% |
| Fiscal Year | 2024 | 2025 |
Efficiency & Valuation Duel: The Vital Signs
Financial ratios serve as the company’s DNA, exposing hidden risks and operational excellence that shape investor confidence and valuation.
T-Mobile US, Inc.
T-Mobile posts a strong 18.37% ROE and a solid 13.93% net margin, signaling efficient profitability. Its P/E of 22.76 suggests a fairly valued stock but a high PB ratio of 4.18 raises caution. The company offers a modest 1.28% dividend yield, indicating a balanced approach between shareholder returns and reinvestment.
Comcast Corporation
Comcast delivers robust profitability with a 20.44% ROE and 16.01% net margin, outperforming peers. Its valuation is attractive, with a low P/E of 5.14 and PB of 1.05, implying the stock is undervalued. Comcast rewards shareholders well through a 4.81% dividend yield, reflecting strong cash flow and capital discipline.
Valuation Strength Meets Operational Efficiency
Comcast leads with superior profitability and undervaluation, coupled with a generous dividend, balancing risk and reward effectively. T-Mobile shows solid returns but carries valuation premium and leverage concerns. Growth-oriented investors may favor T-Mobile’s reinvestment, while income-focused investors might prefer Comcast’s steady dividends.
Which one offers the Superior Shareholder Reward?
T-Mobile US, Inc. (TMUS) pays a modest dividend yield of 1.28% with a 29% payout ratio, supported by stable free cash flow covering 45% of operating cash flow. Its buyback intensity is less explicit but growing. In contrast, Comcast Corporation (CMCSA) delivers a higher dividend yield near 4.8% with a payout ratio around 25%, backed by strong free cash flow coverage of 65%. Comcast also maintains aggressive buybacks, enhancing total returns. TMUS reinvests more heavily into growth, signaling a longer runway but lower near-term yield. I see Comcast’s balanced yield and buyback approach as more sustainable and superior for shareholders seeking total return in 2026.
Comparative Score Analysis: The Strategic Profile
The radar chart reveals the fundamental DNA and trade-offs of both firms, highlighting their financial strengths and vulnerabilities across key metrics:
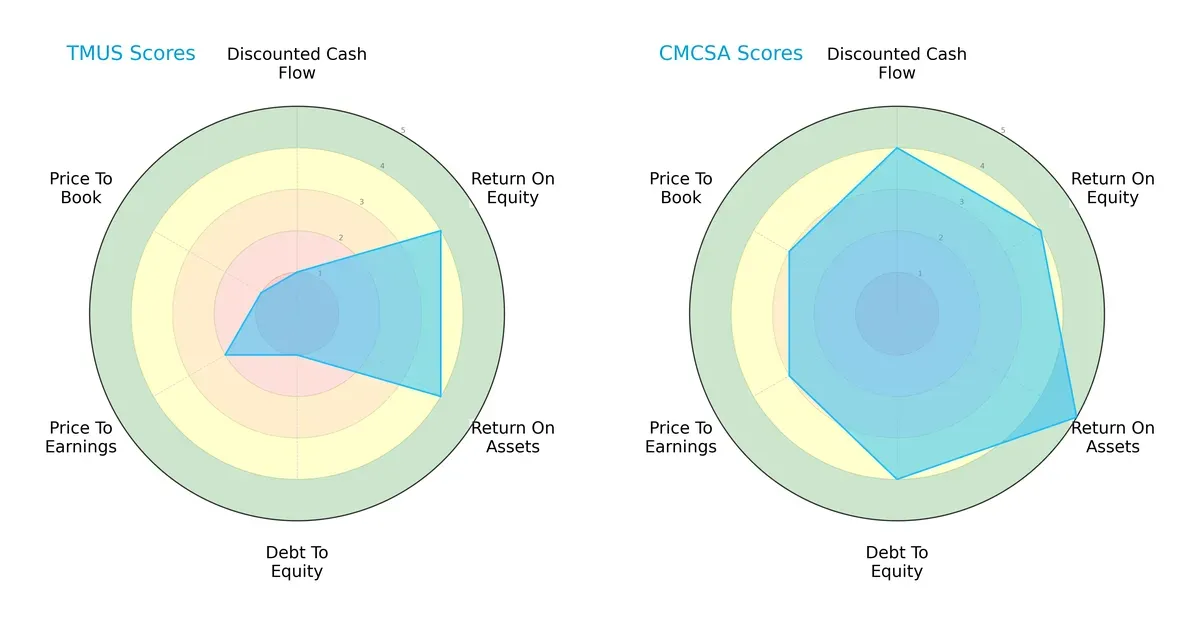
Comcast Corporation (CMCSA) presents a more balanced financial profile with strong scores in DCF (4), ROE (4), ROA (5), and a solid debt-to-equity score (4). T-Mobile US, Inc. (TMUS) relies heavily on operational efficiency (ROE 4, ROA 4) but struggles with valuation and leverage, scoring very low in debt-to-equity (1) and price-to-book (1). CMCSA’s diversified strengths suggest more stable capital allocation, while TMUS depends on profit generation amid financial risk.
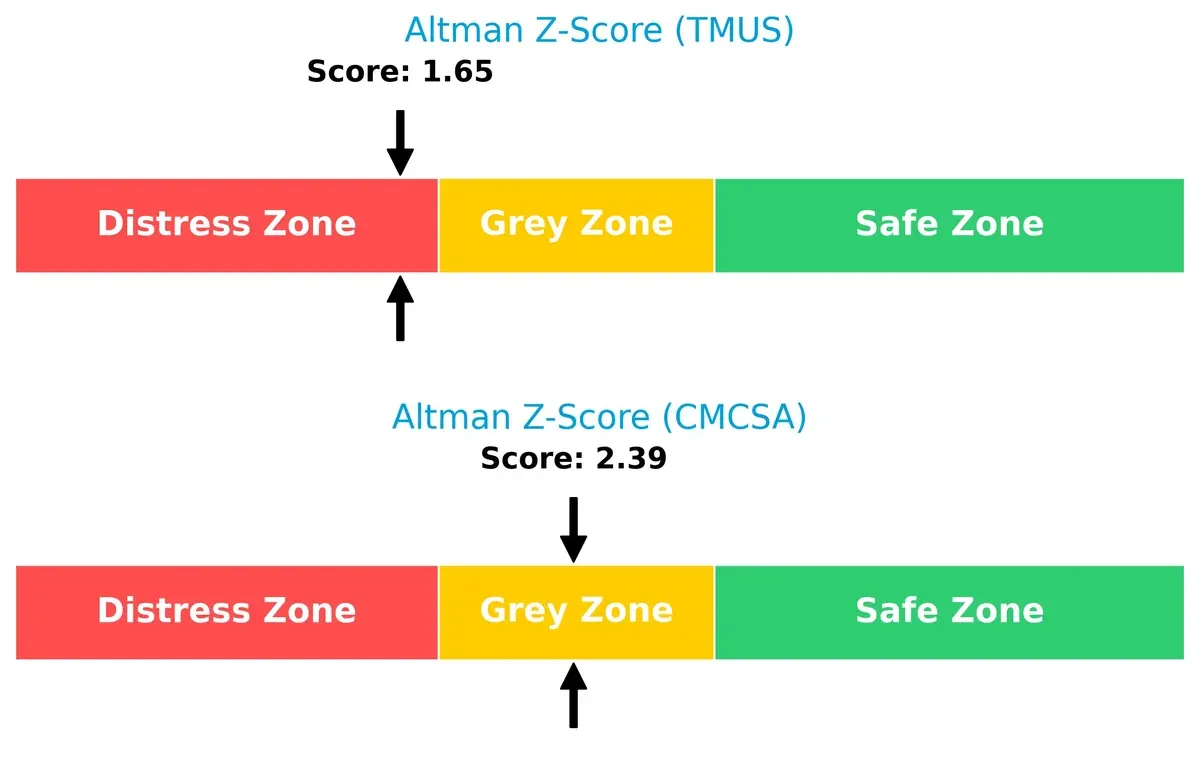
Bankruptcy Risk: Solvency Showdown
Comcast’s Altman Z-Score of 2.39 places it in the grey zone, indicating moderate bankruptcy risk. T-Mobile’s 1.65 signals distress, raising red flags about its long-term solvency in this cycle:
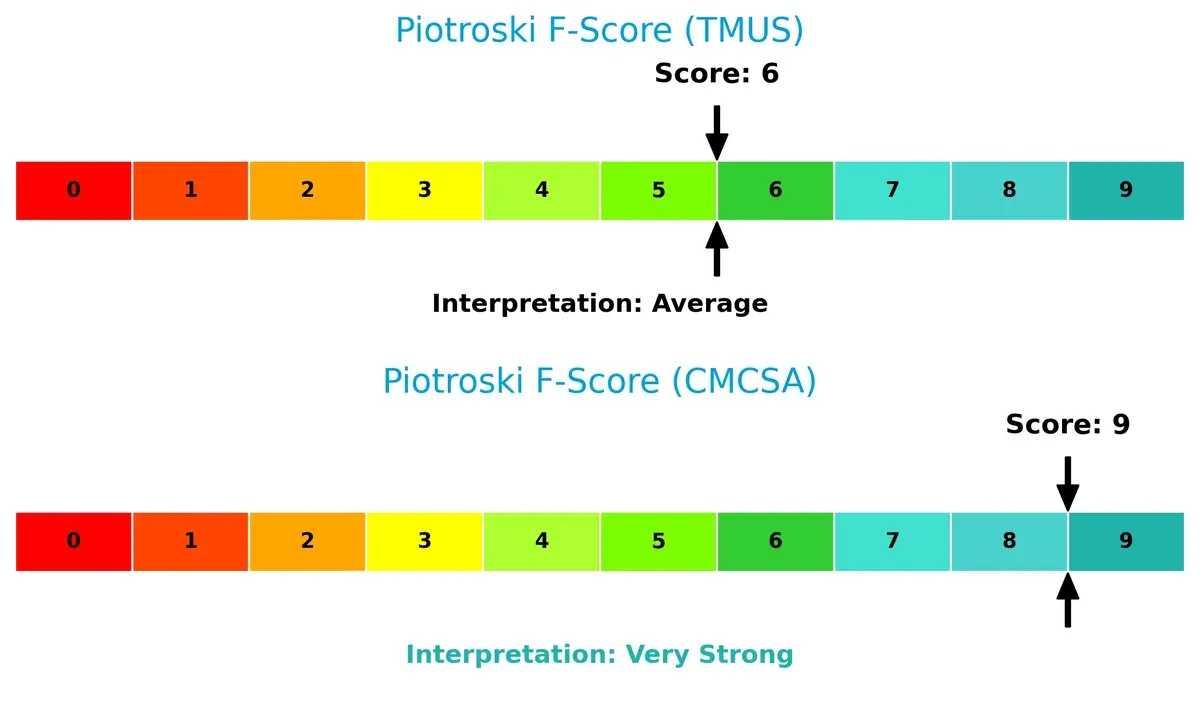
Financial Health: Quality of Operations
Comcast achieves a Piotroski F-Score of 9, reflecting very strong internal financial health. T-Mobile’s score of 6 is average, suggesting some operational weaknesses and potential red flags compared to Comcast:
How are the two companies positioned?
This section dissects TMUS and CMCSA’s operational DNA by comparing their revenue distribution and internal dynamics. The goal is to confront their economic moats to identify the most resilient, sustainable competitive advantage today.
Revenue Segmentation: The Strategic Mix
The following visual comparison dissects how both firms diversify their income streams and where their primary sector bets lie:
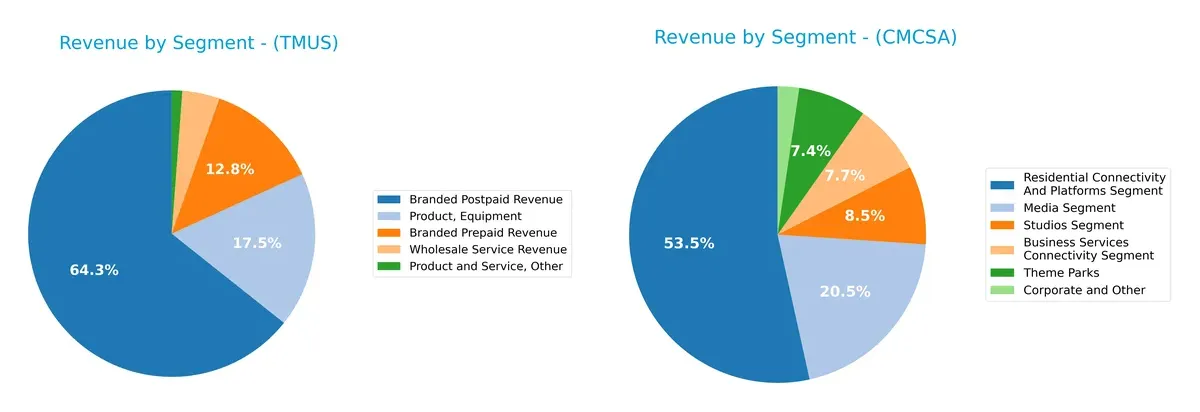
T-Mobile US leans heavily on Branded Postpaid Revenue at $52.3B, anchoring its income with wireless services. It also generates $14.3B from equipment sales, showing some diversification. Comcast’s revenue mix spreads widely, with Residential Connectivity and Platforms dominating at $71.6B, but substantial contributions from Media ($28.1B), Studios ($11.1B), and Theme Parks ($8.6B) diversify its base. Comcast’s broad mix reduces concentration risk; T-Mobile’s focus highlights dependency on telecom services.
Strengths and Weaknesses Comparison
This table compares the strengths and weaknesses of T-Mobile US, Inc. and Comcast Corporation:
TMUS Strengths
- Strong net margin at 13.93%
- Favorable ROE at 18.37%
- WACC below ROIC indicating efficient capital use
- Diverse revenue streams including prepaid, postpaid, and equipment sales
- Favorable interest coverage ratio at 5.31
CMCSA Strengths
- Higher net margin at 16.01%
- Strong ROE at 20.44%
- Low debt-to-equity ratio at 0.06
- Favorable P/E and P/B ratios signaling market confidence
- Diverse business segments including media, connectivity, studios, and theme parks
- Significant global presence with $30B+ revenue outside the US
TMUS Weaknesses
- High debt-to-assets at 54.99%
- Unfavorable current ratio below 1 signals liquidity risk
- Elevated debt-to-equity ratio at 1.85
- Asset turnover low at 0.39, indicating less efficient asset use
- Price-to-book ratio is unfavorable at 4.18
CMCSA Weaknesses
- Current ratio below 1 at 0.88 is a liquidity concern
- Neutral asset turnover at 0.66 implies moderate operational efficiency
- Exposure to intersegment eliminations reduces reported revenues
- Dividend yield moderate at 4.81%, may not attract income-focused investors
Overall, T-Mobile shows solid profitability but carries higher leverage and liquidity risks, limiting financial flexibility. Comcast presents stronger profitability and capital structure with more diversified global operations, though it shares some liquidity concerns. These factors shape each company’s financial resilience and strategic options.
The Moat Duel: Analyzing Competitive Defensibility
A structural moat is the only reliable shield protecting long-term profits from relentless competitive erosion. I focus on how two telecom giants defend their turf:
T-Mobile US, Inc.: Network Effects Powerhouse
T-Mobile’s primary moat stems from strong network effects, serving 108.7M customers. Its high ROIC exceeding WACC by 2.13% signals efficient capital use and margin stability. Emerging 5G and IoT expansions in 2026 could deepen this moat.
Comcast Corporation: Diversified Content & Infrastructure Fortress
Comcast contrasts with T-Mobile by leveraging a diversified moat of bundled content, broadband, and media assets. Its ROIC premium of 4.6% over WACC confirms robust value creation. Expansion in streaming and international broadband offers growth avenues.
Network Effects vs. Content Bundling: The Moat Showdown
Both firms boast very favorable moats with growing ROIC trends. Comcast’s wider moat benefits from diversified revenue streams, while T-Mobile’s deeper network effects secure customer loyalty. Comcast is better positioned to defend market share amid evolving consumer demands.
Which stock offers better returns?
The past year shows T-Mobile US with a strong 22% gain decelerating recently, while Comcast dropped 27% overall but gained nearly 15% in the last quarter.
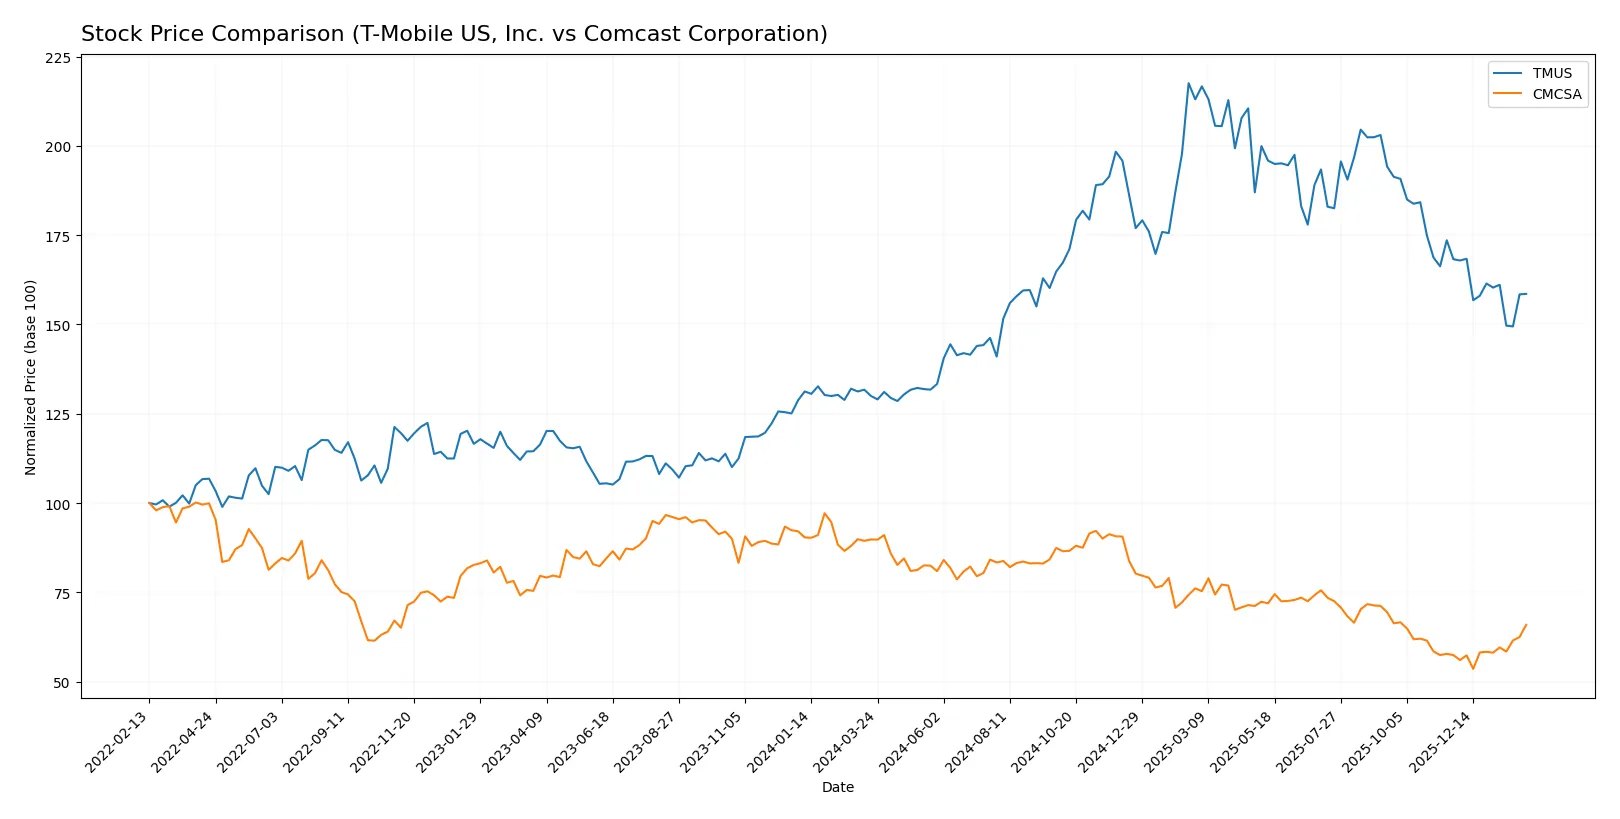
Trend Comparison
T-Mobile US exhibits a bullish 22% rise over 12 months, with decelerating momentum and high volatility, peaking at $270.82 and bottoming at $160.05.
Comcast trends bearish, losing 27% in a year despite accelerating decline; recent months show a 15% rebound with low volatility, from $25.51 to $43.91 highs.
T-Mobile US outperformed Comcast over the year, delivering stronger total returns despite recent deceleration and volatility.
Target Prices
Analysts present a cautiously optimistic target consensus for T-Mobile US and Comcast Corporation.
| Company | Target Low | Target High | Consensus |
|---|---|---|---|
| T-Mobile US, Inc. | 225 | 310 | 260.75 |
| Comcast Corporation | 23 | 40 | 32.71 |
The target consensus for T-Mobile suggests a potential upside of roughly 32% from its current 197.39 price. Comcast’s targets imply a modest 4% upside relative to its current 31.37 price.

Don’t Let Luck Decide Your Entry Point
Optimize your entry points with our advanced ProRealTime indicators. You’ll get efficient buy signals with precise price targets for maximum performance. Start outperforming now!
How do institutions grade them?
Here is a summary of recent institutional grades for T-Mobile US, Inc. and Comcast Corporation:
T-Mobile US, Inc. Grades
The following table lists recent grades and actions by major grading companies for T-Mobile US, Inc.:
| Grading Company | Action | New Grade | Date |
|---|---|---|---|
| Wells Fargo | Maintain | Overweight | 2026-01-26 |
| Bernstein | Maintain | Market Perform | 2026-01-16 |
| Citigroup | Maintain | Neutral | 2025-12-19 |
| Goldman Sachs | Maintain | Buy | 2025-12-12 |
| Morgan Stanley | Maintain | Overweight | 2025-12-10 |
| Argus Research | Maintain | Buy | 2025-12-09 |
| Keybanc | Upgrade | Sector Weight | 2025-12-02 |
| Oppenheimer | Downgrade | Perform | 2025-11-21 |
| Tigress Financial | Maintain | Buy | 2025-11-11 |
| Morgan Stanley | Maintain | Overweight | 2025-10-27 |
Comcast Corporation Grades
The following table lists recent grades and actions by major grading companies for Comcast Corporation:
| Grading Company | Action | New Grade | Date |
|---|---|---|---|
| Rosenblatt | Maintain | Neutral | 2026-01-30 |
| TD Cowen | Maintain | Buy | 2026-01-30 |
| Citigroup | Maintain | Buy | 2026-01-30 |
| Scotiabank | Maintain | Sector Perform | 2026-01-30 |
| Bernstein | Maintain | Market Perform | 2026-01-16 |
| Barclays | Maintain | Equal Weight | 2026-01-13 |
| B of A Securities | Upgrade | Buy | 2026-01-12 |
| Benchmark | Maintain | Buy | 2026-01-06 |
| Morgan Stanley | Maintain | Equal Weight | 2025-12-10 |
| Rosenblatt | Maintain | Neutral | 2025-12-01 |
Which company has the best grades?
T-Mobile US has a mix of Buy and Overweight ratings, with some downgrades to Perform, showing moderate confidence. Comcast holds more consistent Buy ratings and recent upgrades, suggesting stronger institutional support. This difference may influence investors seeking stocks with steadier positive outlooks.
Risks specific to each company
The following categories identify the critical pressure points and systemic threats facing both firms in the 2026 market environment:
1. Market & Competition
T-Mobile US, Inc.
- Faces intense competition in US telecom with saturation risks and need for network upgrades.
Comcast Corporation
- Competes across media, broadband, and streaming; must innovate amid cord-cutting and shifting consumer habits.
2. Capital Structure & Debt
T-Mobile US, Inc.
- High debt-to-equity (1.85) and debt-to-assets (55%) ratios pose financial leverage risks.
Comcast Corporation
- Very low debt-to-equity (0.06) and debt-to-assets (3%) ratios provide strong financial flexibility.
3. Stock Volatility
T-Mobile US, Inc.
- Beta of 0.435 indicates low market sensitivity, but high valuation multiples add vulnerability.
Comcast Corporation
- Beta of 0.793 shows moderate market sensitivity, supported by more stable valuation metrics.
4. Regulatory & Legal
T-Mobile US, Inc.
- Subject to telecom regulatory scrutiny and spectrum licensing risks.
Comcast Corporation
- Faces media ownership regulations and antitrust scrutiny in content and distribution.
5. Supply Chain & Operations
T-Mobile US, Inc.
- Network infrastructure investments strain capital; supply chain delays for devices possible.
Comcast Corporation
- Diverse operations including theme parks add operational complexity and exposure to discretionary spending cycles.
6. ESG & Climate Transition
T-Mobile US, Inc.
- Moderate ESG focus; energy use in network operations a transition cost factor.
Comcast Corporation
- Growing ESG initiatives but media and theme parks face carbon footprint challenges.
7. Geopolitical Exposure
T-Mobile US, Inc.
- Primarily US-focused, limiting direct geopolitical risks but sensitive to domestic policy shifts.
Comcast Corporation
- Global exposure through Sky segment increases vulnerability to international regulatory and political events.
Which company shows a better risk-adjusted profile?
T-Mobile’s biggest risk is its heavy debt load, raising financial vulnerability despite strong market position. Comcast’s largest risk lies in its complex operations and geopolitical exposure but benefits from a rock-solid balance sheet and diversified earnings. Comcast’s superior Altman Z-score (2.39 vs. 1.65) and stronger Piotroski score (9 vs. 6) confirm a more resilient risk-adjusted profile. Recent data reveal Comcast’s low debt-to-equity ratio (0.06) sharply contrasts with T-Mobile’s 1.85, underscoring Comcast’s financial stability advantage.
Final Verdict: Which stock to choose?
T-Mobile US, Inc. excels as a cash generator with a very favorable economic moat driven by rising ROIC above WACC. Its main point of vigilance lies in elevated leverage and liquidity metrics, which could amplify risk in downturns. It suits aggressive growth portfolios seeking high operational profitability and expansion potential.
Comcast Corporation’s strategic moat centers on robust free cash flow and a conservative balance sheet with low debt levels. It offers better stability compared to T-Mobile, backed by strong profitability metrics and a favorable valuation profile. It fits well in GARP portfolios blending growth with financial prudence.
If you prioritize dynamic growth and operational momentum, T-Mobile outshines with its expanding profitability but demands tolerance for financial leverage. However, if you seek steady cash generation and financial resilience, Comcast offers better stability and valuation comfort. Each stock aligns with distinct investor profiles, reflecting a trade-off between growth ambition and risk management.
Disclaimer: Investment carries a risk of loss of initial capital. The past performance is not a reliable indicator of future results. Be sure to understand risks before making an investment decision.
Go Further
I encourage you to read the complete analyses of T-Mobile US, Inc. and Comcast Corporation to enhance your investment decisions: