Home > Comparison > Communication Services > CMCSA vs CHTR
The strategic rivalry between Comcast Corporation and Charter Communications defines the current trajectory of the telecommunications services sector. Comcast operates as a diversified media and technology conglomerate, blending cable, media, and entertainment assets. Charter focuses on broadband connectivity and cable services with a customer-centric operational model. This analysis examines which company’s strategic path offers superior risk-adjusted returns for a diversified portfolio amid evolving sector dynamics.
Table of contents
Companies Overview
Comcast Corporation and Charter Communications, Inc. stand as pivotal players shaping the US telecommunications landscape in 2026.
Comcast Corporation: Diversified Media and Technology Leader
Comcast dominates as a media and technology powerhouse, generating revenue from broadband, video, voice, and wireless services under the Xfinity brand. It strategically expands through its Media segment, operating NBCUniversal’s cable and streaming platforms, and boosts growth via theme parks and international Sky services. In 2026, Comcast emphasizes integrated content delivery and direct-to-consumer offerings to cement its competitive edge.
Charter Communications, Inc.: Broadband Connectivity Specialist
Charter Communications excels as a broadband connectivity and cable operator, focusing on subscription-based video, high-speed internet, and voice services for residential and business customers. Its 2026 strategy revolves around enhancing in-home WiFi performance and expanding mobile services, targeting seamless connectivity and advanced broadband solutions. Charter serves approximately 32M customers across 41 states, leveraging its scale in regional sports and news networks.
Strategic Collision: Similarities & Divergences
Both companies compete aggressively in broadband and video services but differ in scope. Comcast pursues a diversified content ecosystem, blending media, technology, and theme parks, while Charter focuses on connectivity infrastructure and customer experience. Their key battleground is subscriber growth in broadband and streaming. Comcast offers a broad investment profile with media synergy, whereas Charter appeals through concentrated broadband scale and operational efficiency.
Income Statement Comparison
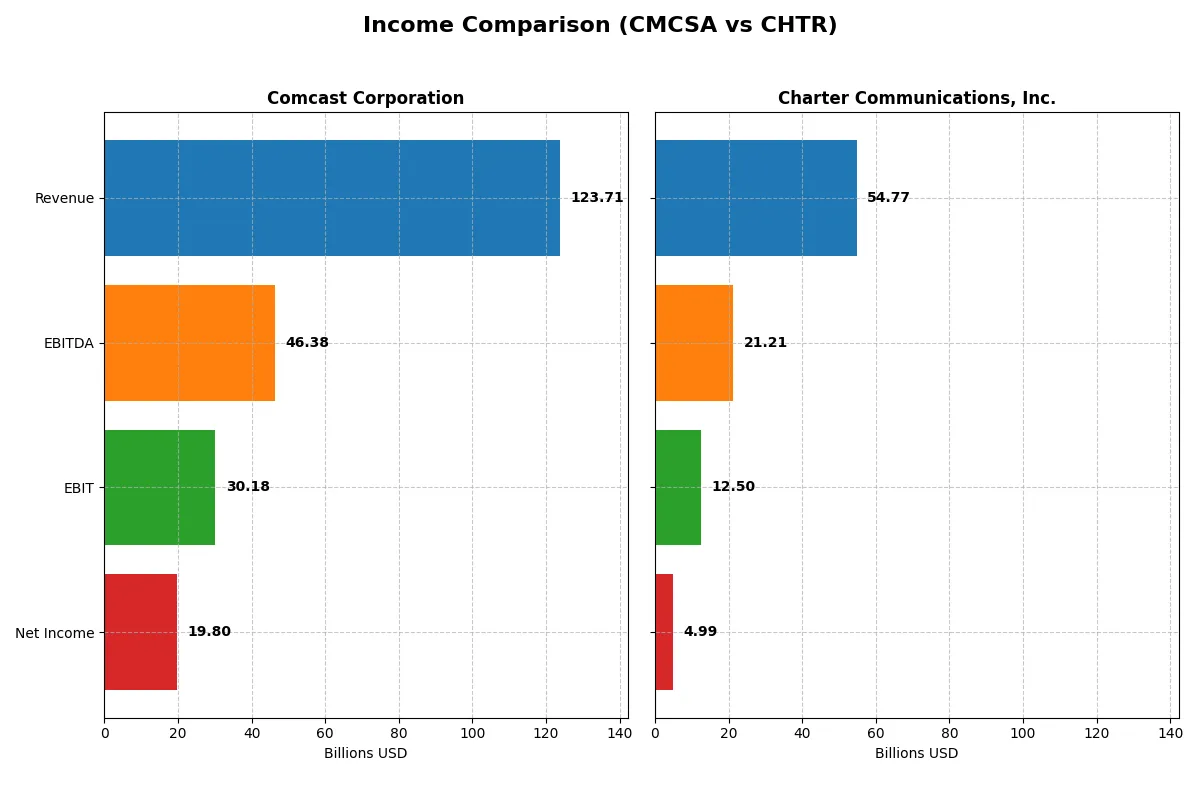
The following data dissects the core profitability and scalability of both corporate engines to reveal who dominates the bottom line:
| Metric | Comcast Corporation (CMCSA) | Charter Communications, Inc. (CHTR) |
|---|---|---|
| Revenue | 124B | 54.8B |
| Cost of Revenue | 49.4B | 29.4B |
| Operating Expenses | 53.6B | 12.0B |
| Gross Profit | 74.3B | 25.4B |
| EBITDA | 46.4B | 21.2B |
| EBIT | 30.2B | 12.5B |
| Interest Expense | 4.41B | 5.04B |
| Net Income | 19.8B | 5.0B |
| EPS | 5.41 | 36.9 |
| Fiscal Year | 2025 | 2025 |
Income Statement Analysis: The Bottom-Line Duel
This income statement comparison reveals how efficiently Comcast and Charter Communications convert revenue into profits and sustain margins.
Comcast Corporation Analysis
Comcast’s revenue held steady at around 124B in 2025, while net income surged 23% to 19.8B, reflecting strong operational momentum. Gross margin improved slightly to 60%, and net margin expanded to 16%, signaling effective cost control. The sharp EBIT growth of 32% underscores Comcast’s enhanced profitability and operational efficiency this year.
Charter Communications, Inc. Analysis
Charter’s revenue slipped slightly by 0.6% to 54.8B in 2025, with net income declining 2% to 5B amid rising interest expenses. Gross margin remained healthy at 46%, but net margin contracted to 9.1%, highlighting margin pressure. EBIT fell nearly 2%, suggesting challenges in maintaining earnings momentum despite solid operational cash flow.
Margin Strength vs. Revenue Stability
Comcast outperforms Charter with superior margin expansion and robust net income growth, despite flat revenue. Charter’s higher interest burden and shrinking EBIT weigh on profitability. For investors, Comcast’s profile offers stronger earnings leverage, while Charter’s scale and steady revenue may appeal to those favoring stability over margin power.
Financial Ratios Comparison
These vital ratios act as a diagnostic tool to expose underlying fiscal health, valuation premiums, and capital efficiency for the companies compared below:
| Ratios | Comcast (CMCSA) | Charter (CHTR) |
|---|---|---|
| ROE | 20.4% | 31.1% |
| ROIC | 9.9% | 7.2% |
| P/E | 5.1 | 5.7 |
| P/B | 1.05 | 1.76 |
| Current Ratio | 0.88 | 0.39 |
| Quick Ratio | 0.88 | 0.39 |
| D/E | 0.06 | 6.05 |
| Debt-to-Assets | 3.2% | 62.98% |
| Interest Coverage | 4.7 | 2.6 |
| Asset Turnover | 0.66 | 0.36 |
| Fixed Asset Turnover | 1.88 | 1.18 |
| Payout ratio | 25% | 0% |
| Dividend yield | 4.81% | 0% |
| Fiscal Year | 2025 | 2025 |
Efficiency & Valuation Duel: The Vital Signs
Financial ratios act as a company’s DNA, revealing hidden risks and operational excellence beyond surface-level metrics.
Comcast Corporation
Comcast posts robust profitability with a 20.44% ROE and a healthy 16.01% net margin, signaling efficient core operations. Its valuation appears attractive, boasting a low P/E of 5.14 and a P/B near 1.05, suggesting the stock is reasonably priced. Comcast rewards shareholders with a solid 4.81% dividend yield, reflecting strong free cash flow and disciplined capital allocation.
Charter Communications, Inc.
Charter delivers an impressive 31.06% ROE but a moderate 9.1% net margin, indicating high profitability on equity but operational pressure on margins. Its P/E of 5.66 implies reasonable valuation, though a higher P/B at 1.76 hints at some premium. Charter offers no dividend, instead reinvesting heavily for growth, but elevated debt ratios raise concerns on financial risk exposure.
Valuation Appeal vs. Financial Stability
Comcast offers a compelling balance of operational efficiency and shareholder returns with favorable valuation and manageable leverage. Charter’s exceptional ROE contrasts with its stretched debt and weaker liquidity, increasing risk. Investors prioritizing steady income and financial safety may prefer Comcast, while growth-focused profiles might tolerate Charter’s higher leverage.
Which one offers the Superior Shareholder Reward?
Comcast (CMCSA) pays a 4.81% dividend yield with a sustainable 25% payout ratio and solid 65% free cash flow coverage. It also executes steady buybacks, enhancing shareholder returns. Charter (CHTR) pays no dividend, reinvesting heavily in growth and acquisitions, but its high leverage and modest 27% free cash flow conversion raise sustainability concerns. Comcast’s balanced distribution through dividends and buybacks offers a more reliable total return profile for 2026 investors.
Comparative Score Analysis: The Strategic Profile
The radar chart reveals the fundamental DNA and trade-offs of both firms, highlighting their core financial strengths and weaknesses:
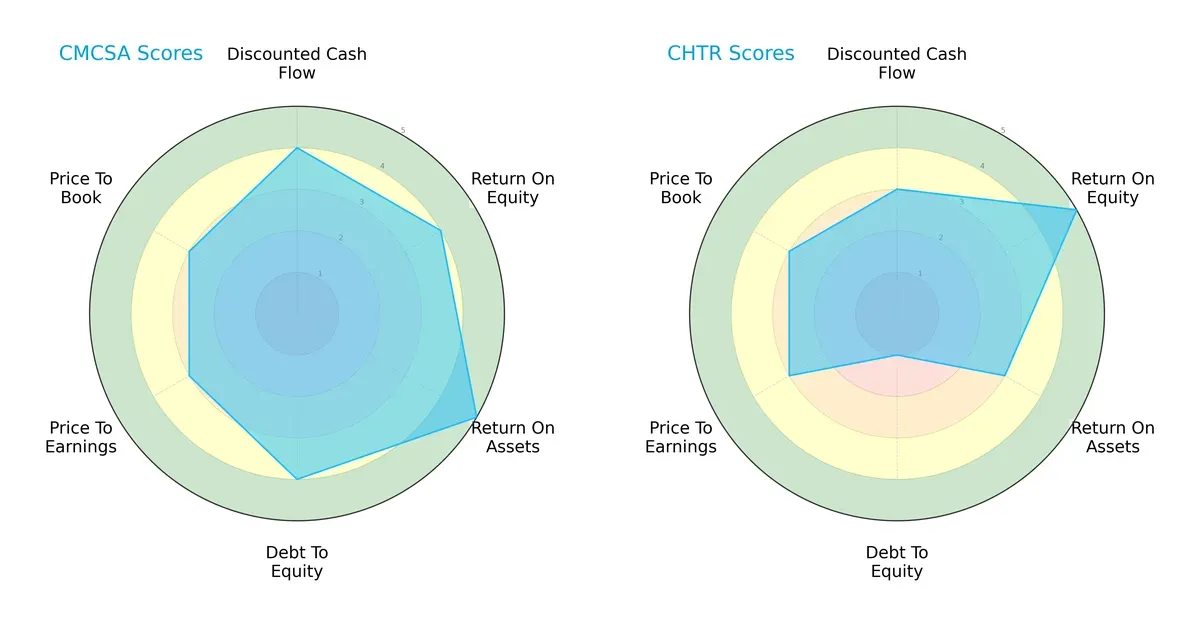
Comcast (CMCSA) shows a balanced profile with strong ROA (5) and solid scores across DCF (4), ROE (4), and Debt/Equity (4). Charter (CHTR) leverages a high ROE (5) but suffers from a weak Debt/Equity score (1), signaling higher financial risk. Comcast’s diversified strength contrasts with Charter’s reliance on operational efficiency at the cost of leverage risk.
Bankruptcy Risk: Solvency Showdown
The Altman Z-Score gap signals a material difference in long-term survival prospects in this market cycle:
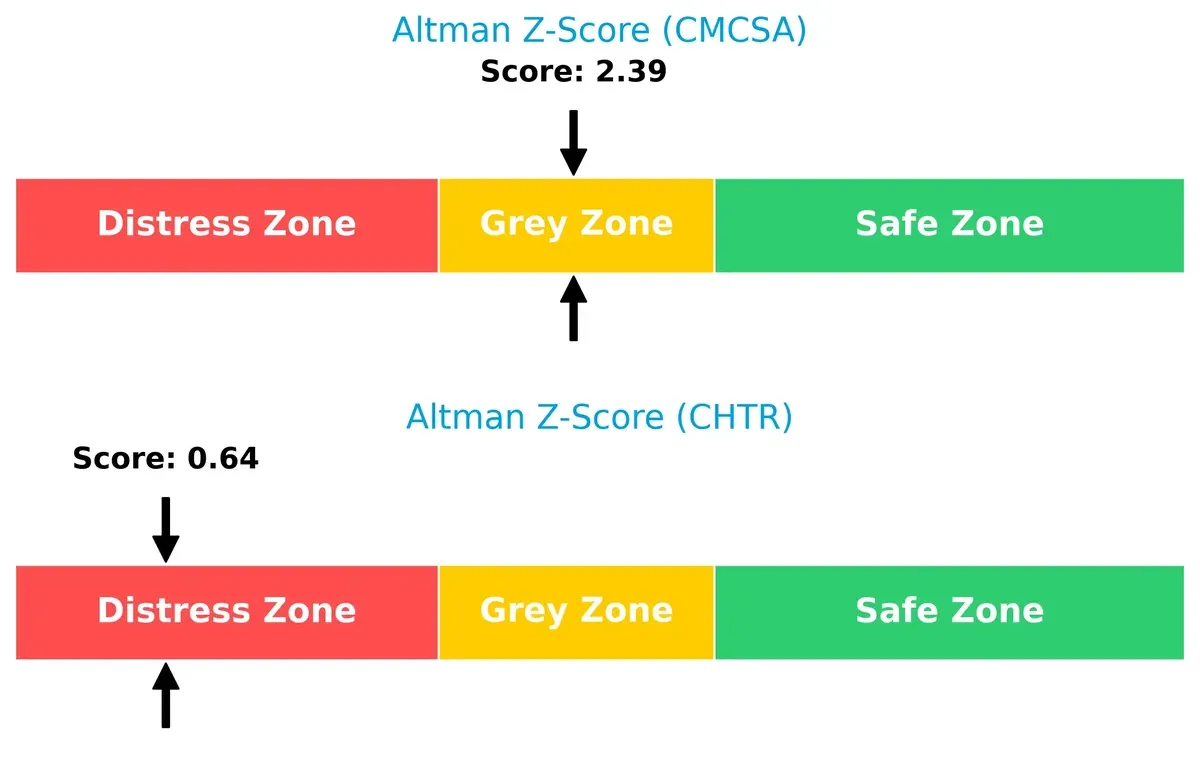
Comcast scores 2.39, placing it in the grey zone of moderate bankruptcy risk. Charter’s 0.64 score falls into the distress zone, indicating a significant risk of financial distress if adverse conditions persist. This metric favors Comcast’s more resilient capital structure.
Financial Health: Quality of Operations
Piotroski F-Scores reveal clear differences in operational quality and financial prudence:
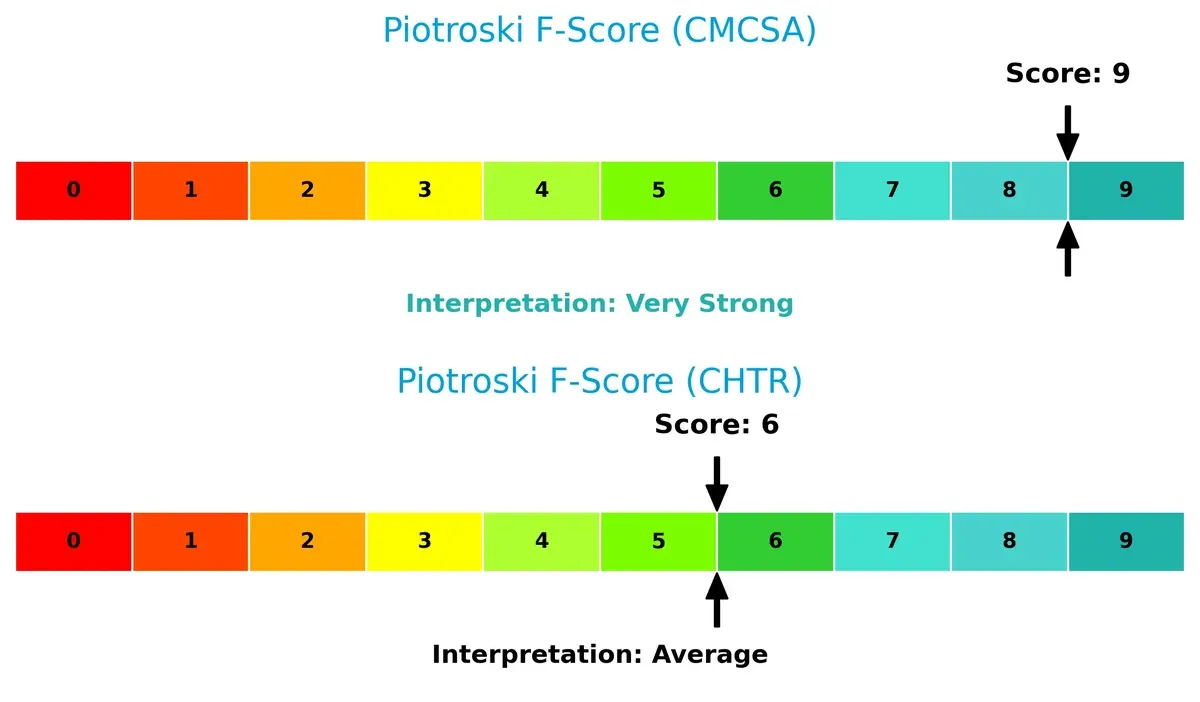
Comcast’s perfect score of 9 signals peak financial health and robust internal controls. Charter’s 6, while decent, suggests some red flags in profitability or efficiency metrics. Comcast demonstrates superior operational quality and risk management compared to Charter’s average standing.
How are the two companies positioned?
This section dissects Comcast and Charter’s operational DNA by comparing revenue distribution and internal strengths and weaknesses. The goal is to confront their economic moats and identify which model offers the most resilient competitive advantage today.
Revenue Segmentation: The Strategic Mix
This visual comparison dissects how Comcast Corporation and Charter Communications diversify their income streams and where their primary sector bets lie:
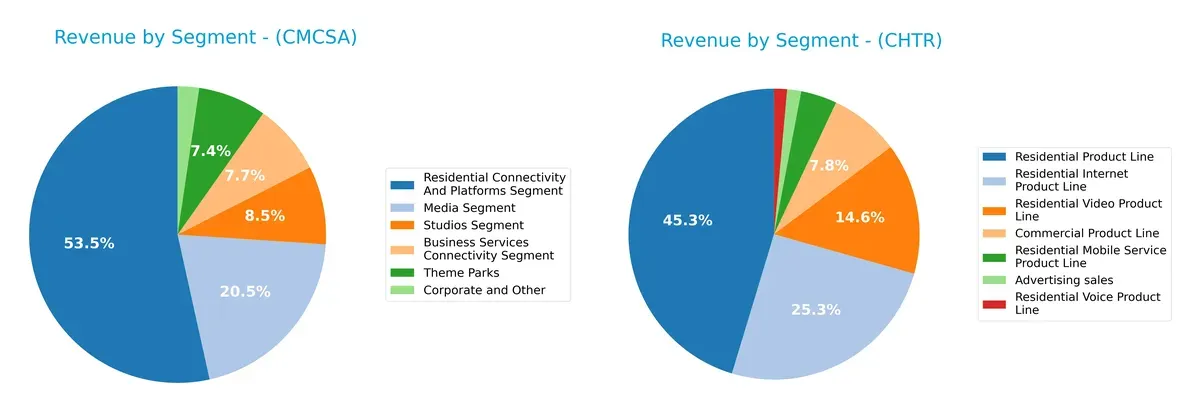
Comcast anchors its revenue in Residential Connectivity and Platforms at $70.7B, dwarfs other segments like Media at $27.1B, and Theme Parks at $9.8B. Charter pivots around its Residential Product Line at $42.6B, with a heavy focus on Residential Internet ($23.8B) and Video ($13.7B). Comcast’s broader segment spread signals ecosystem lock-in, while Charter’s concentration poses higher exposure to cable market shifts.
Strengths and Weaknesses Comparison
This table compares the Strengths and Weaknesses of Comcast Corporation and Charter Communications, Inc.:
Comcast Corporation Strengths
- Strong global presence with $95B US and $28B non-US revenue
- Favorable net margin at 16%
- Robust ROE at 20%
- Low debt-to-assets at 3%
- Dividend yield of 4.8%
- Diversified segments including media, studios, and theme parks
Charter Communications Strengths
- High ROE at 31%
- Favorable WACC at 4.8%
- Solid residential internet revenue of $23.8B
- Favorable PE ratio around 5.7
- Growing commercial product line revenue
- Focused residential product line generates $42.6B
Comcast Corporation Weaknesses
- Current ratio below 1 at 0.88 signals liquidity risk
- Neutral ROIC at 9.9% barely above WACC
- Asset turnover and fixed asset turnover only neutral
- PE and PB ratios low but aligned with sector norms
Charter Communications Weaknesses
- Very low current and quick ratios at 0.39 indicate liquidity stress
- High debt-to-equity at 6.05 and debt-to-assets at 63% raise solvency concerns
- Net margin weaker at 9.1%
- No dividend yield
- Asset turnover weak at 0.36
- PB ratio at 1.76 is neutral
Comcast demonstrates a more balanced financial profile with strong cash flow and diversified revenue streams, supporting strategic resilience. Charter excels in profitability metrics but faces liquidity and leverage risks that may constrain flexibility in adverse market cycles.
The Moat Duel: Analyzing Competitive Defensibility
A structural moat is the only defense long-term profits have against relentless competition erosion. Let’s examine how Comcast and Charter stack up:
Comcast Corporation: Diversified Media and Technology Moat
Comcast’s moat centers on its diversified media ecosystem and strong brand, reflected in a robust 24% EBIT margin and growing ROIC. Expansion into streaming and international markets in 2026 could fortify this edge.
Charter Communications, Inc.: Broadband Scale and Network Efficiency
Charter leverages scale and cost advantages in broadband, with a solid 23% EBIT margin but a thinner margin than Comcast. Its growing ROIC signals value creation, yet limited geographic diversification may constrain future moat expansion.
Ecosystem Depth vs. Scale Efficiency: Who Defends Better?
Comcast wields a wider moat through its diversified media assets and international presence, outpacing Charter’s narrower broadband scale. I see Comcast better positioned to protect and grow market share amid evolving industry dynamics.
Which stock offers better returns?
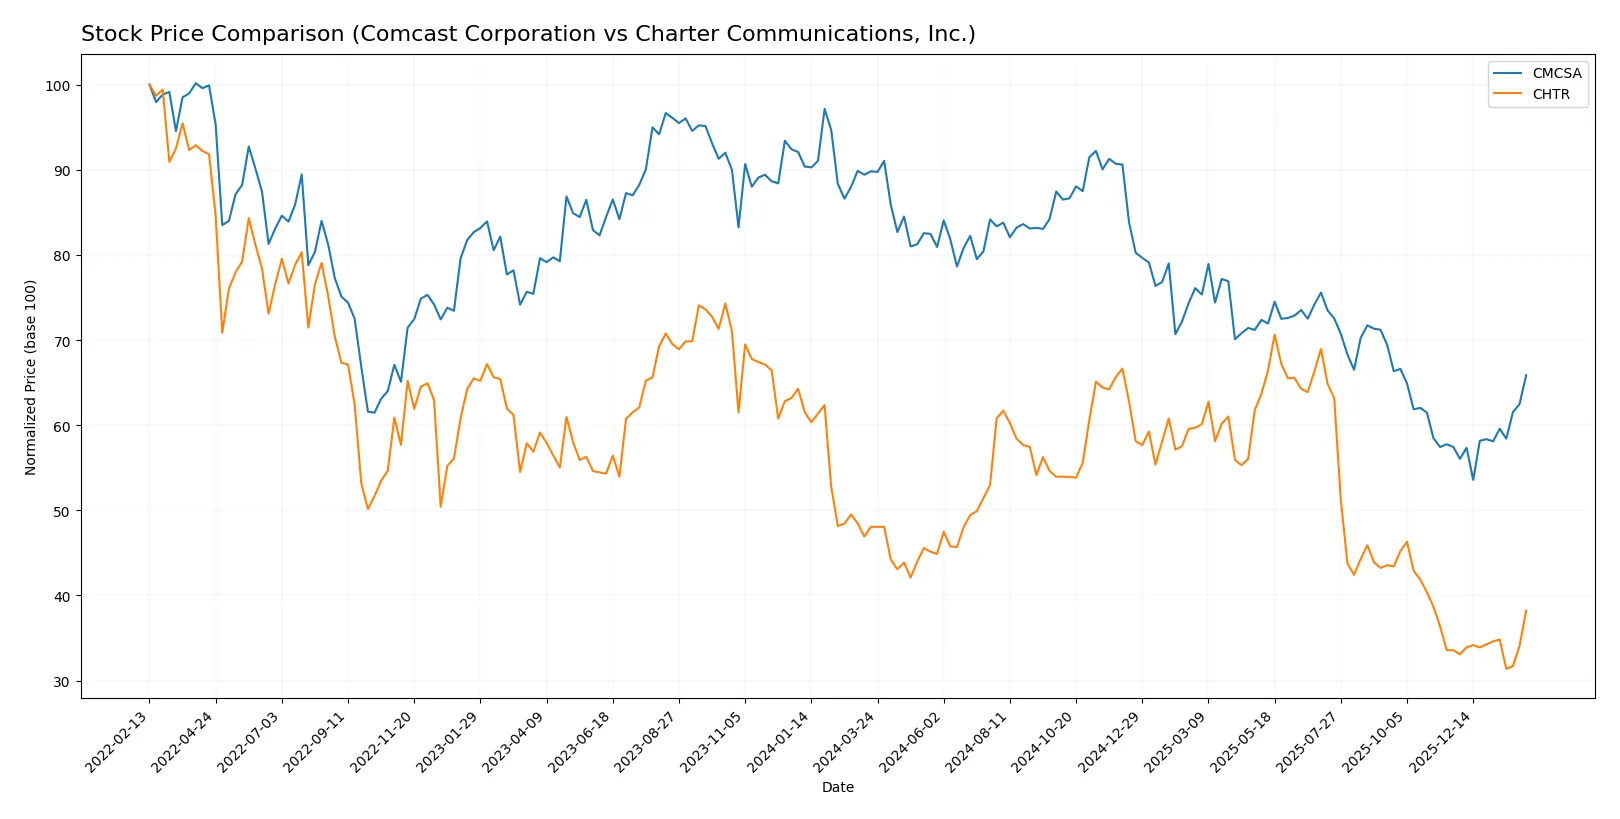
Over the past year, both Comcast Corporation and Charter Communications, Inc. exhibited significant price declines followed by recent positive momentum, reflecting volatile trading dynamics and accelerating trends.
Trend Comparison
Comcast’s stock declined sharply by 26.65% over the past 12 months, marking a bearish trend with accelerating downward momentum. The price ranged from $25.51 to $43.91, and recent months show a 14.7% rebound.
Charter’s stock also posted a bearish trend with a 20.47% decline over the same period. Volatility was high with a 63.61 standard deviation, and recent gains reached 13.86%, indicating accelerating recovery.
Comcast experienced a larger overall loss but slightly stronger recent gains. Charter showed less decline but greater volatility. Comcast delivered the weaker long-term performance.
Target Prices
Analysts present a broad target price range for Comcast Corporation and Charter Communications, reflecting diverse growth expectations.
| Company | Target Low | Target High | Consensus |
|---|---|---|---|
| Comcast Corporation | 23 | 40 | 32.71 |
| Charter Communications, Inc. | 160 | 500 | 307.67 |
The consensus target for Comcast modestly exceeds its current price of 31.37, indicating moderate upside. Charter’s consensus target is well above its current 231.14 price, suggesting strong anticipated growth from analysts.

Don’t Let Luck Decide Your Entry Point
Optimize your entry points with our advanced ProRealTime indicators. You’ll get efficient buy signals with precise price targets for maximum performance. Start outperforming now!
How do institutions grade them?
Comcast Corporation Grades
The following table summarizes recent institutional grades for Comcast Corporation:
| Grading Company | Action | New Grade | Date |
|---|---|---|---|
| Rosenblatt | Maintain | Neutral | 2026-01-30 |
| TD Cowen | Maintain | Buy | 2026-01-30 |
| Citigroup | Maintain | Buy | 2026-01-30 |
| Scotiabank | Maintain | Sector Perform | 2026-01-30 |
| Bernstein | Maintain | Market Perform | 2026-01-16 |
| Barclays | Maintain | Equal Weight | 2026-01-13 |
| B of A Securities | Upgrade | Buy | 2026-01-12 |
| Benchmark | Maintain | Buy | 2026-01-06 |
| Morgan Stanley | Maintain | Equal Weight | 2025-12-10 |
| Rosenblatt | Maintain | Neutral | 2025-12-01 |
Charter Communications, Inc. Grades
The following table summarizes recent institutional grades for Charter Communications, Inc.:
| Grading Company | Action | New Grade | Date |
|---|---|---|---|
| Deutsche Bank | Maintain | Hold | 2026-02-03 |
| Goldman Sachs | Maintain | Sell | 2026-02-02 |
| Benchmark | Maintain | Buy | 2026-02-02 |
| Wells Fargo | Maintain | Underweight | 2026-02-02 |
| Bernstein | Maintain | Market Perform | 2026-01-16 |
| Wells Fargo | Downgrade | Underweight | 2026-01-13 |
| UBS | Maintain | Neutral | 2025-12-22 |
| Wells Fargo | Maintain | Equal Weight | 2025-11-03 |
| RBC Capital | Maintain | Sector Perform | 2025-11-03 |
| Benchmark | Maintain | Buy | 2025-11-03 |
Which company has the best grades?
Comcast Corporation holds generally more favorable grades, including multiple Buy ratings and an upgrade. Charter Communications shows mixed sentiment with some Sell and Underweight ratings. This divergence may influence investor confidence and portfolio positioning.
Risks specific to each company
The following categories identify the critical pressure points and systemic threats facing both firms in the 2026 market environment:
1. Market & Competition
Comcast Corporation
- Diversified media and technology segments support resilience against competition.
Charter Communications, Inc.
- Focused on broadband and cable, facing intense competition in high-speed internet.
2. Capital Structure & Debt
Comcast Corporation
- Low debt-to-equity ratio (0.06) signals strong balance sheet and financial stability.
Charter Communications, Inc.
- High leverage with debt-to-equity ratio of 6.05 raises financial risk concerns.
3. Stock Volatility
Comcast Corporation
- Beta of 0.79 indicates lower volatility than the market, appealing to conservative investors.
Charter Communications, Inc.
- Beta above 1.0 (1.05) shows higher stock volatility, increasing investment risk.
4. Regulatory & Legal
Comcast Corporation
- Exposure to media ownership regulations and content distribution rules.
Charter Communications, Inc.
- Broadband service regulations and net neutrality considerations could impact operations.
5. Supply Chain & Operations
Comcast Corporation
- Large-scale operations with diversified supply chains reduce concentrated operational risks.
Charter Communications, Inc.
- Operations heavily reliant on network infrastructure which is capital intensive and vulnerable.
6. ESG & Climate Transition
Comcast Corporation
- Increasing focus on sustainable practices in media and theme park operations.
Charter Communications, Inc.
- ESG efforts challenged by high energy usage in network infrastructure and data centers.
7. Geopolitical Exposure
Comcast Corporation
- International operations, including in Europe and Asia, face geopolitical uncertainties.
Charter Communications, Inc.
- Primarily US-focused, limiting direct geopolitical risks but sensitive to domestic policy shifts.
Which company shows a better risk-adjusted profile?
Comcast’s strongest risk is regulatory complexity across diverse business segments, while Charter’s biggest risk lies in its high debt load. Comcast’s lower leverage, stable stock volatility, and favorable financial ratios result in a superior risk-adjusted profile. Recent data confirm Comcast’s robust balance sheet versus Charter’s distress zone Altman Z-score, underscoring my cautious stance on Charter’s financial risk.
Final Verdict: Which stock to choose?
Comcast Corporation (CMCSA) excels as a cash-generating powerhouse with a sustainable competitive advantage backed by a rising ROIC well above its cost of capital. Its slight liquidity constraint is a point of vigilance, but its robust free cash flow and attractive dividend yield fit well in an Aggressive Growth portfolio focused on value creation and income.
Charter Communications, Inc. (CHTR) offers a strategic moat through its strong return on equity and steady cash flow profile despite higher leverage and weaker liquidity ratios. Relative to Comcast, it carries more financial risk but could appeal to investors seeking Growth at a Reasonable Price (GARP) exposure with a focus on operational efficiency and equity returns.
If you prioritize a combination of value creation and income stability, Comcast outshines with its efficient capital allocation and safer balance sheet. However, if you seek higher equity returns and are comfortable with elevated leverage, Charter offers superior upside potential despite its riskier profile. Both present viable scenarios depending on your risk tolerance and investment horizon.
Disclaimer: Investment carries a risk of loss of initial capital. The past performance is not a reliable indicator of future results. Be sure to understand risks before making an investment decision.
Go Further
I encourage you to read the complete analyses of Comcast Corporation and Charter Communications, Inc. to enhance your investment decisions: