Home > Comparison > Industrials > PCAR vs CMCO
The strategic rivalry between PACCAR Inc and Columbus McKinnon Corporation shapes the industrial machinery sector’s dynamics. PACCAR operates as a capital-intensive manufacturer of commercial trucks, while Columbus McKinnon specializes in high-margin intelligent motion solutions and material handling equipment. This analysis pits PACCAR’s broad industrial scale against Columbus McKinnon’s niche innovation to determine which offers a superior risk-adjusted return for diversified portfolios navigating the evolving industrial landscape.
Table of contents
Companies Overview
PACCAR Inc and Columbus McKinnon Corporation both hold significant positions in the industrial machinery sector. Their specialized products target distinct but complementary markets within material handling and transportation.
PACCAR Inc: Global Commercial Truck Leader
PACCAR Inc dominates the heavy-duty truck market with its Kenworth, Peterbilt, and DAF brands. Its revenue primarily stems from truck manufacturing, parts distribution, and financial services including leasing and loans. In 2026, PACCAR’s strategic focus remains on expanding its global footprint and enhancing its financial solutions to support commercial trucking customers.
Columbus McKinnon Corporation: Intelligent Motion Solutions Specialist
Columbus McKinnon excels in providing advanced material handling and lifting equipment like hoists, cranes, and rigging gear. Its core revenue derives from selling these solutions to diverse industries such as energy, industrial automation, and supply chain. The company’s 2026 strategy emphasizes innovation in motion control systems and expanding integration services for industrial customers.
Strategic Collision: Similarities & Divergences
PACCAR and Columbus McKinnon both serve industrial markets but pursue distinct philosophies. PACCAR invests in a closed ecosystem of trucks and financial services, while Columbus McKinnon builds an open infrastructure of modular motion solutions. They primarily compete for capital expenditure budgets in logistics and manufacturing sectors. This divergence creates contrasting investment profiles: PACCAR offers scale and financial depth, Columbus McKinnon delivers niche innovation and industrial versatility.
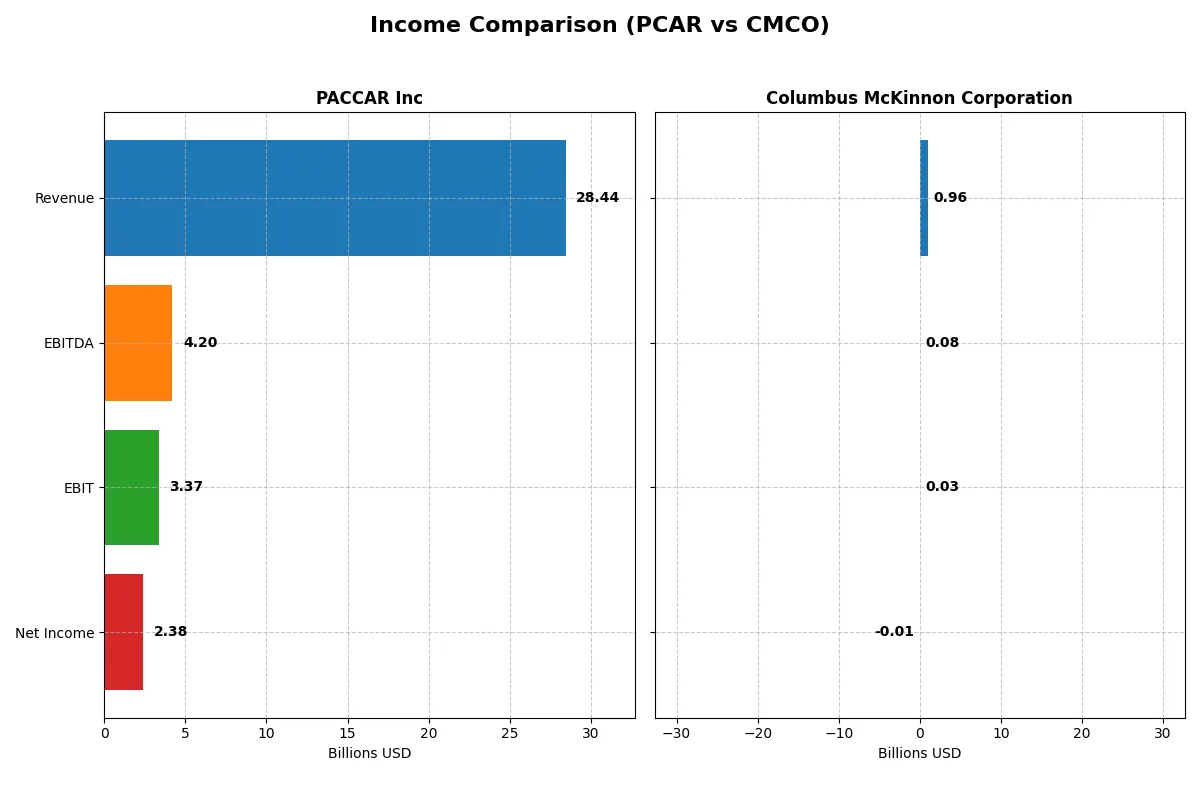
Income Statement Comparison
This data dissects the core profitability and scalability of both corporate engines to reveal who dominates the bottom line:
| Metric | PACCAR Inc (PCAR) | Columbus McKinnon Corporation (CMCO) |
|---|---|---|
| Revenue | 28.4B | 963M |
| Cost of Revenue | 23.8B | 637M |
| Operating Expenses | 1.66B | 271M |
| Gross Profit | 4.62B | 326M |
| EBITDA | 4.20B | 75.1M |
| EBIT | 3.37B | 27.0M |
| Interest Expense | 347M | 32.4M |
| Net Income | 2.38B | -5.14M |
| EPS | 4.52 | -0.18 |
| Fiscal Year | 2025 | 2024 |
Income Statement Analysis: The Bottom-Line Duel
The following income statement comparison reveals which company runs a more efficient and profitable corporate engine over recent years.
PACCAR Inc Analysis
PACCAR’s revenue grew 21% from 2021 to 2025 but fell 15.5% in the latest year to $28.4B. Net income followed a similar pattern, peaking in 2023 at $4.6B before dropping 43% to $2.4B in 2025. Gross margin held steady near 16%, while net margin remains strong at 8.4%, signaling solid profitability despite recent headwinds.
Columbus McKinnon Corporation Analysis
Columbus McKinnon expanded revenue 48% over 2020-2024, reaching $963M in 2024, but declined nearly 5% year-over-year. The firm swung from $47M net income in 2023 to a loss of $5.1M in 2024, dragging net margin into negative territory at -0.5%. Although gross margin stays robust above 33%, profitability eroded sharply, reflecting operational challenges.
Margin Strength vs. Earnings Stability
PACCAR delivers higher absolute scale and more consistent profitability, with favorable EBIT and net margins despite recent revenue softness. Columbus McKinnon shows better gross margin but suffers from volatile earnings and a recent net loss. Investors seeking stable earnings and margin resilience would likely favor PACCAR’s profile over Columbus McKinnon’s uneven results.
Financial Ratios Comparison
These vital ratios act as a diagnostic tool to expose the underlying fiscal health, valuation premiums, and capital efficiency of the companies compared here:
| Ratios | PACCAR Inc (PCAR) | Columbus McKinnon Corp (CMCO) |
|---|---|---|
| ROE | 12.33% | -0.58% |
| ROIC | 6.39% | 3.30% |
| P/E | 24.25 | -94.69 |
| P/B | 2.99 | 0.55 |
| Current Ratio | 1.70 | 1.81 |
| Quick Ratio | 1.42 | 1.04 |
| D/E | 0 | 0.61 |
| Debt-to-Assets | 0 | 31.09% |
| Interest Coverage | 8.55 | 1.68 |
| Asset Turnover | 0.64 | 0.55 |
| Fixed Asset Turnover | 6.31 | 9.07 |
| Payout ratio | 95.42% | -156.52% |
| Dividend yield | 3.94% | 1.65% |
| Fiscal Year | 2025 | 2024 |
Efficiency & Valuation Duel: The Vital Signs
Ratios serve as a company’s DNA, exposing hidden risks and showcasing operational strength beneath surface numbers.
PACCAR Inc
PACCAR displays neutral profitability with ROE at 12.33% and net margin at 8.35%. Its valuation is fairly priced, with a P/E of 24.25 and P/B near 3. The firm distributes a healthy 3.94% dividend yield, signaling steady shareholder returns alongside a solid capital structure and low leverage.
Columbus McKinnon Corporation
Columbus McKinnon struggles with negative net margin (-0.53%) and ROE (-0.58%), reflecting operational challenges. Despite a favorable low P/B of 0.55 and an unusual negative P/E, the company’s high debt and weak interest coverage raise concerns. Dividend yield remains modest at 1.65%, with reinvestment likely aimed at stabilizing growth.
Balanced Operational Strength vs. Stretched Profitability
PACCAR offers a more balanced risk-reward profile, combining moderate profitability and reasonable valuation with strong shareholder returns. Columbus McKinnon’s valuation appears cheap, but operational weaknesses and financial strain suggest higher risk. Investors seeking stability may lean toward PACCAR’s consistent metrics.
Which one offers the Superior Shareholder Reward?
I compare PACCAR Inc (PCAR) and Columbus McKinnon Corporation (CMCO) on dividend yield, payout ratios, and buyback intensity. PCAR yields 3.9% with a high payout ratio near 95%, supported by strong free cash flow coverage above 1.2X. Its buyback program is substantial, enhancing total return sustainability. CMCO offers a lower 1.65% yield with a negative payout ratio, indicating irregular dividend payments and weaker profitability. CMCO’s buybacks are modest relative to free cash flow. I see PCAR’s distribution model as more sustainable, backed by robust cash flow and disciplined capital allocation. Thus, PCAR offers a superior total shareholder return profile in 2026.
Comparative Score Analysis: The Strategic Profile
The radar chart reveals the fundamental DNA and trade-offs of PACCAR Inc and Columbus McKinnon Corporation:
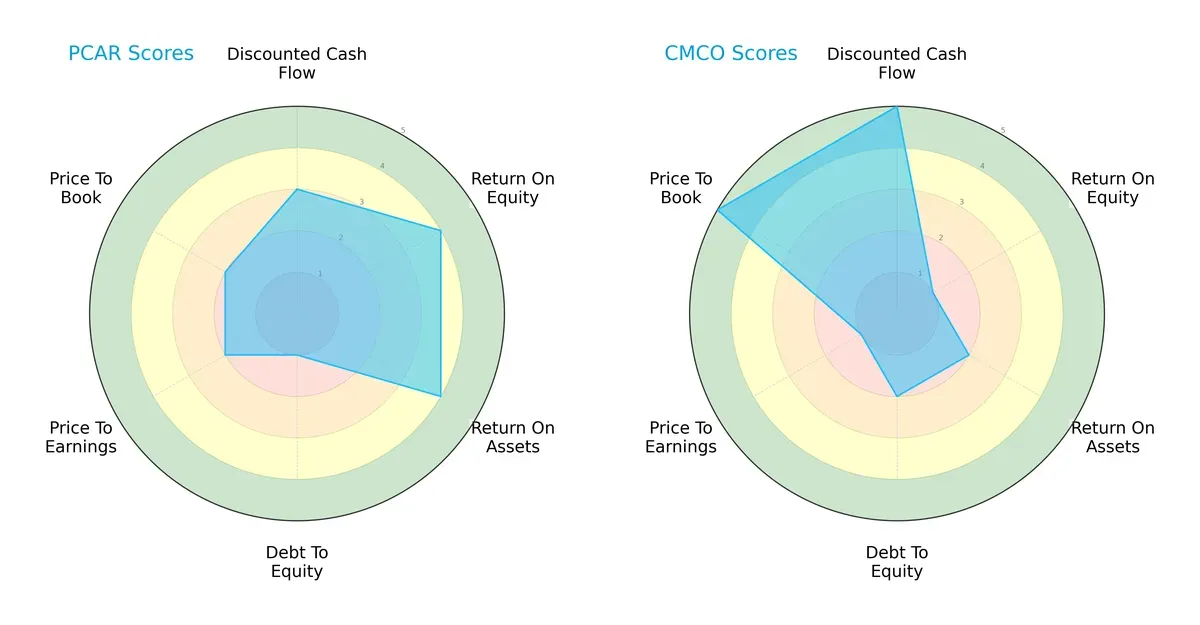
PACCAR shows strength in ROE (4) and ROA (4), signaling operational efficiency. Columbus McKinnon excels in discounted cash flow (5) and price-to-book (5), indicating strong valuation appeal. However, PACCAR’s debt-to-equity (1) is a red flag, while Columbus McKinnon’s ROE (1) and P/E (1) scores reveal weaknesses. PACCAR’s profile is more balanced; Columbus McKinnon relies heavily on valuation advantages.
Bankruptcy Risk: Solvency Showdown
PACCAR’s Altman Z-Score of 2.53 contrasts with Columbus McKinnon’s 1.49, highlighting a meaningful solvency gap:
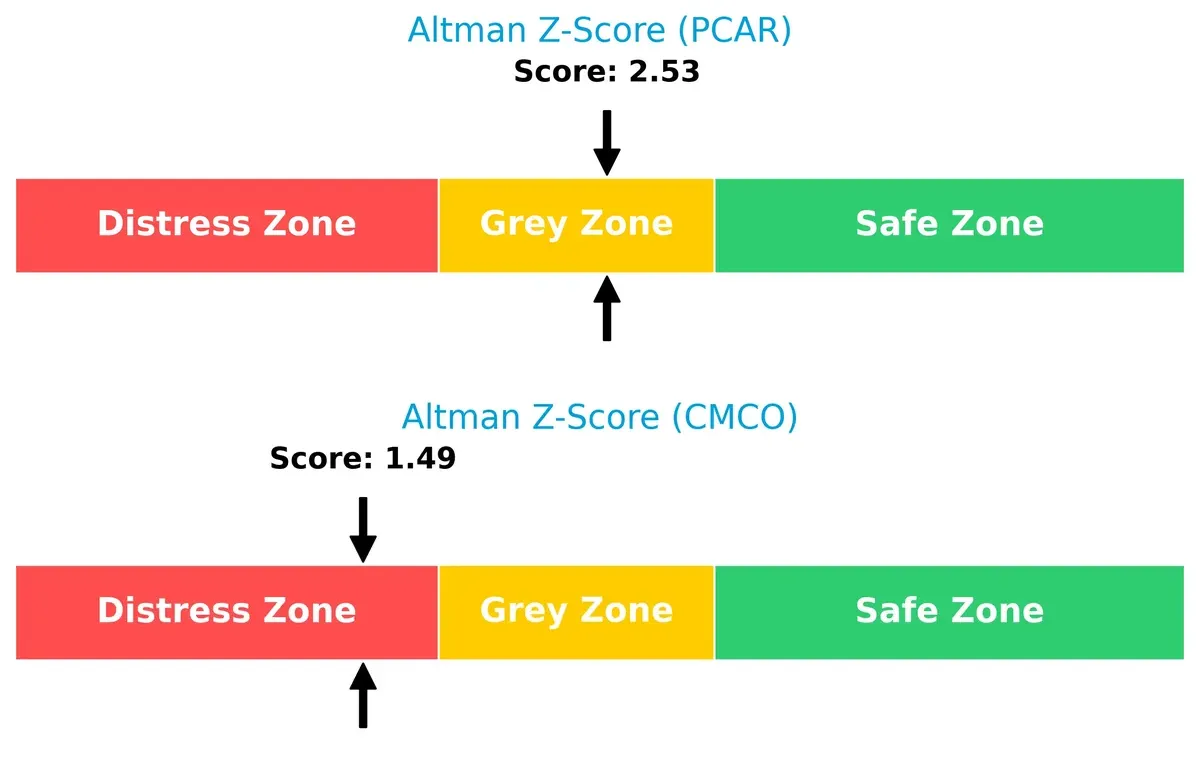
PACCAR sits in the grey zone, signaling moderate bankruptcy risk but better resilience. Columbus McKinnon falls into the distress zone, indicating elevated long-term survival concerns in this cycle.
Financial Health: Quality of Operations
Columbus McKinnon’s Piotroski F-Score of 8 outperforms PACCAR’s 5, signaling stronger internal financial health:

Columbus McKinnon demonstrates robust profitability, leverage, and liquidity metrics. PACCAR’s average score suggests some operational weaknesses and potential red flags compared to its peer.
How are the two companies positioned?
This section dissects PCAR and CMCO’s operational DNA by comparing revenue distribution and internal dynamics. The goal is to confront their economic moats and reveal which model offers the most resilient, sustainable competitive advantage today.
Revenue Segmentation: The Strategic Mix
This visual comparison dissects how PACCAR Inc and Columbus McKinnon Corporation diversify their income streams and where their primary sector bets lie:
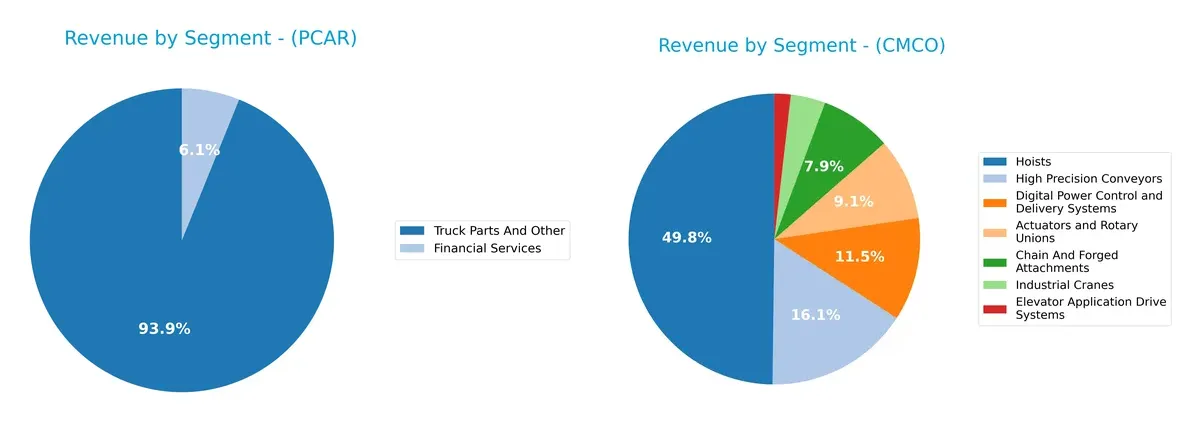
PACCAR anchors its revenue with $32B from Truck Parts and Other, dwarfing its $2.1B Financial Services segment. This signals a concentrated reliance on core manufacturing and parts. Conversely, Columbus McKinnon spreads revenue across Hoists ($480M), High Precision Conveyors ($155M), and Digital Power Control ($110M), showing a more diversified portfolio. PACCAR’s focus suggests infrastructure dominance but raises concentration risk. CMCO’s mix signals resilience via multiple industrial niches, reducing dependency on any single market.
Strengths and Weaknesses Comparison
This table compares the strengths and weaknesses of PACCAR Inc and Columbus McKinnon Corporation:
PACCAR Inc Strengths
- Diverse revenue segments with strong Truck Parts and Financial Services
- Favorable liquidity ratios including current ratio at 1.7
- Zero debt and strong interest coverage at 9.73
- Solid fixed asset turnover at 6.31
- Global sales presence across US, Europe, and Other Countries
Columbus McKinnon Corporation Strengths
- Broad product diversification across hoists, conveyors, and cranes
- Favorable cost of capital with WACC at 7.49%
- Attractive price-to-book ratio at 0.55
- Current ratio favorable at 1.81
- Strong fixed asset turnover at 9.07
- Presence in multiple regions including US, Europe, and Asia Pacific
PACCAR Inc Weaknesses
- Neutral profitability metrics with ROIC below WACC at 6.39% vs 8.62%
- Moderate net margin and ROE around 8.35% and 12.33% respectively
- Asset turnover relatively low at 0.64
- Price-to-earnings ratio is high at 24.25, implying valuation risks
Columbus McKinnon Corporation Weaknesses
- Negative net margin and ROE, reflecting operating losses
- ROIC at 3.3% below WACC of 7.49% signals value destruction
- High debt-to-equity ratio at 0.61 and weak interest coverage at 0.83
- Dividend yield low at 1.65% and declining profitability
PACCAR’s strengths lie in its conservative balance sheet and diversified global revenue, though profitability is moderate. Columbus McKinnon shows product and geographic diversity but faces profitability challenges and leverage risks, which could impact strategic flexibility.
The Moat Duel: Analyzing Competitive Defensibility
A structural moat is the only reliable shield protecting long-term profits from relentless competition erosion. Let’s dissect the competitive moats of two industrial players:
PACCAR Inc: Brand Reputation & Dealer Network Moat
PACCAR’s moat stems from its strong dealer network and brand reputation in heavy trucks. It maintains stable margins but faces a declining ROIC trending downward in 2026. Expansion in financial services could help, yet value destruction warns caution.
Columbus McKinnon Corporation: Niche Product Specialization Moat
Columbus McKinnon relies on specialized motion control products, contrasting PACCAR’s broad truck market reach. Despite a high gross margin, its ROIC falls sharply, reflecting weak capital efficiency. Growth hinges on innovation in automation and safety solutions.
The Moat Battle: Brand Network vs. Product Niche
Both firms suffer declining ROICs below WACC, indicating value destruction. PACCAR’s broader ecosystem offers a wider moat, but Columbus McKinnon’s niche focus provides depth. PACCAR, however, remains better positioned to defend its market share amid evolving industry pressures.
Which stock offers better returns?
Over the past year, PACCAR Inc has shown a steady price increase with accelerating bullish momentum, while Columbus McKinnon Corporation experienced a significant overall decline despite recent recovery signs.
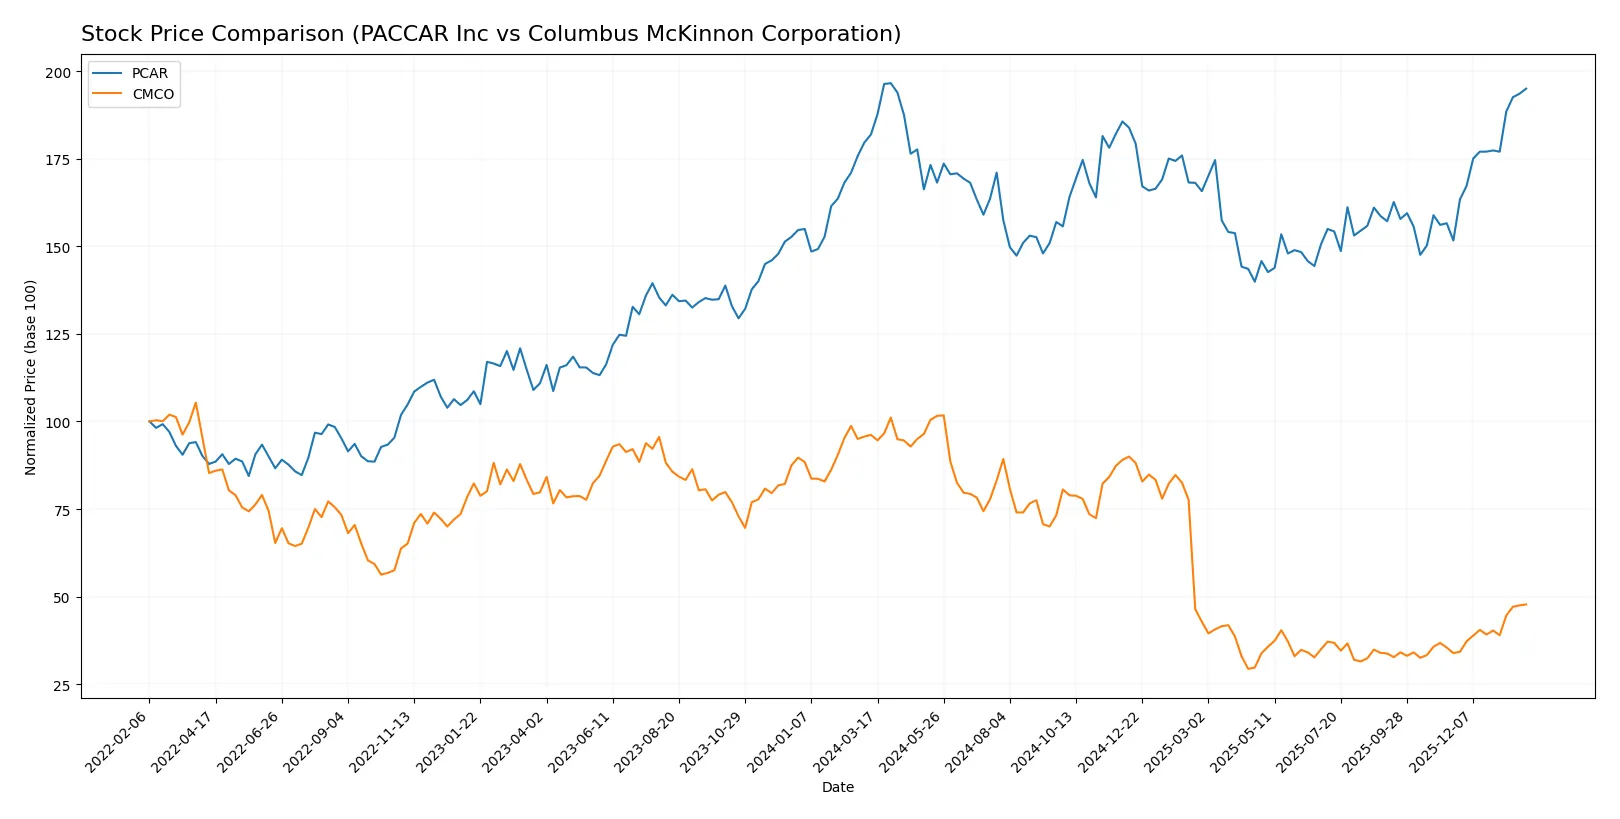
Trend Comparison
PACCAR Inc’s stock rose 7.2% over the past 12 months, reflecting a bullish trend with accelerating gains and a high of 123.89. Volatility remains moderate with an 8.83 std deviation.
Columbus McKinnon Corporation’s shares fell 50.33% in 12 months, marking a bearish trend with accelerating losses. The stock hit a low of 12.96 but showed a recent 41% rebound.
PACCAR Inc outperformed Columbus McKinnon significantly, delivering the highest market returns despite the latter’s recent partial recovery.
Target Prices
Analysts present a moderate target consensus for PACCAR Inc and Columbus McKinnon Corporation.
| Company | Target Low | Target High | Consensus |
|---|---|---|---|
| PACCAR Inc | 86 | 138 | 106 |
| Columbus McKinnon Corporation | 15 | 15 | 15 |
PACCAR’s target consensus at 106 sits below its current price of 122.91, signaling cautious optimism. Columbus McKinnon’s fixed target at 15 is well below its current 21.08, indicating significant downside risk.

Don’t Let Luck Decide Your Entry Point
Optimize your entry points with our advanced ProRealTime indicators. You’ll get efficient buy signals with precise price targets for maximum performance. Start outperforming now!
How do institutions grade them?
PACCAR Inc Grades
The following table summarizes recent institutional grades for PACCAR Inc:
| Grading Company | Action | New Grade | Date |
|---|---|---|---|
| Citigroup | Maintain | Neutral | 2026-01-29 |
| Truist Securities | Maintain | Hold | 2026-01-28 |
| Wells Fargo | Maintain | Equal Weight | 2026-01-23 |
| JP Morgan | Maintain | Overweight | 2026-01-14 |
Columbus McKinnon Corporation Grades
The following table summarizes institutional grades for Columbus McKinnon Corporation:
| Grading Company | Action | New Grade | Date |
|---|---|---|---|
| DA Davidson | Downgrade | Neutral | 2025-02-11 |
| DA Davidson | Maintain | Buy | 2024-02-05 |
| Barrington Research | Maintain | Outperform | 2022-07-29 |
| JP Morgan | Downgrade | Neutral | 2022-05-26 |
Which company has the best grades?
PACCAR Inc consistently receives mostly neutral to overweight ratings from top firms, reflecting moderate confidence. Columbus McKinnon shows mixed grades with earlier outperform ratings but recent downgrades to neutral. Investors might view PACCAR’s steadier institutional sentiment as less volatile.
Risks specific to each company
The following categories identify critical pressure points and systemic threats facing PACCAR Inc and Columbus McKinnon Corporation in the 2026 market environment:
1. Market & Competition
PACCAR Inc
- Strong global truck manufacturing presence with established Kenworth, Peterbilt brands. Faces heavy industry competition and cyclical demand.
Columbus McKinnon Corporation
- Operates in niche motion solutions with broad verticals but limited scale. Faces pressure from automation and industrial tech rivals.
2. Capital Structure & Debt
PACCAR Inc
- Virtually no debt; exceptional interest coverage at 9.73x strengthens financial flexibility.
Columbus McKinnon Corporation
- Moderate debt with D/E at 0.61; weak interest coverage at 0.83x raises refinancing and liquidity risks.
3. Stock Volatility
PACCAR Inc
- Beta near 1.02 indicates stock moves roughly with market; moderate volatility.
Columbus McKinnon Corporation
- Higher beta at 1.29 signals greater sensitivity to market swings and investor risk.
4. Regulatory & Legal
PACCAR Inc
- Complies with stringent emissions and safety standards globally; regulatory shifts could increase costs.
Columbus McKinnon Corporation
- Faces regulatory scrutiny in industrial safety and environmental compliance; smaller scale limits buffer against fines.
5. Supply Chain & Operations
PACCAR Inc
- Complex global supply chain vulnerable to geopolitical disruptions but benefits from scale and vertical integration.
Columbus McKinnon Corporation
- Supply chain more concentrated; risk from component shortages and operational bottlenecks remains elevated.
6. ESG & Climate Transition
PACCAR Inc
- Invests in cleaner truck technologies; transition risks mitigated by innovation and regulatory alignment.
Columbus McKinnon Corporation
- ESG initiatives growing but limited resources constrain rapid climate transition adaptation.
7. Geopolitical Exposure
PACCAR Inc
- Significant international exposure, including Europe and emerging markets, subject to trade tensions.
Columbus McKinnon Corporation
- Primarily North American operations reduce global geopolitical risk but limit market diversification.
Which company shows a better risk-adjusted profile?
PACCAR’s dominant market position and pristine capital structure buffer it against market and operational shocks. Columbus McKinnon’s high leverage and weak interest coverage raise red flags, despite a strong Piotroski score reflecting operational resilience. The most impactful risk for PACCAR lies in geopolitical exposure disrupting its complex supply chain. For Columbus McKinnon, liquidity risks from debt and interest coverage dominate. Given these factors, PACCAR exhibits a superior risk-adjusted profile in 2026. Its zero debt and robust dividend yield of 3.94% justify confidence amid market uncertainties.
Final Verdict: Which stock to choose?
PACCAR Inc’s superpower lies in its robust operational efficiency and strong balance sheet, making it a reliable cash generator. Its point of vigilance is the recent decline in revenue growth, signaling the need for careful monitoring. It suits portfolios geared toward steady, long-term income and moderate growth.
Columbus McKinnon Corporation benefits from a strategic moat built on its niche industrial product offerings and recurring revenue streams. Despite weaker profitability metrics, it presents a more conservative safety profile than PACCAR, fitting well within a value-oriented or GARP (Growth at a Reasonable Price) portfolio.
If you prioritize operational stability and consistent cash flow, PACCAR emerges as the compelling choice due to its solid balance sheet and income quality. However, if you seek value opportunities with potential upside in niche markets, Columbus McKinnon offers better stability amidst adversity and commands a more attractive valuation. Each scenario demands careful risk assessment aligned with your investment strategy.
Disclaimer: Investment carries a risk of loss of initial capital. The past performance is not a reliable indicator of future results. Be sure to understand risks before making an investment decision.
Go Further
I encourage you to read the complete analyses of PACCAR Inc and Columbus McKinnon Corporation to enhance your investment decisions: