Home > Comparison > Consumer Defensive > UL vs CL
The strategic rivalry between Unilever PLC and Colgate-Palmolive Company shapes the landscape of the consumer defensive sector. Unilever, a diversified fast-moving consumer goods giant, contrasts with Colgate-Palmolive’s focused leadership in oral, personal, and pet care products. This head-to-head pits broad-based growth against niche specialization. This analysis seeks to identify which company’s operational model presents a superior risk-adjusted return for a diversified portfolio in 2026.
Table of contents
Companies Overview
Unilever and Colgate-Palmolive dominate the global household and personal products market with distinct revenue engines and strategic visions.
Unilever PLC: Global Consumer Goods Powerhouse
Unilever operates as a fast-moving consumer goods giant, generating revenue across Beauty & Personal Care, Foods & Refreshment, and Home Care segments. Its diverse brand portfolio, including Dove and Ben & Jerry’s, drives steady cash flow. In 2026, Unilever focuses on expanding sustainable products and digital engagement to deepen consumer loyalty and capture emerging market share.
Colgate-Palmolive Company: Oral and Home Care Specialist
Colgate leads in oral, personal, and home care products, also growing its Pet Nutrition segment. Revenue primarily stems from toothpaste, soaps, and pet food sales under brands like Colgate and Hill’s Science Diet. Its 2026 strategy emphasizes innovation in oral health and eCommerce expansion to strengthen its position in traditional and digital retail channels.
Strategic Collision: Similarities & Divergences
Both prioritize household and personal products but diverge in scope—Unilever pursues broad FMCG diversification while Colgate specializes in oral care and pet nutrition. They battle primarily in personal care segments, competing for global consumer attention. Unilever offers a diversified, sustainable growth profile, whereas Colgate delivers focused innovation with strong niche expertise.
Income Statement Comparison
This data dissects the core profitability and scalability of both corporate engines to reveal who dominates the bottom line:
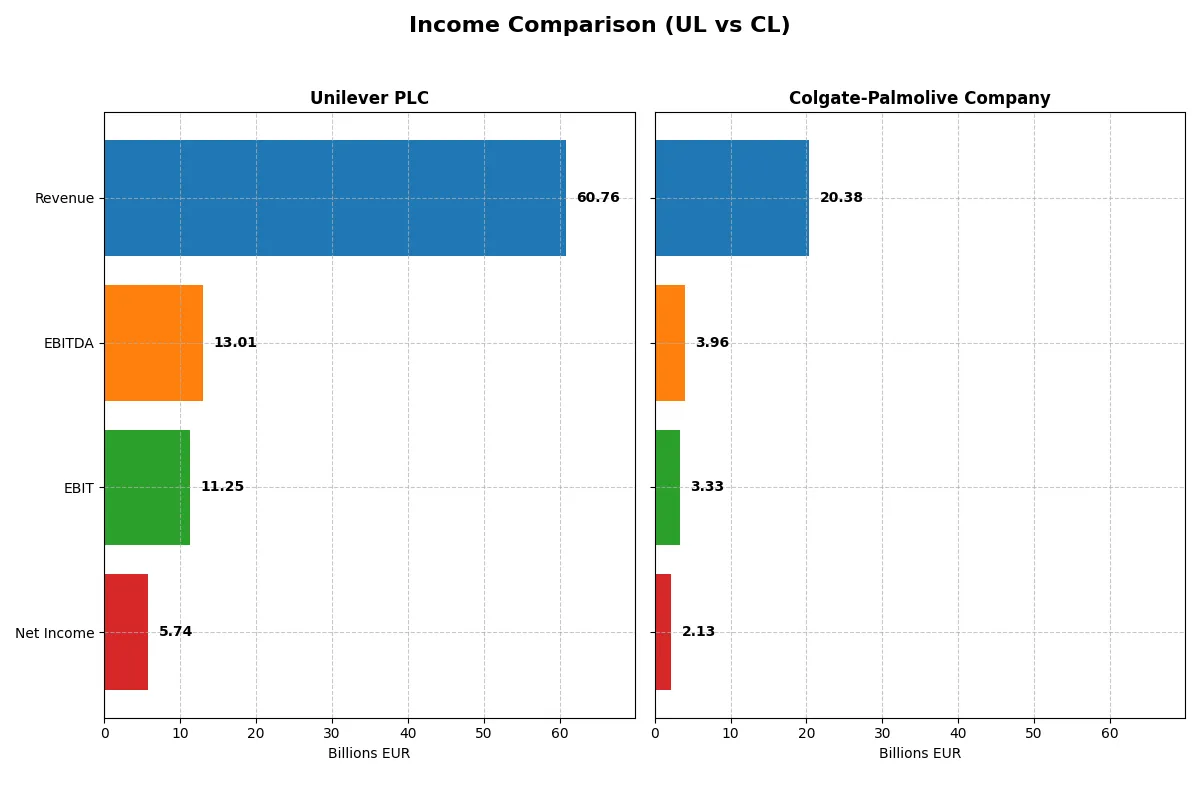
| Metric | Unilever PLC (UL) | Colgate-Palmolive Company (CL) |
|---|---|---|
| Revenue | 60.8B EUR | 20.1B USD |
| Cost of Revenue | 0 EUR | 7.99B USD |
| Operating Expenses | 51.4B EUR | 7.72B USD |
| Gross Profit | 60.8B EUR | 12.1B USD |
| EBITDA | 13.0B EUR | 4.85B USD |
| EBIT | 11.3B EUR | 4.25B USD |
| Interest Expense | 1.12B EUR | 292M USD |
| Net Income | 5.74B EUR | 2.89B USD |
| EPS | 2.30 EUR | 3.53 USD |
| Fiscal Year | 2024 | 2024 |
Income Statement Analysis: The Bottom-Line Duel
This income statement comparison reveals which company runs a more efficient and profitable business engine in recent years.
Unilever PLC Analysis
Unilever’s revenue climbed steadily from 50.7B EUR in 2020 to 60.8B EUR in 2024, showing consistent growth. Net income fluctuated, peaking at 7.6B EUR in 2022 before settling at 5.7B EUR in 2024. The company maintains a robust gross margin near 100%, reflecting exceptional cost control, while its net margin of 9.45% remains favorable despite slight recent contraction. Efficiency gains are visible in its improving EBIT margin, reaching 18.52% in 2024.
Colgate-Palmolive Company Analysis
Colgate-Palmolive’s revenue expanded from 17.4B USD in 2021 to 20.4B USD in 2025, showing moderate growth. Net income peaked at 3.0B USD in 2024 but dropped sharply to zero in 2025, signaling significant bottom-line pressure. Gross margin stands at a healthy 60.11%, with a net margin of 10.46% in 2025, slightly higher than Unilever’s latest figure. However, the notable decline in EBIT and net income margins over the last year highlights emerging operational challenges.
Margin Excellence vs. Earnings Stability
Unilever demonstrates stronger margin health and more stable net income over the medium term, with superior EBIT and net margins despite recent slight net income softness. Colgate-Palmolive delivers solid gross and net margins but faces a troubling drop to zero net income in 2025. For investors prioritizing consistent profitability and margin control, Unilever’s profile currently commands greater fundamental appeal.
Financial Ratios Comparison
These vital ratios act as a diagnostic tool to expose the underlying fiscal health, valuation premiums, and capital efficiency of the companies compared below:
| Ratios | Unilever PLC (UL) | Colgate-Palmolive Company (CL) |
|---|---|---|
| ROE | 28.7% | 13.6% |
| ROIC | 11.1% | 30.6% |
| P/E | 26.9 | 25.7 |
| P/B | 7.7 | 350.6 |
| Current Ratio | 0.76 | 0.92 |
| Quick Ratio | 0.56 | 0.58 |
| D/E | 1.53 | 40.15 |
| Debt-to-Assets | 38.4% | 53.0% |
| Interest Coverage | 8.4x | 15.0x |
| Asset Turnover | 0.76 | 1.25 |
| Fixed Asset Turnover | 5.21 | 4.55 |
| Payout ratio | 75.2% | 61.9% |
| Dividend yield | 2.79% | 2.41% |
| Fiscal Year | 2024 | 2024 |
Efficiency & Valuation Duel: The Vital Signs
Financial ratios serve as a company’s DNA, exposing hidden risks and operational strengths investors must understand thoroughly.
Unilever PLC
Unilever shows a robust 28.73% ROE and a solid 9.45% net margin, signaling efficient profitability. However, its P/E of 26.93 and P/B of 7.74 suggest the stock trades at a premium. A 2.79% dividend yield rewards shareholders, balancing valuation with steady income amid moderate operational risks.
Colgate-Palmolive Company
Colgate delivers exceptional profitability with a 1362.74% ROE and a strong 14.37% net margin, reflecting operational efficiency. Its valuation metrics, including a 25.73 P/E and an extremely high 350.65 P/B, indicate a stretched price. The 2.41% dividend yield complements its favorable capital returns despite elevated leverage concerns.
Premium Valuation vs. Operational Safety
Colgate offers superior profitability and operational efficiency but carries a stretched valuation and higher leverage risk. Unilever balances moderate premium valuation with stable dividends and solid returns. Investors seeking growth with caution may prefer Unilever’s profile; risk-tolerant investors might favor Colgate’s aggressive profitability.
Which one offers the Superior Shareholder Reward?
I compare Unilever PLC (UL) and Colgate-Palmolive Company (CL) on dividend yield, payout ratio, and buyback intensity. UL yields 2.79% with a 75% payout, supported by 82% FCF coverage, showing a balanced distribution. CL yields 2.41% with a 62% payout, backed by 86% FCF coverage, emphasizing buybacks with strong operating cash flow. CL’s higher margins and cash flow support a sustainable buyback and dividend mix, but UL’s steady payout and moderate leverage indicate safer distributions. For 2026 investors, I find CL’s aggressive buyback and solid free cash flow offer a superior total return potential despite higher leverage risks.
Comparative Score Analysis: The Strategic Profile
The radar chart reveals the fundamental DNA and trade-offs of Unilever PLC and Colgate-Palmolive Company, highlighting their financial strengths and vulnerabilities:
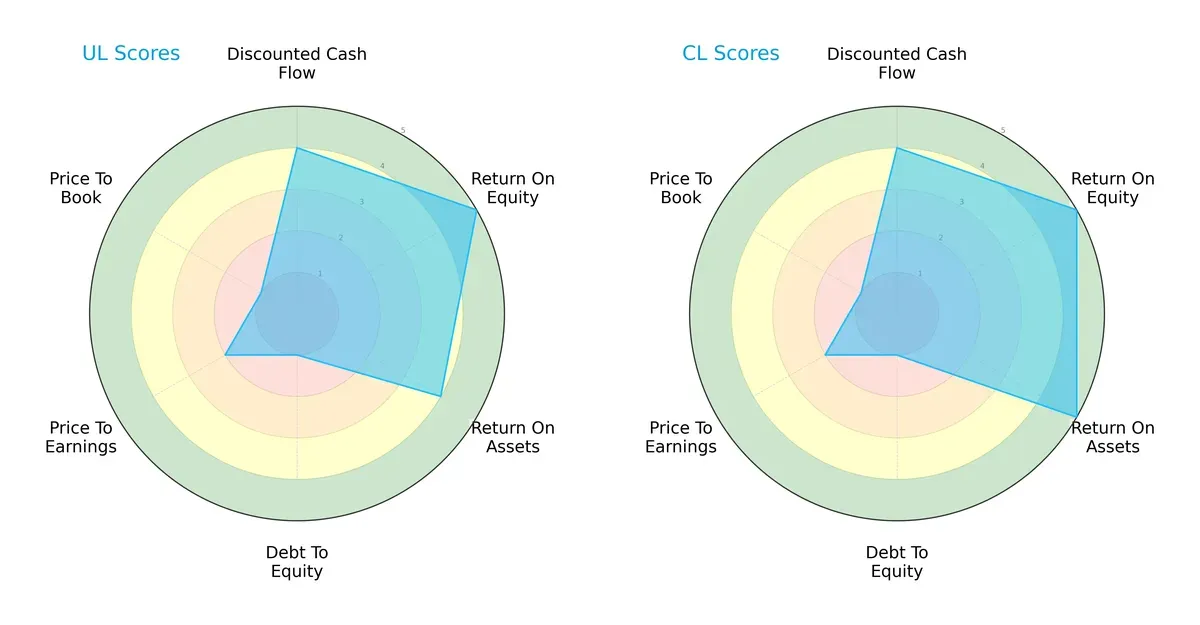
Both firms score equally on overall rating (3) and discounted cash flow (4), signaling comparable valuation outlooks. Unilever and Colgate-Palmolive share strong ROE scores (5), but Colgate edges ahead on ROA (5 vs. 4), reflecting superior asset efficiency. Both exhibit weak debt-to-equity (1) and price-to-book (1) scores, signaling balance sheet leverage and valuation concerns. Unilever’s profile is slightly less balanced, relying more on equity returns, while Colgate demonstrates a marginally better operational efficiency.
Bankruptcy Risk: Solvency Showdown
The Altman Z-Score delta indicates both companies reside comfortably in the safe zone, signaling robust long-term solvency in this cycle:
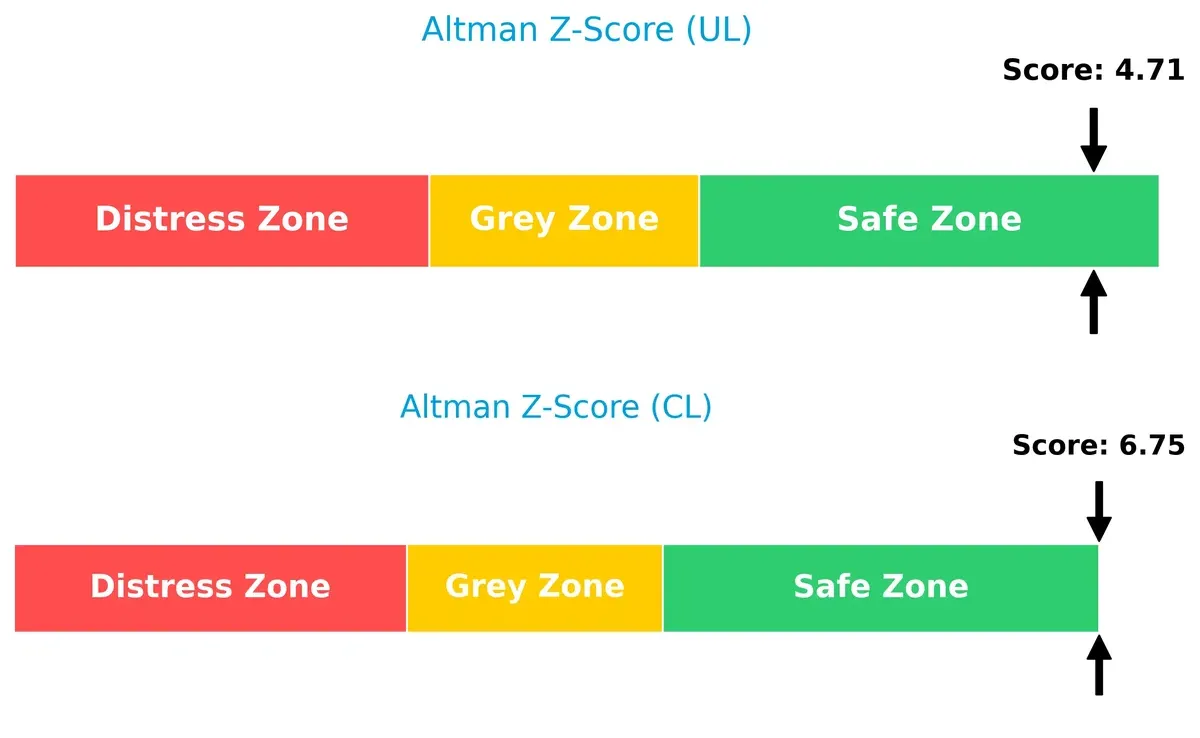
Colgate’s higher Z-Score (6.75) suggests a stronger buffer against financial distress compared to Unilever’s 4.71. Both remain well above distress thresholds, but Colgate’s superior score reflects a safer capital structure and liquidity position.
Financial Health: Quality of Operations
Unilever and Colgate share identical Piotroski F-Scores of 6, marking average financial health without glaring red flags:
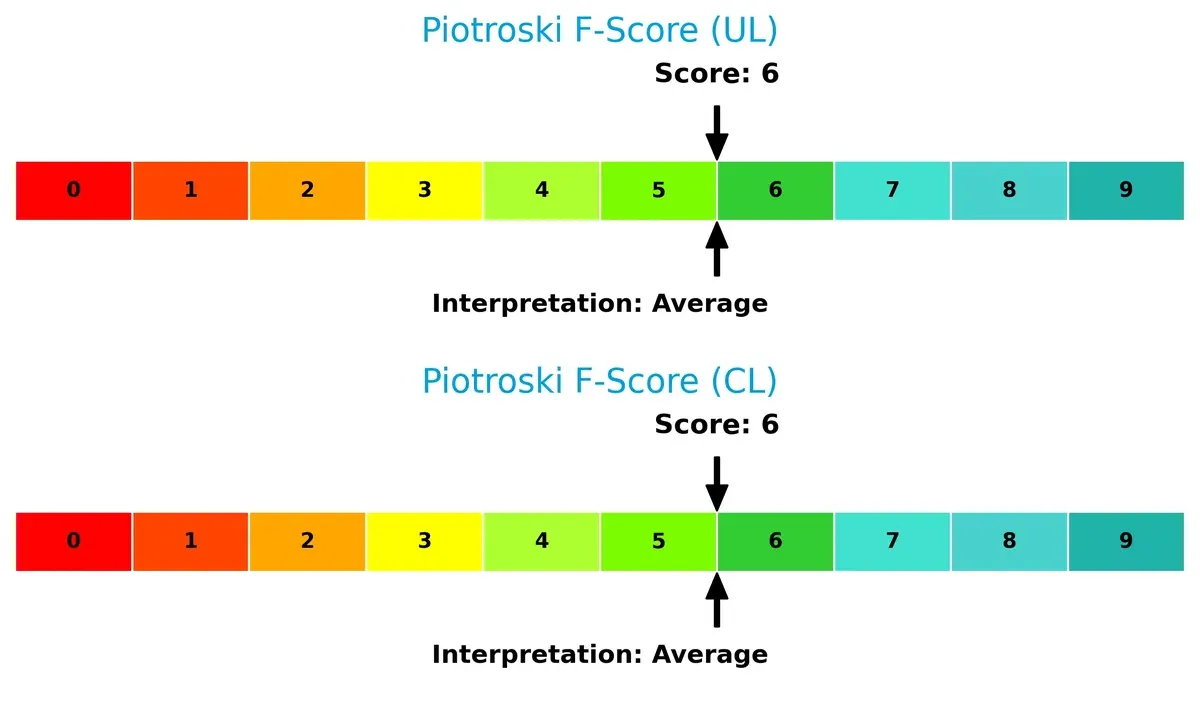
Neither firm demonstrates peak financial strength, but both maintain stable operational metrics. Investors should watch for improvements in profitability and liquidity to elevate these scores toward the strong category.
How are the two companies positioned?
This section dissects the operational DNA of Unilever and Colgate-Palmolive by comparing their revenue distribution and internal dynamics. The goal is to confront their economic moats and identify which model offers the most resilient competitive advantage today.
Revenue Segmentation: The Strategic Mix
This visual comparison dissects how Unilever PLC and Colgate-Palmolive Company diversify their income streams and highlights their primary sector bets:
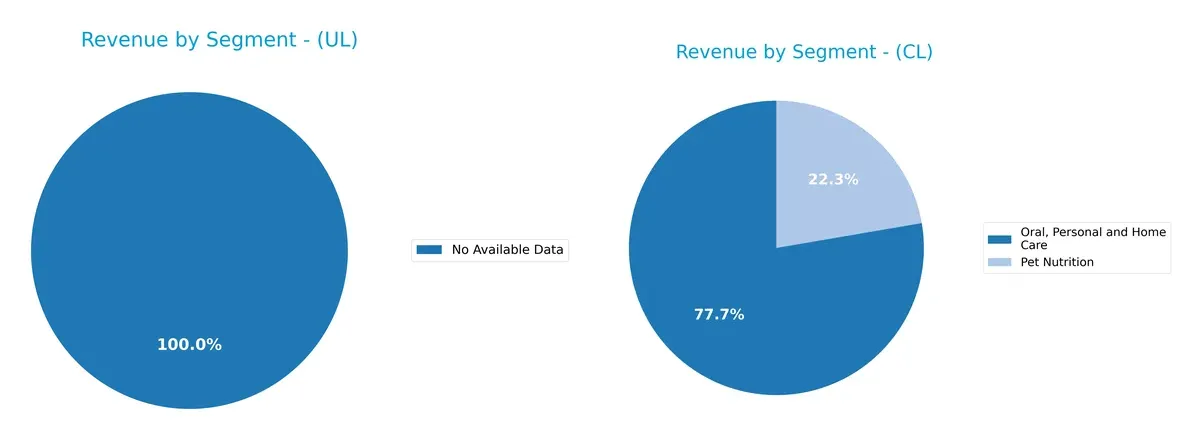
Unilever’s revenue segmentation data is unavailable, preventing direct comparison. Colgate-Palmolive anchors its revenue heavily on Oral, Personal and Home Care, generating $15.6B in 2024, with Pet Nutrition at $4.5B. This concentration shows a strong focus on personal care, indicating brand ecosystem dominance but also concentration risk if consumer preferences shift. Without Unilever’s segment data, assessing diversification differences remains incomplete.
Strengths and Weaknesses Comparison
This table compares the Strengths and Weaknesses of Unilever PLC and Colgate-Palmolive Company:
Unilever PLC Strengths
- Favorable ROE at 28.73% and ROIC at 11.12%
- Strong interest coverage of 10.06
- Favorable fixed asset turnover at 5.21
- Dividend yield of 2.79%
- Global presence with diversified geographic revenues
Colgate-Palmolive Strengths
- Very high ROE at 1362.74% and ROIC at 30.56%
- Favorable net margin of 14.37%
- Strong interest coverage at 12.46
- Higher asset turnover of 1.25
- Growing revenue in two product segments totaling 20B USD
- Dividend yield of 2.41%
Unilever PLC Weaknesses
- Unfavorable current and quick ratios below 1
- High debt-to-equity at 1.53
- Unfavorable P/E of 26.93 and P/B of 7.74
- Neutral net margin of 9.45%
- Asset turnover moderate at 0.76
Colgate-Palmolive Weaknesses
- Unfavorable P/B ratio extremely high at 350.65
- Unfavorable debt-to-assets at 53.05% and high debt/equity at 40.15
- Current and quick ratios below 1
- Unfavorable P/E at 25.73
Both companies excel in profitability metrics and maintain dividend yields appealing to income investors. Unilever’s global geographic diversification contrasts with Colgate-Palmolive’s focused but growing product segments. Each faces liquidity and valuation challenges that merit close monitoring in their capital allocation strategies.
The Moat Duel: Analyzing Competitive Defensibility
A structural moat is the only true shield protecting long-term profits from relentless competitive erosion. Let’s dissect the moats for two consumer staples giants:
Unilever PLC: Diversified Brand Portfolio with Moderate Cost Advantage
Unilever leverages brand strength and scale to maintain stable margins and a 6.7% ROIC premium over WACC. However, its declining ROIC trend signals margin pressure in 2026 from rising input costs and regional market volatility.
Colgate-Palmolive Company: Focused Brand Loyalty with Expanding ROIC
Colgate’s moat centers on entrenched brand loyalty and product innovation, reflected in a robust 25.7% ROIC premium over WACC. Its rising ROIC trend suggests growing profitability and stronger capital efficiency heading into 2026.
Verdict: Brand Loyalty vs. Diversified Scale
Colgate’s wider and deepening moat outpaces Unilever’s moderate but eroding advantage. I believe Colgate is better positioned to defend market share through innovation and focused brand equity in the years ahead.
Which stock offers better returns?
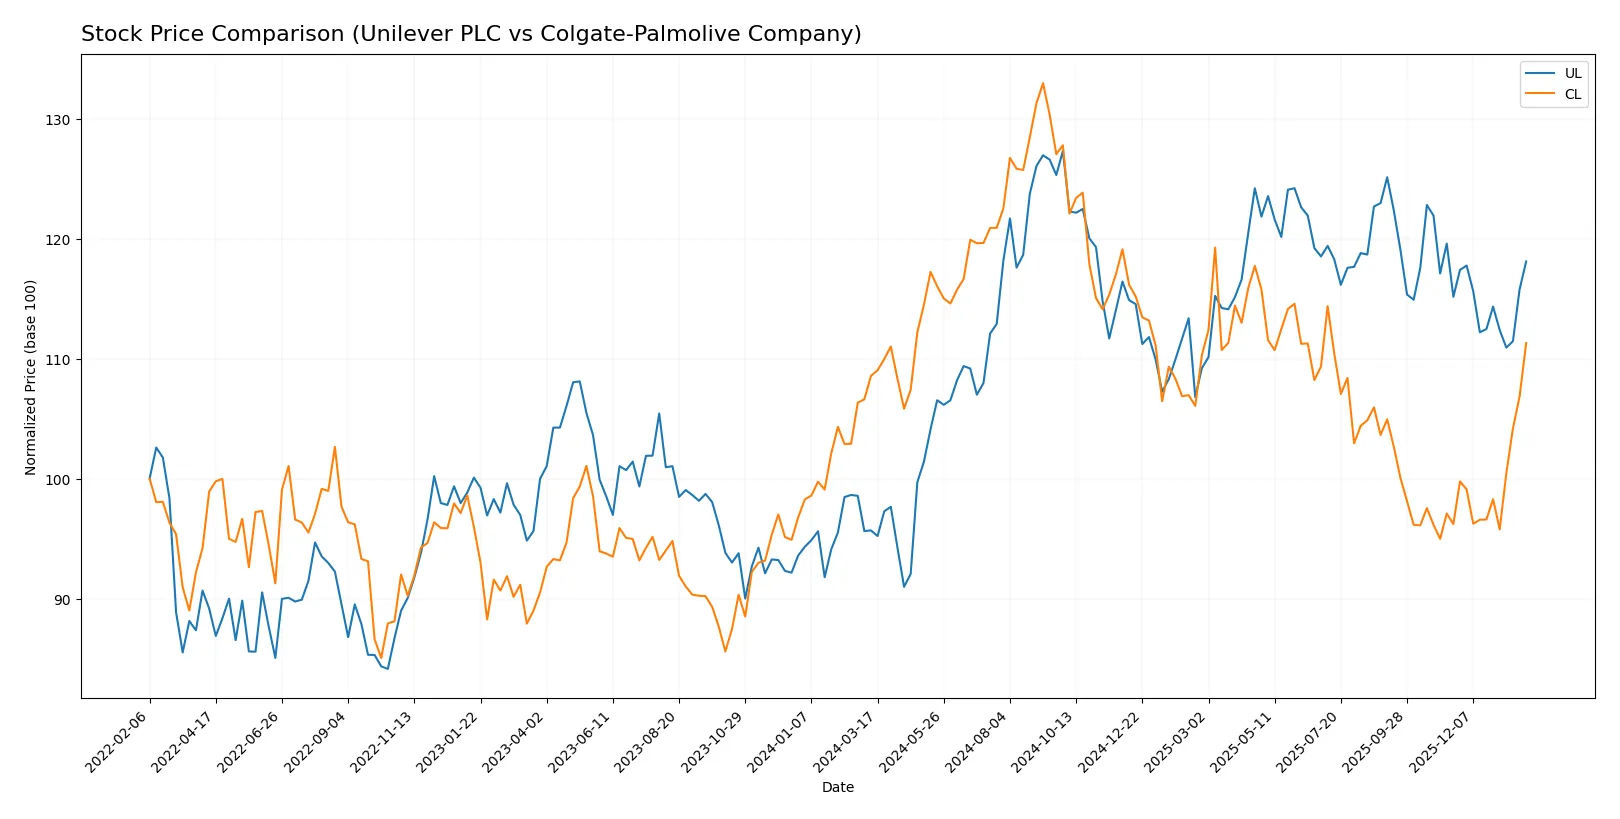
Over the past 12 months, Unilever PLC and Colgate-Palmolive Company both experienced bullish price trends with notable shifts in momentum and trading volumes.
Trend Comparison
Unilever PLC’s stock rose 23.44% over the past year, reflecting a strong bullish trend with deceleration in momentum and moderate volatility. Its price peaked at 73.69 and bottomed at 52.66.
Colgate-Palmolive’s stock gained 2.52% over the same period, showing a mild bullish trend with accelerating momentum and higher volatility. It traded between 77.05 and 107.86.
Unilever’s larger overall gain contrasts with Colgate-Palmolive’s accelerating recent surge, but Unilever delivered the highest market performance over the full year.
Target Prices
Analysts present a clear consensus on target prices for Unilever PLC and Colgate-Palmolive Company, reflecting moderate upside potential.
| Company | Target Low | Target High | Consensus |
|---|---|---|---|
| Unilever PLC | 60.1 | 71 | 65.55 |
| Colgate-Palmolive Company | 83 | 96 | 89.2 |
The target consensus for Unilever suggests a slight undervaluation relative to its current price of $68.36. Colgate-Palmolive’s consensus price of $89.2 sits just below its current $90.29, indicating a balanced risk-reward profile.

Don’t Let Luck Decide Your Entry Point
Optimize your entry points with our advanced ProRealTime indicators. You’ll get efficient buy signals with precise price targets for maximum performance. Start outperforming now!
How do institutions grade them?
The following tables summarize recent institutional grades for Unilever PLC and Colgate-Palmolive Company:
Unilever PLC Grades
This table shows recent grade changes and maintenance by reputable institutions for Unilever PLC.
| Grading Company | Action | New Grade | Date |
|---|---|---|---|
| Erste Group | Downgrade | Hold | 2024-11-19 |
| B of A Securities | Upgrade | Buy | 2024-08-22 |
| JP Morgan | Upgrade | Overweight | 2024-05-23 |
| Argus Research | Maintain | Buy | 2024-05-08 |
| Morgan Stanley | Downgrade | Underweight | 2024-02-27 |
| Bernstein | Upgrade | Market Perform | 2022-03-14 |
| Bernstein | Upgrade | Market Perform | 2022-03-13 |
| Bernstein | Upgrade | Market Perform | 2021-11-01 |
| Bernstein | Upgrade | Market Perform | 2021-10-31 |
| Deutsche Bank | Downgrade | Hold | 2021-09-16 |
Colgate-Palmolive Company Grades
This table shows recent grade changes and maintenance by reputable institutions for Colgate-Palmolive Company.
| Grading Company | Action | New Grade | Date |
|---|---|---|---|
| JP Morgan | Maintain | Overweight | 2026-01-16 |
| UBS | Maintain | Buy | 2026-01-14 |
| Wells Fargo | Upgrade | Equal Weight | 2026-01-13 |
| TD Cowen | Maintain | Buy | 2026-01-08 |
| Piper Sandler | Upgrade | Overweight | 2026-01-07 |
| JP Morgan | Maintain | Overweight | 2025-12-18 |
| Argus Research | Downgrade | Hold | 2025-12-11 |
| RBC Capital | Upgrade | Outperform | 2025-12-09 |
| Barclays | Maintain | Equal Weight | 2025-11-04 |
| Citigroup | Maintain | Buy | 2025-11-03 |
Which company has the best grades?
Colgate-Palmolive Company has consistently stronger and more recent grades, including multiple Buy and Overweight ratings. Unilever’s grades show mixed signals with several downgrades and Hold ratings. Investors may perceive Colgate as currently more favored by analysts.
Risks specific to each company
The following categories identify critical pressure points and systemic threats facing both Unilever PLC and Colgate-Palmolive Company in the challenging 2026 market environment:
1. Market & Competition
Unilever PLC
- Faces intense competition in beauty and food segments; innovation and brand loyalty key to defend market share.
Colgate-Palmolive Company
- Competes strongly in oral care and pet nutrition; expansion into therapeutic pet products adds complexity.
2. Capital Structure & Debt
Unilever PLC
- Debt-to-equity ratio at 1.53 signals elevated leverage, raising financial risk despite strong interest coverage.
Colgate-Palmolive Company
- Debt-to-equity extremely high at 40.15, indicating very high leverage; balance sheet risk remains a concern.
3. Stock Volatility
Unilever PLC
- Low beta of 0.223 suggests limited stock volatility and defensive profile amid market fluctuations.
Colgate-Palmolive Company
- Slightly higher beta at 0.285 still signals relative stock stability in volatile markets.
4. Regulatory & Legal
Unilever PLC
- Global operations expose it to diverse regulatory regimes, especially in food safety and sustainability compliance.
Colgate-Palmolive Company
- Faces regulatory scrutiny in oral care and pet nutrition sectors, including product safety and labeling standards.
5. Supply Chain & Operations
Unilever PLC
- Complex global supply chains vulnerable to disruptions in raw materials and logistics amid geopolitical tensions.
Colgate-Palmolive Company
- Supply chain risks amplified by dual-segment operations; pet nutrition ingredient sourcing adds extra complexity.
6. ESG & Climate Transition
Unilever PLC
- Strong ESG commitments, but must navigate carbon reduction and sustainable sourcing pressures aggressively.
Colgate-Palmolive Company
- ESG progress steady; climate transition risks remain, particularly in packaging and ingredient sustainability.
7. Geopolitical Exposure
Unilever PLC
- Significant exposure to emerging markets with geopolitical instability; currency fluctuations impact earnings.
Colgate-Palmolive Company
- Primarily US-focused but global supply chains expose it to trade tensions and cross-border risks.
Which company shows a better risk-adjusted profile?
Unilever’s most impactful risk is its high leverage despite robust operational metrics. Colgate-Palmolive’s critical vulnerability lies in its extreme debt-to-equity ratio, posing significant financial risk. Despite this, Colgate’s stronger profitability and higher Altman Z-score reflect a somewhat better risk-adjusted profile. Notably, both firms share a concerning low current ratio, signaling liquidity caution.
Final Verdict: Which stock to choose?
Unilever PLC’s superpower lies in its robust capital efficiency and consistent value creation, underpinned by a strong ROIC exceeding its cost of capital. However, its stretched liquidity ratios warrant caution as a point of vigilance. It suits investors with an appetite for steady, slightly favorable returns in a diversified growth portfolio.
Colgate-Palmolive’s strategic moat is its durable competitive advantage marked by a growing ROIC and superior operational returns, offering a safer harbor in volatile markets. It displays stronger income quality and balance sheet stability relative to Unilever, fitting well for GARP investors seeking reliable earnings and capital preservation.
If you prioritize capital efficiency and stable value creation, Unilever outshines as the compelling choice due to its favorable ROIC and dividend yield. However, if you seek durable competitive advantage coupled with stronger income quality and balance sheet safety, Colgate-Palmolive offers better stability and growth potential in a conservative growth strategy. Both present distinct analytical scenarios depending on your risk tolerance and investment horizon.
Disclaimer: Investment carries a risk of loss of initial capital. The past performance is not a reliable indicator of future results. Be sure to understand risks before making an investment decision.
Go Further
I encourage you to read the complete analyses of Unilever PLC and Colgate-Palmolive Company to enhance your investment decisions: