Home > Comparison > Consumer Defensive > CL vs NWL
The strategic rivalry between Colgate-Palmolive Company and Newell Brands Inc. shapes the competitive landscape in the consumer defensive sector. Colgate-Palmolive operates as a global leader in household and personal products with a focus on oral and pet care, while Newell Brands spans a diversified portfolio including commercial solutions and home appliances. This analysis examines their contrasting operational models to identify which offers a superior risk-adjusted return for a diversified portfolio.
Table of contents
Companies Overview
Colgate-Palmolive and Newell Brands stand as key players in the Household & Personal Products industry with distinct market footprints.
Colgate-Palmolive Company: Global Consumer Products Leader
Colgate-Palmolive dominates as a manufacturer and seller of personal and home care products worldwide. Its core revenue stems from oral care, personal hygiene, and pet nutrition brands like Colgate and Hill’s Science Diet. In 2026, it focuses strategically on expanding its oral care portfolio and enhancing pet nutrition offerings to capture evolving consumer trends.
Newell Brands Inc.: Diversified Consumer Goods Innovator
Newell Brands designs and distributes a broad range of consumer and commercial products, including kitchen appliances and outdoor gear. It generates revenue across five segments, from home solutions to learning and development. The company’s 2026 strategy centers on streamlining its portfolio and boosting innovation within its home appliances and outdoor recreation segments.
Strategic Collision: Similarities & Divergences
Both firms compete in consumer staples but pursue different philosophies: Colgate-Palmolive relies on strong brand recognition in essential personal care and pet nutrition, while Newell Brands leverages a diversified product mix across various consumer categories. Their primary battleground is consumer loyalty and innovation in household essentials. Investors should note their contrasting scale and focus, which shape distinct risk and growth profiles.
Income Statement Comparison
This data dissects the core profitability and scalability of both corporate engines to reveal who dominates the bottom line:
| Metric | Colgate-Palmolive Company (CL) | Newell Brands Inc. (NWL) |
|---|---|---|
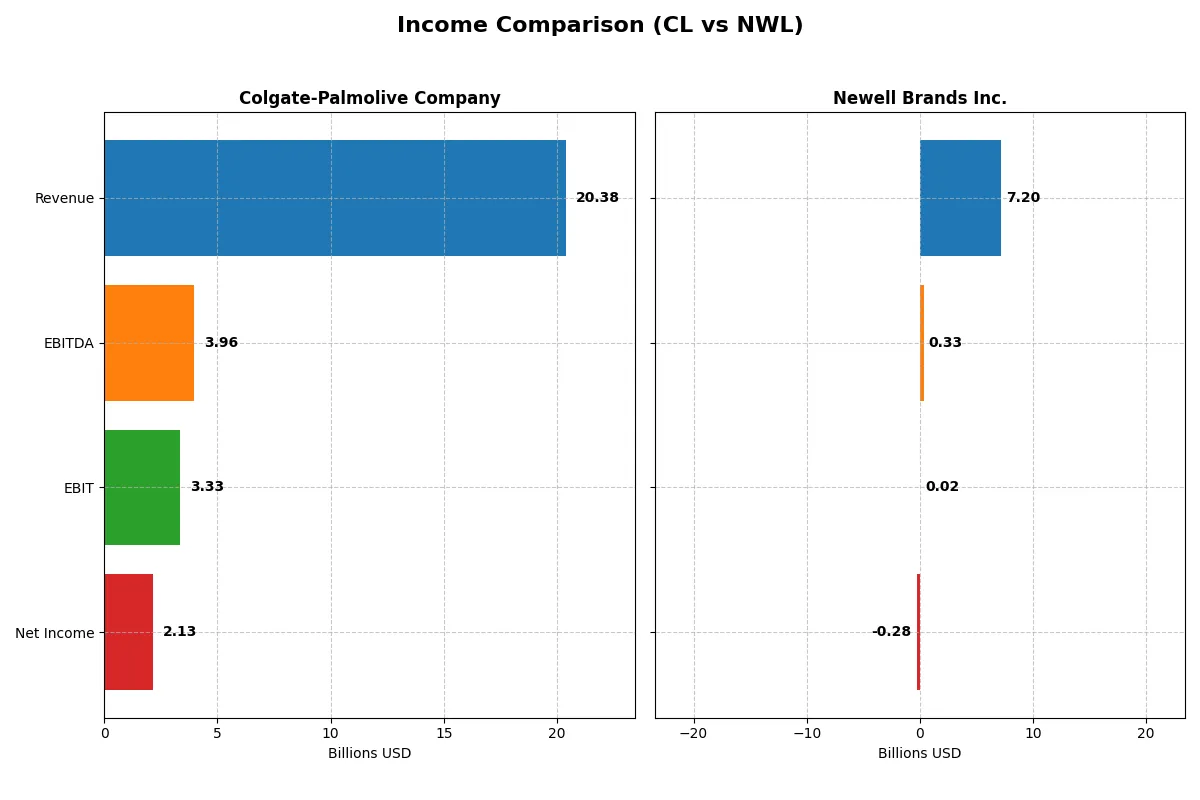
| Revenue | 20.38B | 7.20B |
| Cost of Revenue | 8.13B | 4.77B |
| Operating Expenses | 7.90B | 1.99B |
| Gross Profit | 12.25B | 2.43B |
| EBITDA | 3.96B | 331M |
| EBIT | 3.33B | 20M |
| Interest Expense | 267M | 321M |
| Net Income | 2.13B | -285M |
| EPS | 2.64 | -0.68 |
| Fiscal Year | 2025 | 2025 |
Income Statement Analysis: The Bottom-Line Duel
This income statement comparison reveals which company runs a more efficient and profitable corporate engine through recent financial performance.
Colgate-Palmolive Company Analysis
Colgate-Palmolive’s revenue grew steadily from 17.4B in 2021 to 20.4B in 2025, showing 17% growth over five years. Despite a slight revenue growth slowdown and a 27% net margin decline in 2025, its gross margin remains robust at 60.1%, sustaining a healthy net margin above 10%. The dip in EBIT and EPS in 2025 signals margin pressure but overall margin quality stays favorable.
Newell Brands Inc. Analysis
Newell’s revenue shrank nearly 32% from 10.6B in 2021 to 7.2B in 2025, reflecting persistent top-line weakness. Gross margin declined to 33.8%, with EBIT margin barely positive at 0.28%, and a negative net margin of -3.96% in 2025. The company’s net income worsened sharply, posting a loss of 285M, highlighting ongoing operational challenges and deteriorating profitability momentum.
Margin Strength vs. Shrinking Scale
Colgate-Palmolive clearly outperforms Newell in profitability and margin resilience despite minor recent setbacks. Colgate maintains strong gross and net margins, reflecting operational efficiency and pricing power. Newell struggles with declining revenues and negative net income, undermining its earnings stability. For investors, Colgate’s profile offers more consistent income generation and margin durability.
Financial Ratios Comparison
These vital ratios act as a diagnostic tool to expose the underlying fiscal health, valuation premiums, and capital efficiency of the companies analyzed:
| Ratios | Colgate-Palmolive Company (CL) | Newell Brands Inc. (NWL) |
|---|---|---|
| ROE | 39.48% | -11.92% |
| ROIC | 30.34% | 5.09% |
| P/E | 29.97 | -5.46 |
| P/B | 1183.40 | 0.65 |
| Current Ratio | 1.00 | 1.07 |
| Quick Ratio | 0.64 | 0.57 |
| D/E | 147.93 | 2.32 |
| Debt-to-Assets | 48.92% | 51.69% |
| Interest Coverage | 16.28 | 1.39 |
| Asset Turnover | 1.25 | 0.67 |
| Fixed Asset Turnover | 4.37 | 4.33 |
| Payout Ratio | 85.51% | -42.11% |
| Dividend Yield | 2.85% | 7.71% |
| Fiscal Year | 2025 | 2025 |
Efficiency & Valuation Duel: The Vital Signs
Financial ratios act as a company’s DNA, unveiling hidden risks and operational strengths crucial for investment insight.
Colgate-Palmolive Company
Colgate delivers strong profitability with a ROE of 39.5% and a favorable 10.5% net margin. However, its P/E near 30 signals a stretched valuation. The firm balances growth and returns, offering a 2.85% dividend yield, reflecting disciplined capital allocation amid premium pricing.
Newell Brands Inc.
Newell struggles with negative ROE (-11.9%) and net margin (-4%), indicating operational challenges. Its valuation appears attractive, with a negative P/E and a low P/B of 0.65. Despite a high dividend yield of 7.7%, the firm’s weak interest coverage and leverage raise caution on sustainability.
Premium Valuation vs. Operational Safety
Colgate’s robust profitability justifies its premium valuation, while Newell’s cheap multiples mask operational weakness and financial stress. Investors seeking stability may prefer Colgate’s disciplined returns. Those tolerant of risk and valuation bargains might consider Newell’s turnaround potential.
Which one offers the Superior Shareholder Reward?
I see Colgate-Palmolive (CL) delivers a steady dividend yield near 2.85% with a high payout ratio of 85.5%, supported by strong free cash flow coverage of 86.5%. Newell Brands (NWL) shows a higher dividend yield at 7.7% but with a negative net margin and weak free cash flow coverage near 6.4%, indicating risk to sustainability. CL’s consistent buyback activity complements its dividend, while NWL’s buybacks are limited amid financial challenges. I conclude CL offers the more sustainable and attractive total return profile in 2026, balancing income with prudent capital allocation.
Comparative Score Analysis: The Strategic Profile
The radar chart reveals the fundamental DNA and trade-offs of both firms across key financial metrics:
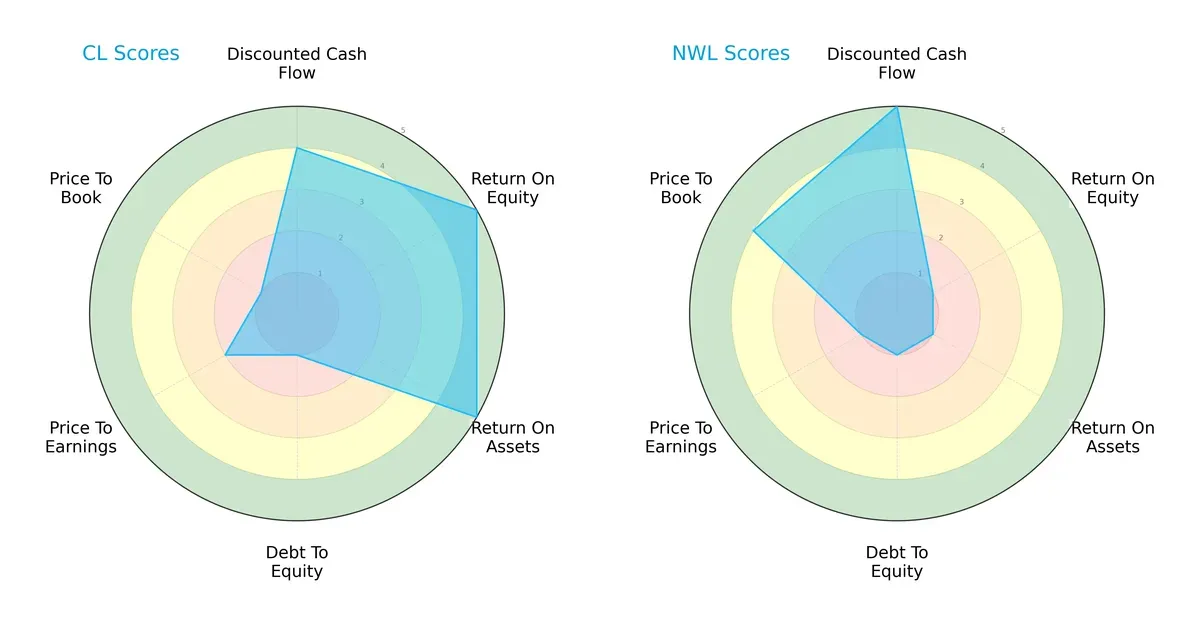
Colgate-Palmolive Company (CL) presents a balanced profile with very favorable returns on equity (5) and assets (5), supported by a strong discounted cash flow score (4). However, it carries a high financial risk reflected in its very unfavorable debt-to-equity (1) and valuation scores. Newell Brands Inc. (NWL) leans heavily on its discounted cash flow advantage (5) and a favorable price-to-book score (4) but suffers from very weak profitability metrics (ROE and ROA at 1) and uniformly poor valuation and leverage scores. CL demonstrates a more stable and diversified financial foundation, while NWL relies on valuation edge amid operational challenges.
Bankruptcy Risk: Solvency Showdown
The Altman Z-Score gap highlights a stark difference in long-term survival odds in this cycle:
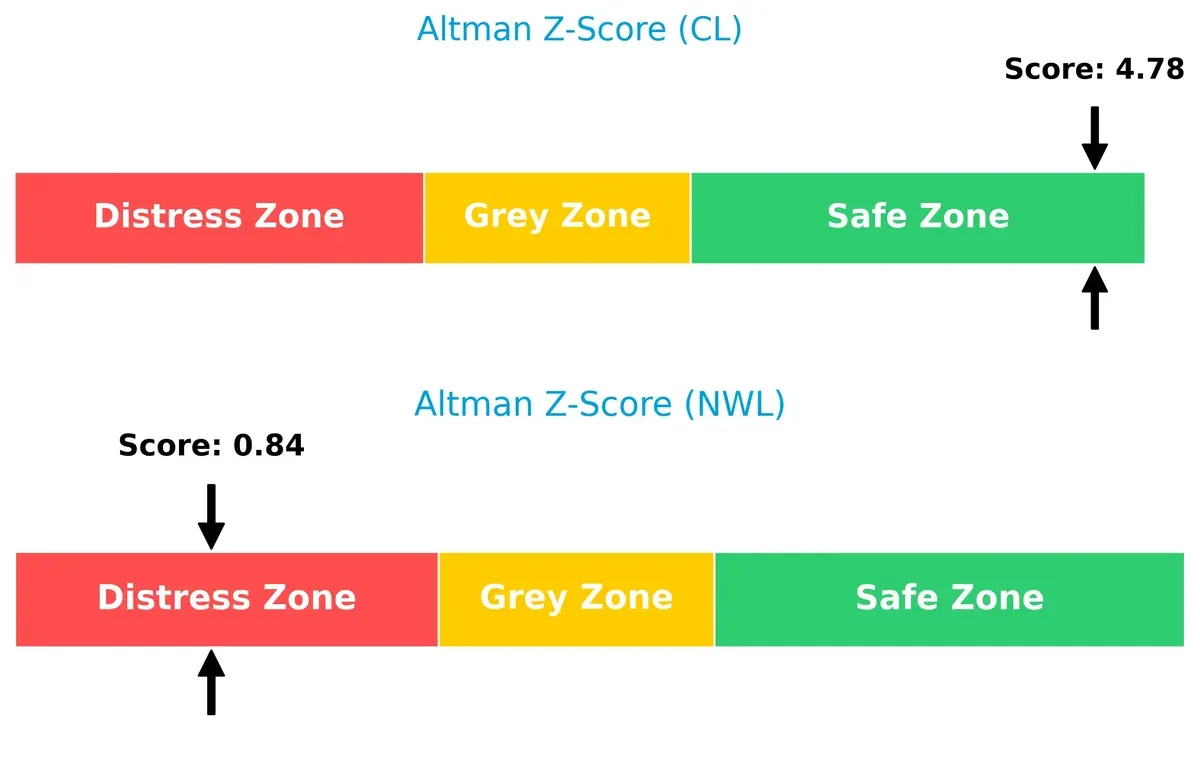
Colgate-Palmolive scores 4.78, well within the safe zone, indicating solid financial stability and low bankruptcy risk. Newell Brands’ score of 0.84 places it in the distress zone, signaling significant financial distress and a heightened risk of default. This divergence is critical for risk-conscious investors prioritizing solvency.
Financial Health: Quality of Operations
Piotroski F-Score comparison sheds light on operational strength and internal financial quality:
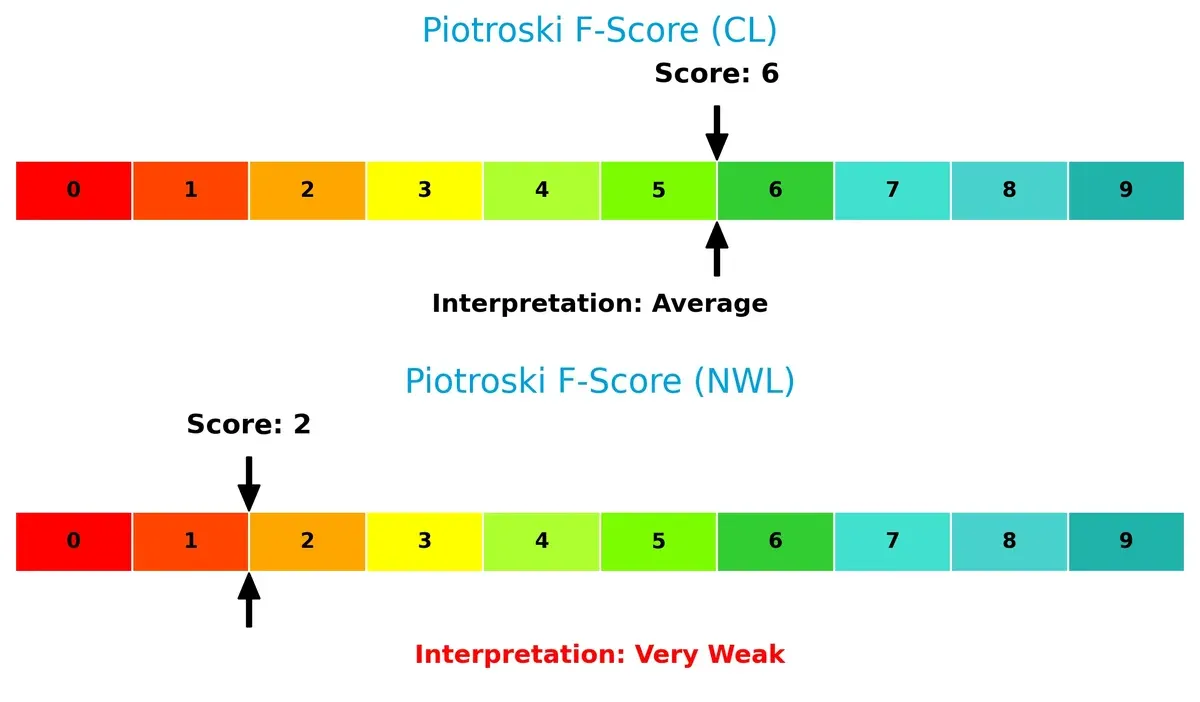
Colgate-Palmolive’s F-Score of 6 suggests average but stable financial health, with no immediate red flags. Newell Brands’ score of 2 signals very weak financial conditions, raising concerns over its internal metrics like profitability, leverage, and liquidity. Investors should consider this disparity when evaluating operational resilience.
How are the two companies positioned?
This section dissects the operational DNA of Colgate-Palmolive and Newell Brands by comparing their revenue distribution and internal strengths and weaknesses. The goal is to confront their economic moats and identify which model offers the most resilient, sustainable advantage today.
Revenue Segmentation: The Strategic Mix
The following visual comparison dissects how Colgate-Palmolive and Newell Brands diversify their income streams and where their primary sector bets lie:
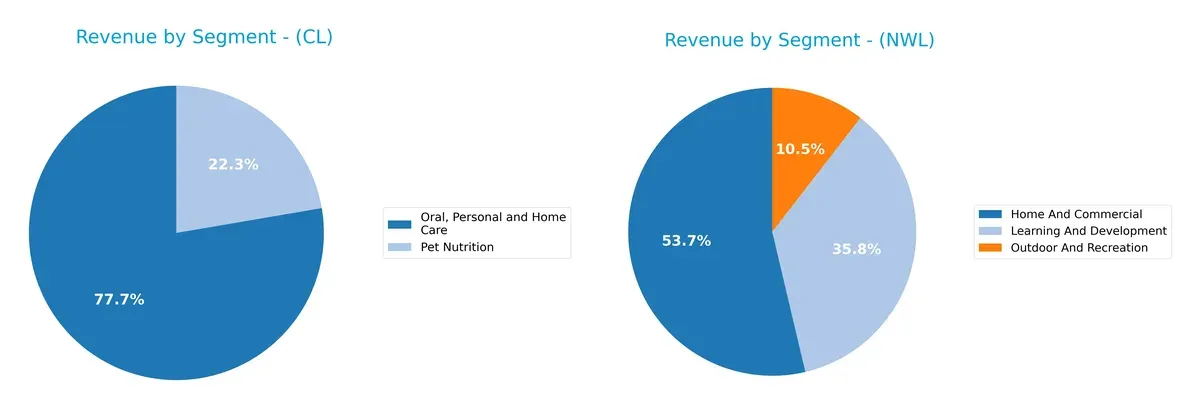
Colgate-Palmolive anchors its revenue in Oral, Personal and Home Care with $15.6B in 2024, complemented by a smaller Pet Nutrition segment at $4.5B. This concentration suggests strong ecosystem lock-in in personal care. In contrast, Newell Brands presents a more diversified mix across Home and Commercial ($4.1B), Learning and Development ($2.7B), and Outdoor and Recreation ($0.8B), reflecting a multi-category strategy that spreads risk but lacks a dominant moat.
Strengths and Weaknesses Comparison
This table compares the strengths and weaknesses of Colgate-Palmolive Company and Newell Brands Inc.:
Colgate-Palmolive Company Strengths
- Strong profitability with 10.46% net margin and 30.34% ROIC
- Favorable interest coverage at 12.46
- High asset turnover ratios reflect operational efficiency
- Diverse product segments in Oral Care and Pet Nutrition
- Stable dividend yield of 2.85%
Newell Brands Inc. Strengths
- Lower valuation multiples with favorable P/E and P/B ratios
- Presence in multiple product categories like Home, Learning, Outdoor
- Geographic diversification across North America and Foreign markets
- WACC favorable at 5.81% supports capital efficiency
- Fixed asset turnover favorable at 4.33
Colgate-Palmolive Company Weaknesses
- Overleveraged with high debt-to-equity at 147.93
- Weak liquidity ratios: current ratio at 1.0 and quick ratio 0.64
- Unfavorable valuation multiples: P/E near 30, P/B extremely high
- Debt represents nearly 49% of assets, indicating leverage risk
Newell Brands Inc. Weaknesses
- Negative profitability with -3.96% net margin and -11.92% ROE
- Weak interest coverage at 0.06 signals risk in servicing debt
- Debt-to-assets ratio unfavorable at 51.69%
- Quick ratio low at 0.57 and high debt-to-equity at 2.32
- Asset turnover mediocre at 0.67, indicating lower operational efficiency
Colgate-Palmolive demonstrates strong profitability and operational efficiency but faces risks from high leverage and weak liquidity. Newell Brands struggles with profitability and financial stability despite product and geographic diversification. These factors shape each company’s strategic priorities and risk management.
The Moat Duel: Analyzing Competitive Defensibility
A structural moat is the only defense protecting long-term profits from relentless competition erosion. Let’s dissect the moats of two consumer product giants:
Colgate-Palmolive Company: Intangible Assets & Brand Power
Colgate’s moat stems from strong brand recognition and trusted product lines, supporting stable 60% gross margins and 16% EBIT margins. Growing ROIC signals deepening competitive advantage in 2026.
Newell Brands Inc.: Diverse Portfolio with Weak Capital Returns
Newell relies on product diversification but suffers from declining ROIC and negative net margins, signaling weak capital efficiency. Its shrinking market presence risks further erosion amid competitive pressures.
Brand Trust vs. Portfolio Breadth: Who Holds the Stronger Moat?
Colgate’s wide moat, backed by superior profitability and growing returns, outmatches Newell’s faltering capital efficiency and shrinking margins. Colgate is better positioned to defend and grow market share.
Which stock offers better returns?
Over the past year, Colgate-Palmolive’s stock rose steadily with accelerating gains, while Newell Brands experienced a sharp overall decline despite recent modest recovery.
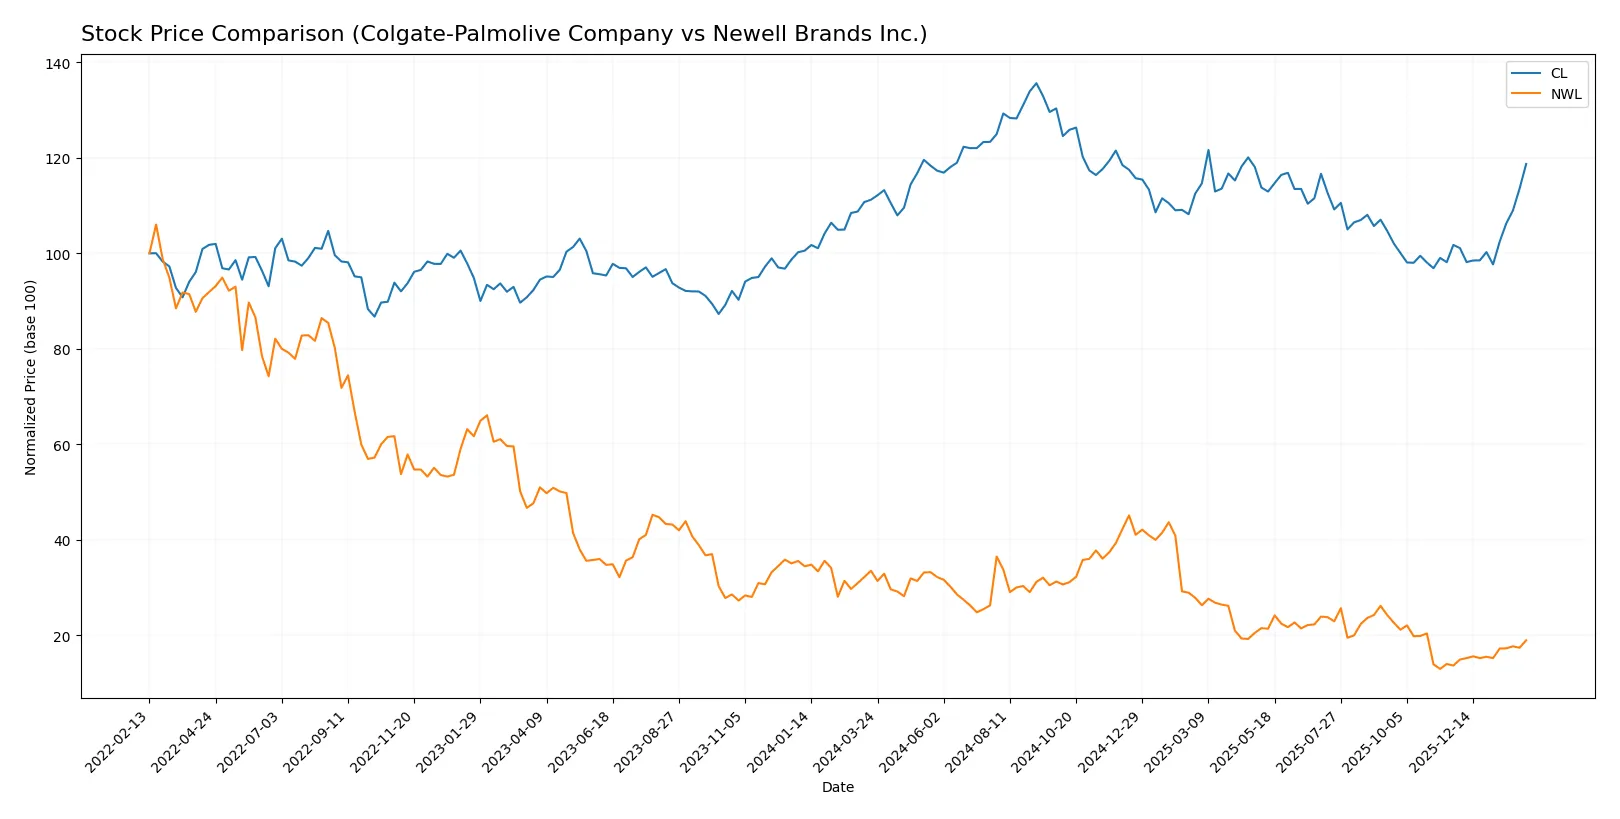
Trend Comparison
Colgate-Palmolive’s stock increased 6.74% over 12 months, showing a bullish trend with accelerating momentum and a high volatility level of 7.35%. It hit a peak of 107.86 and a low of 77.05.
Newell Brands declined 43.4% overall in the same period, marking a bearish trend with accelerating downward pressure. Volatility remained low at 1.9%, with prices ranging between 11.01 and 3.17.
Colgate-Palmolive delivered the highest market performance, outperforming Newell Brands by a wide margin despite Newell’s recent 38.62% short-term rebound.
Target Prices
Analysts present a cautious consensus on target prices for Colgate-Palmolive and Newell Brands.
| Company | Target Low | Target High | Consensus |
|---|---|---|---|
| Colgate-Palmolive Company | 85 | 100 | 91.8 |
| Newell Brands Inc. | 4.25 | 8 | 5.58 |
Colgate-Palmolive’s consensus target of 91.8 slightly undervalues its current price of 94.41, suggesting modest downside risk. Newell Brands’ target consensus of 5.58 exceeds its current price of 4.63, signaling potential upside.

Don’t Let Luck Decide Your Entry Point
Optimize your entry points with our advanced ProRealTime indicators. You’ll get efficient buy signals with precise price targets for maximum performance. Start outperforming now!
How do institutions grade them?
Colgate-Palmolive Company Grades
The table below summarizes recent institutional grades for Colgate-Palmolive Company.
| Grading Company | Action | New Grade | Date |
|---|---|---|---|
| Barclays | Maintain | Equal Weight | 2026-02-03 |
| JP Morgan | Maintain | Overweight | 2026-02-02 |
| Wells Fargo | Maintain | Equal Weight | 2026-02-02 |
| Citigroup | Maintain | Buy | 2026-02-02 |
| Jefferies | Maintain | Hold | 2026-02-02 |
| B of A Securities | Maintain | Buy | 2026-02-02 |
| Morgan Stanley | Maintain | Overweight | 2026-02-02 |
| Deutsche Bank | Maintain | Hold | 2026-02-02 |
| Evercore ISI Group | Maintain | Outperform | 2026-02-02 |
| Piper Sandler | Maintain | Overweight | 2026-02-02 |
Newell Brands Inc. Grades
Below are recent institutional grades for Newell Brands Inc.
| Grading Company | Action | New Grade | Date |
|---|---|---|---|
| Canaccord Genuity | Maintain | Buy | 2026-01-26 |
| UBS | Maintain | Neutral | 2026-01-14 |
| Citigroup | Maintain | Neutral | 2026-01-14 |
| Citigroup | Maintain | Neutral | 2025-12-17 |
| UBS | Maintain | Neutral | 2025-12-02 |
| Canaccord Genuity | Maintain | Buy | 2025-11-03 |
| Citigroup | Maintain | Neutral | 2025-11-03 |
| JP Morgan | Maintain | Overweight | 2025-11-03 |
| RBC Capital | Maintain | Sector Perform | 2025-11-03 |
| JP Morgan | Maintain | Overweight | 2025-10-23 |
Which company has the best grades?
Colgate-Palmolive has a stronger consensus with multiple “Buy,” “Overweight,” and “Outperform” ratings. Newell Brands mostly holds “Neutral” and fewer “Buy” grades. This suggests investors may view Colgate as having a better near-term outlook.
Risks specific to each company
The following categories identify critical pressure points and systemic threats facing Colgate-Palmolive Company and Newell Brands Inc. in the 2026 market environment:
1. Market & Competition
Colgate-Palmolive Company
- Strong brand portfolio in household and personal products supports steady demand.
Newell Brands Inc.
- Diverse product segments face intense competition and market share pressure.
2. Capital Structure & Debt
Colgate-Palmolive Company
- High debt-to-equity ratio (148) signals leveraged balance sheet risk.
Newell Brands Inc.
- Debt levels are high with poor interest coverage (0.06), raising solvency concerns.
3. Stock Volatility
Colgate-Palmolive Company
- Low beta (0.29) indicates stable stock with limited volatility.
Newell Brands Inc.
- Higher beta (0.93) reflects greater stock price fluctuations and risk.
4. Regulatory & Legal
Colgate-Palmolive Company
- Operates globally with exposure to consumer product regulations; generally manageable.
Newell Brands Inc.
- Broad product range increases regulatory complexity and potential compliance risks.
5. Supply Chain & Operations
Colgate-Palmolive Company
- Efficient asset turnover (1.25) supports operational resilience.
Newell Brands Inc.
- Lower asset turnover (0.67) suggests operational inefficiencies and supply chain strain.
6. ESG & Climate Transition
Colgate-Palmolive Company
- Established sustainability initiatives aligned with industry standards.
Newell Brands Inc.
- ESG efforts less mature, possibly exposing to reputational and transition risks.
7. Geopolitical Exposure
Colgate-Palmolive Company
- Global footprint subjects it to currency and trade policy risks.
Newell Brands Inc.
- Similar multinational exposure but less diversified product base increases vulnerability.
Which company shows a better risk-adjusted profile?
Colgate-Palmolive’s main risk lies in its high leverage, but it boasts consistent profitability and stable stock behavior. Newell Brands suffers from poor profitability, weak liquidity, and distress-level bankruptcy risk, with its largest concern being solvency. Given these factors, Colgate-Palmolive clearly offers a stronger risk-adjusted profile. Its Altman Z-score in the safe zone contrasts sharply with Newell’s distress zone, underscoring financial stability amid market pressures.
Final Verdict: Which stock to choose?
Colgate-Palmolive’s superpower lies in its robust capital efficiency and value creation, evidenced by a soaring ROIC well above its cost of capital. Its main point of vigilance is a near-parity current ratio, signaling tight short-term liquidity. This stock fits well in an income-focused or conservative growth portfolio.
Newell Brands’ strategic moat seems fragile, with declining profitability and a struggling ROIC below its WACC. Its relative safety profile is weaker than Colgate’s, but a lower valuation and recent price recovery might appeal to risk-tolerant investors. It suits a speculative or turnaround-focused portfolio.
If you prioritize consistent value creation and financial resilience, Colgate-Palmolive outshines with sustainable profitability and dividend appeal. However, if you seek deep value with potential for a turnaround, Newell Brands offers better volatility-driven opportunities despite its challenges. Both choices demand careful risk management.
Disclaimer: Investment carries a risk of loss of initial capital. The past performance is not a reliable indicator of future results. Be sure to understand risks before making an investment decision.
Go Further
I encourage you to read the complete analyses of Colgate-Palmolive Company and Newell Brands Inc. to enhance your investment decisions: