Home > Comparison > Consumer Defensive > CL vs KMB
The strategic rivalry between Colgate-Palmolive and Kimberly-Clark defines the competitive landscape of the Household & Personal Products sector. Colgate-Palmolive operates as a diversified consumer products manufacturer with strong oral and pet care segments, while Kimberly-Clark focuses on personal care and consumer tissue products with a broad retail and professional distribution network. This analysis will assess which company’s strategy and operational model delivers the superior risk-adjusted return for a diversified portfolio.

Table of contents
Companies Overview
Colgate-Palmolive and Kimberly-Clark dominate the global household and personal products sector with deep-rooted brand power.
Colgate-Palmolive Company: Oral and Pet Care Powerhouse
Colgate-Palmolive commands the household and personal products market through its Oral, Personal and Home Care, and Pet Nutrition segments. It generates revenue mainly from toothpaste, soaps, shampoos, and pet nutrition under iconic brands like Colgate and Hill’s Science Diet. In 2026, it focuses strategically on expanding its eCommerce footprint and innovation in oral health products.
Kimberly-Clark Corporation: Consumer Tissue and Personal Care Leader
Kimberly-Clark leads by manufacturing and marketing personal care and consumer tissue products globally. Its revenue streams come from diapers, wipes, feminine care, and tissue products under brands like Huggies and Kleenex. The company’s 2026 strategy emphasizes broadening professional hygiene sales and strengthening direct-to-retail relationships across multiple channels.
Strategic Collision: Similarities & Divergences
Both firms excel in consumer staples but differ philosophically: Colgate-Palmolive blends oral care with pet nutrition, while Kimberly-Clark focuses on personal care and tissue. Their battleground lies in diversified household essentials sold through retail and eCommerce. Investors face distinct profiles—Colgate offers broader segment diversity; Kimberly-Clark leverages deep expertise in tissue and professional products.
Income Statement Comparison
This data dissects the core profitability and scalability of both corporate engines to reveal who dominates the bottom line:
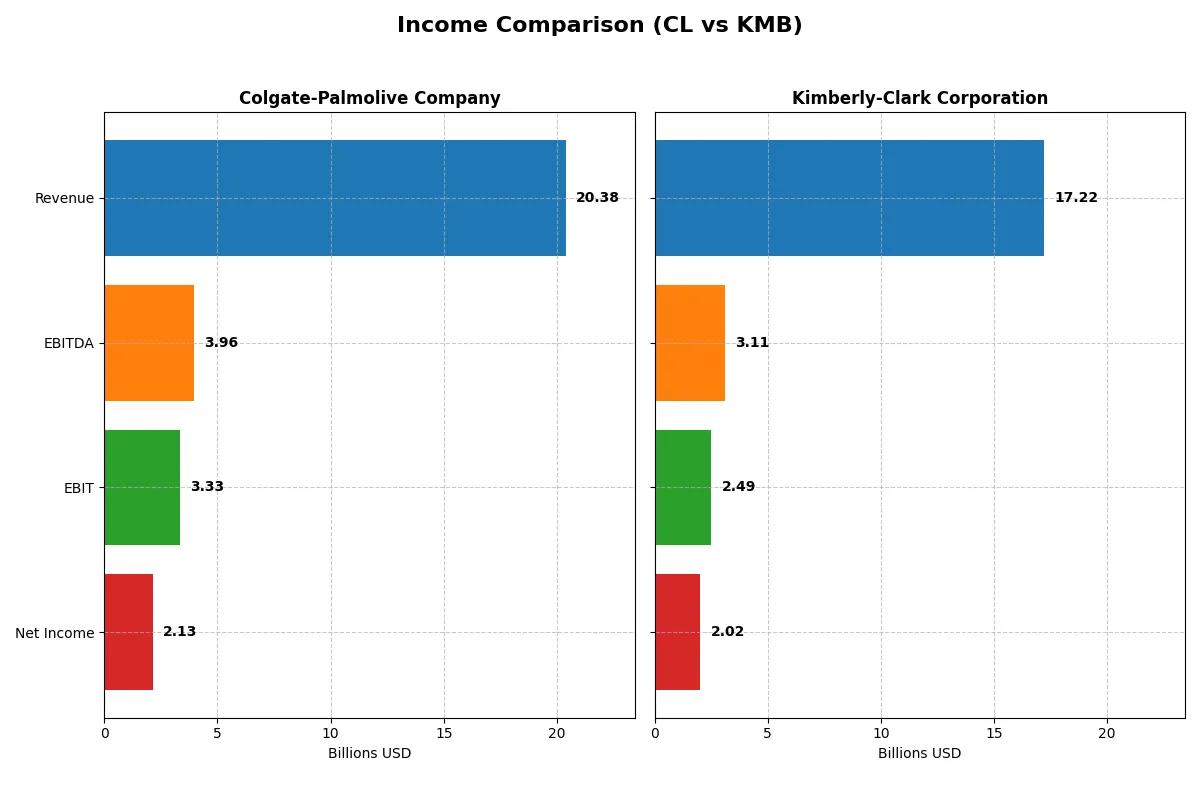
| Metric | Colgate-Palmolive (CL) | Kimberly-Clark (KMB) |
|---|---|---|
| Revenue | 20.4B | 17.2B |
| Cost of Revenue | 8.1B | 11.1B |
| Operating Expenses | 7.9B | 3.6B |
| Gross Profit | 12.3B | 6.1B |
| EBITDA | 4.0B | 3.1B |
| EBIT | 3.3B | 2.5B |
| Interest Expense | 267M | 256M |
| Net Income | 2.1B | 2.0B |
| EPS | 2.64 | 6.08 |
| Fiscal Year | 2025 | 2025 |
Income Statement Analysis: The Bottom-Line Duel
This income statement comparison reveals which company runs a more efficient and profitable corporate engine through key financial metrics.
Colgate-Palmolive Company Analysis
Colgate-Palmolive’s revenue grew steadily to $20.4B in 2025, but net income declined to $2.13B, signaling margin pressure. Gross margin remains robust at 60%, but net margin slipped to 10.5%. EBIT fell 21.7% year-over-year, reflecting rising expenses and weakening operational momentum in the latest fiscal year.
Kimberly-Clark Corporation Analysis
Kimberly-Clark’s revenue shrank 14% to $17.2B in 2025, yet net income rose to $2.02B, boosting net margins to 11.7%. Gross margin dropped to 35.6%, but EBIT margin held firm at 14.5%. Despite top-line contraction, the company improved profitability through cost control and margin expansion in a challenging environment.
Margin Strength vs. Revenue Resilience
Colgate-Palmolive shows superior revenue growth but struggles with declining net income and profitability margins. Kimberly-Clark, meanwhile, faces revenue headwinds but delivers stronger net margin growth and earnings resilience. For investors, Kimberly-Clark’s ability to maintain profitability amid revenue declines offers a more attractive risk-adjusted profile.
Financial Ratios Comparison
These vital ratios act as a diagnostic tool to expose the underlying fiscal health, valuation premiums, and capital efficiency of the companies compared:
| Ratios | Colgate-Palmolive Company (CL) | Kimberly-Clark Corporation (KMB) |
|---|---|---|
| ROE | 13.63% (2024) | 3.03% (2024) |
| ROIC | 30.56% (2024) | 25.33% (2024) |
| P/E | 25.73 (2024) | 17.35 (2024) |
| P/B | 350.65 (2024) | 52.57 (2024) |
| Current Ratio | 0.92 (2024) | 0.80 (2024) |
| Quick Ratio | 0.58 (2024) | 0.54 (2024) |
| D/E | 40.15 (2024) | 9.42 (2024) |
| Debt-to-Assets | 53.05% (2024) | 47.84% (2024) |
| Interest Coverage | 15.01 (2024) | 11.89 (2024) |
| Asset Turnover | 1.25 (2024) | 1.21 (2024) |
| Fixed Asset Turnover | 4.55 (2024) | 2.67 (2024) |
| Payout Ratio | 61.92% (2024) | 63.97% (2024) |
| Dividend Yield | 2.41% (2024) | 3.69% (2024) |
| Fiscal Year | 2024 | 2024 |
Efficiency & Valuation Duel: The Vital Signs
Financial ratios act as the company’s DNA, revealing hidden risks and operational excellence through key profitability and valuation metrics.
Colgate-Palmolive Company
Colgate shows strong profitability with a 14.37% net margin and a striking 1362.74% ROE, signaling operational efficiency. However, its P/E ratio at 25.73 suggests the stock trades at a premium. Shareholders benefit from a 2.41% dividend yield, reflecting a balanced capital return alongside reinvestment in operational growth.
Kimberly-Clark Corporation
Kimberly-Clark posts a solid 11.74% net margin but reports zero ROE and ROIC, indicating limited recent profitability data. The P/E ratio of 16.63 positions the stock as reasonably valued. The company offers a generous 4.94% dividend yield, emphasizing income distribution over growth reinvestment. Some operational metrics remain unavailable or unfavorable.
Premium Valuation vs. Income Focused Dividend
Colgate delivers robust returns and operational strength despite a stretched valuation. Kimberly-Clark offers a higher dividend yield but lacks recent profitability clarity. Investors seeking growth and operational efficiency may prefer Colgate, while income-focused investors might lean toward Kimberly-Clark’s steadier payout.
Which one offers the Superior Shareholder Reward?
I observe Colgate-Palmolive (CL) delivers a consistent dividend yield around 2.4%–2.6%, with payout ratios near 62%–76%, supported by free cash flow coverage above 80%. Its buyback program is moderate, balancing capital return and reinvestment. Kimberly-Clark (KMB) offers a higher dividend yield near 3.7%–4.9% with a payout ratio around 64%–90%, fully covered by free cash flow. KMB’s buybacks are more aggressive, boosting total shareholder return. However, CL’s distribution model couples sustainable dividends with steady buybacks, reflecting prudent capital allocation amid sector cycles. KMB’s higher yield and buybacks appeal to income seekers, but CL’s balanced approach offers superior long-term value. I conclude Colgate-Palmolive provides a more attractive total return profile for 2026 investors focused on sustainability and risk-managed rewards.
Comparative Score Analysis: The Strategic Profile
The radar chart reveals the fundamental DNA and trade-offs of Colgate-Palmolive and Kimberly-Clark, highlighting their strategic strengths and weaknesses:
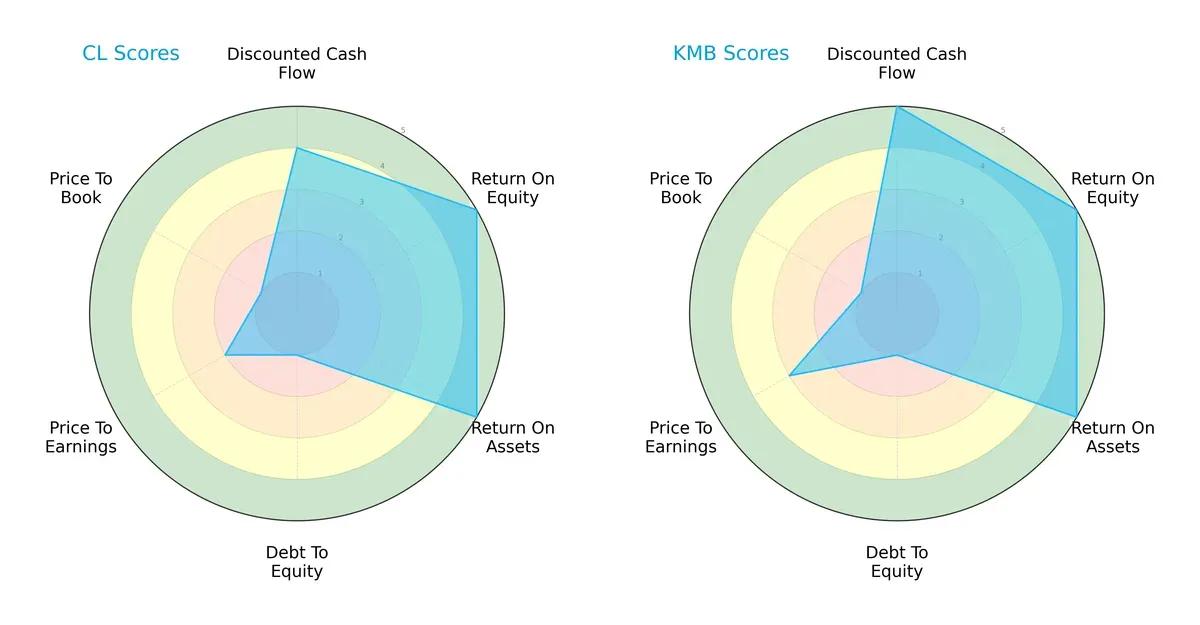
Colgate-Palmolive shows strong operational efficiency with top ROE and ROA scores but suffers from weak financial leverage and valuation metrics. Kimberly-Clark delivers a more balanced profile, excelling in discounted cash flow and maintaining similarly strong returns. Both struggle with debt-to-equity and price-to-book scores, but Kimberly-Clark edges ahead with a better overall and P/E score, signaling slightly stronger valuation discipline.
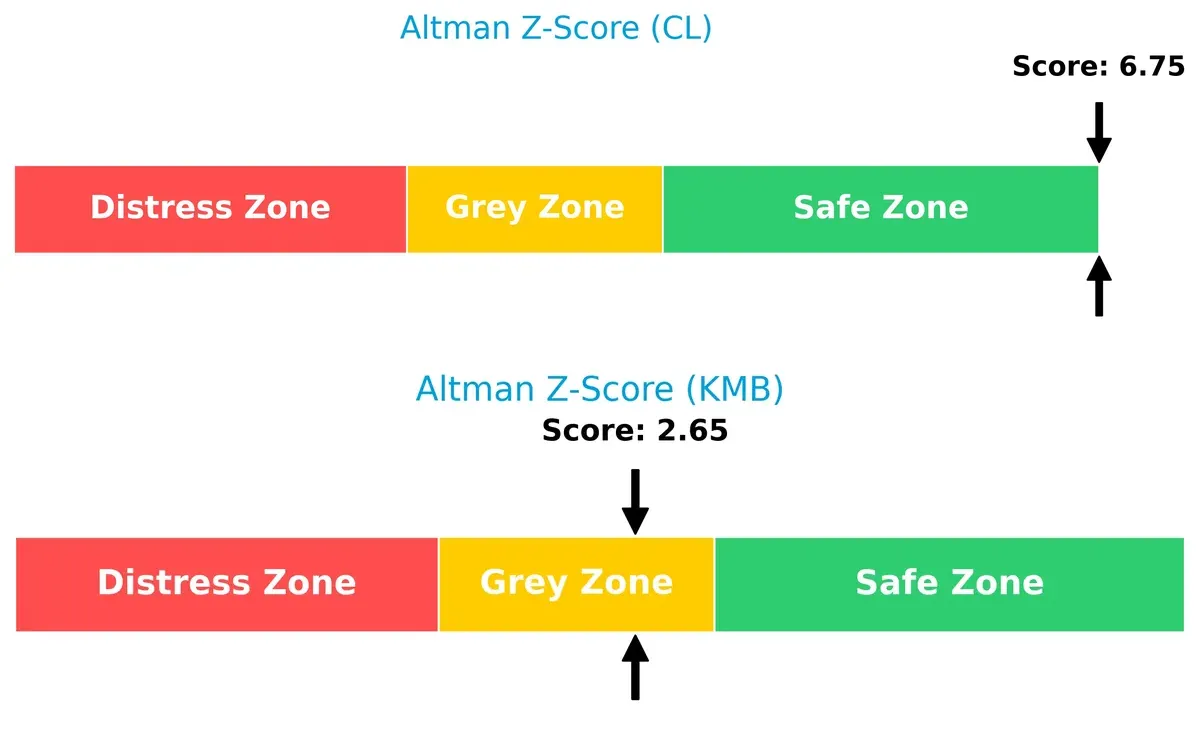
Bankruptcy Risk: Solvency Showdown
Kimberly-Clark’s Altman Z-Score places it in a moderate risk “grey zone,” while Colgate-Palmolive’s score firmly situates it in the “safe zone,” indicating a more secure long-term solvency position:
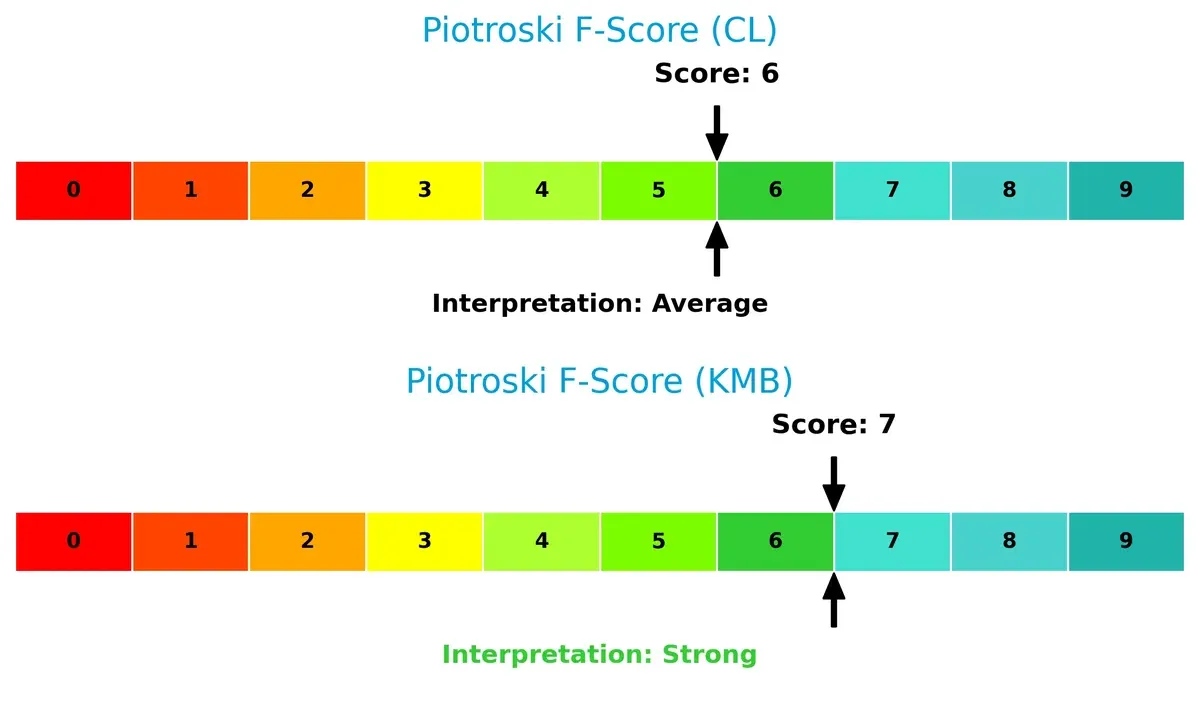
Financial Health: Quality of Operations
Kimberly-Clark’s Piotroski F-Score of 7 suggests stronger internal financial health compared to Colgate-Palmolive’s 6, which indicates mild red flags in operational or profitability metrics:
How are the two companies positioned?
This section dissects the operational DNA of CL and KMB by comparing their revenue distribution and internal dynamics. The goal is to confront their economic moats and identify which model delivers the most resilient competitive advantage today.
Revenue Segmentation: The Strategic Mix
This comparison dissects how Colgate-Palmolive and Kimberly-Clark diversify their income streams and reveals where each bets most heavily in their core sectors:
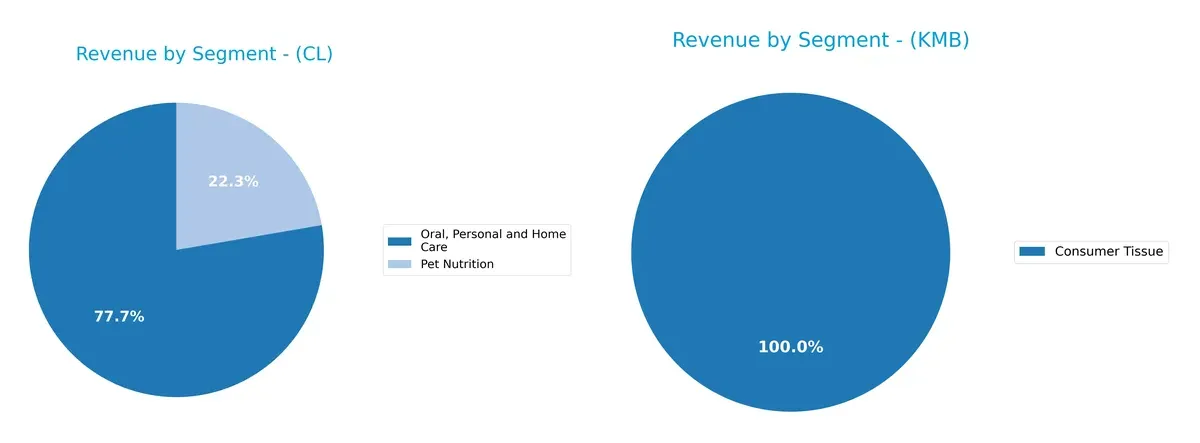
Colgate-Palmolive anchors its revenue in Oral, Personal and Home Care with $15.6B, supplemented by a smaller $4.5B Pet Nutrition segment. Kimberly-Clark pivots on a more diversified base: Personal Care leads with $10.7B, followed by Consumer Tissue at $6.2B, and K-C Professional at $3.4B. Colgate’s concentration suggests strong ecosystem lock-in, while Kimberly-Clark’s spread mitigates concentration risk through multiple stable cash flows.
Strengths and Weaknesses Comparison
This table compares the strengths and weaknesses of Colgate-Palmolive Company and Kimberly-Clark Corporation:
Colgate-Palmolive Company Strengths
- Strong profitability with 14.37% net margin
- High ROE at 1362.74%
- ROIC well above WACC at 30.56%
- Favorable interest coverage at 12.46x
- Consistent asset turnover at 1.25 and fixed asset turnover at 4.55
- Diverse revenue streams including Oral Care and Pet Nutrition
Kimberly-Clark Corporation Strengths
- Favorable net margin at 11.74%
- Positive interest coverage at 9.73x
- Favorable debt metrics with low debt-to-equity and debt-to-assets ratios
- Reliable dividend yield at 4.94%
- Broad product segments including Consumer Tissue, Professional, and Personal Care
- Geographic diversification across US, Europe, Asia, and Latin America
Colgate-Palmolive Company Weaknesses
- Overvalued based on high P/E of 25.73 and P/B of 350.65
- Low liquidity indicated by current ratio 0.92 and quick ratio 0.58
- High leverage with debt-to-assets at 53.05% and debt-to-equity at 40.15
- Limited geographic revenue data available
- Moderate dividend yield at 2.41%
Kimberly-Clark Corporation Weaknesses
- Zero reported ROE and ROIC raise profitability concerns
- Unavailable WACC data limits cost of capital assessment
- Poor liquidity ratios with current and quick ratios at zero
- Asset turnover ratios at zero suggest operational inefficiency
- Neutral P/E valuation at 16.63
Colgate-Palmolive demonstrates robust profitability and efficient capital use but faces valuation and liquidity challenges. Kimberly-Clark shows solid product and geographic diversification but reveals operational and profitability weaknesses requiring strategic attention.
The Moat Duel: Analyzing Competitive Defensibility
A structural moat is the only reliable shield protecting long-term profits from relentless competitive pressures. Let’s dissect the moats of two industry stalwarts:
Colgate-Palmolive Company: Durable Brand and Operational Excellence
Colgate’s moat stems from strong intangible assets and brand loyalty, reflected in a robust 60% gross margin and a very favorable ROIC-WACC differential of 25.7%. Its expanding ROIC trend signals efficient capital use and deepening competitive advantage, although 2025’s profit pressures warrant monitoring. New product lines and pet nutrition expansion could reinforce this moat in 2026.
Kimberly-Clark Corporation: Diversified Product Portfolio with Margin Pressure
Kimberly-Clark relies on a broad consumer tissue and personal care portfolio, but its moat contrasts with Colgate’s by showing weaker financial durability. Its gross margin at 35.6% and declining ROIC trend suggest eroding capital efficiency. Despite recent revenue declines, margin improvements and geographic diversification hint at potential moat stabilization or redefinition ahead.
Brand Strength vs. Operational Efficiency: The Moat Battle
Colgate commands a wider, more durable moat with superior capital returns and brand power. Kimberly-Clark faces pressure on profitability and efficiency, risking moat erosion. Colgate is better positioned to defend market share and sustain value creation in 2026.
Which stock offers better returns?
The past year shows diverging price movements: Colgate-Palmolive’s shares gain steadily with accelerating momentum, while Kimberly-Clark’s stock declines amid decelerating losses.
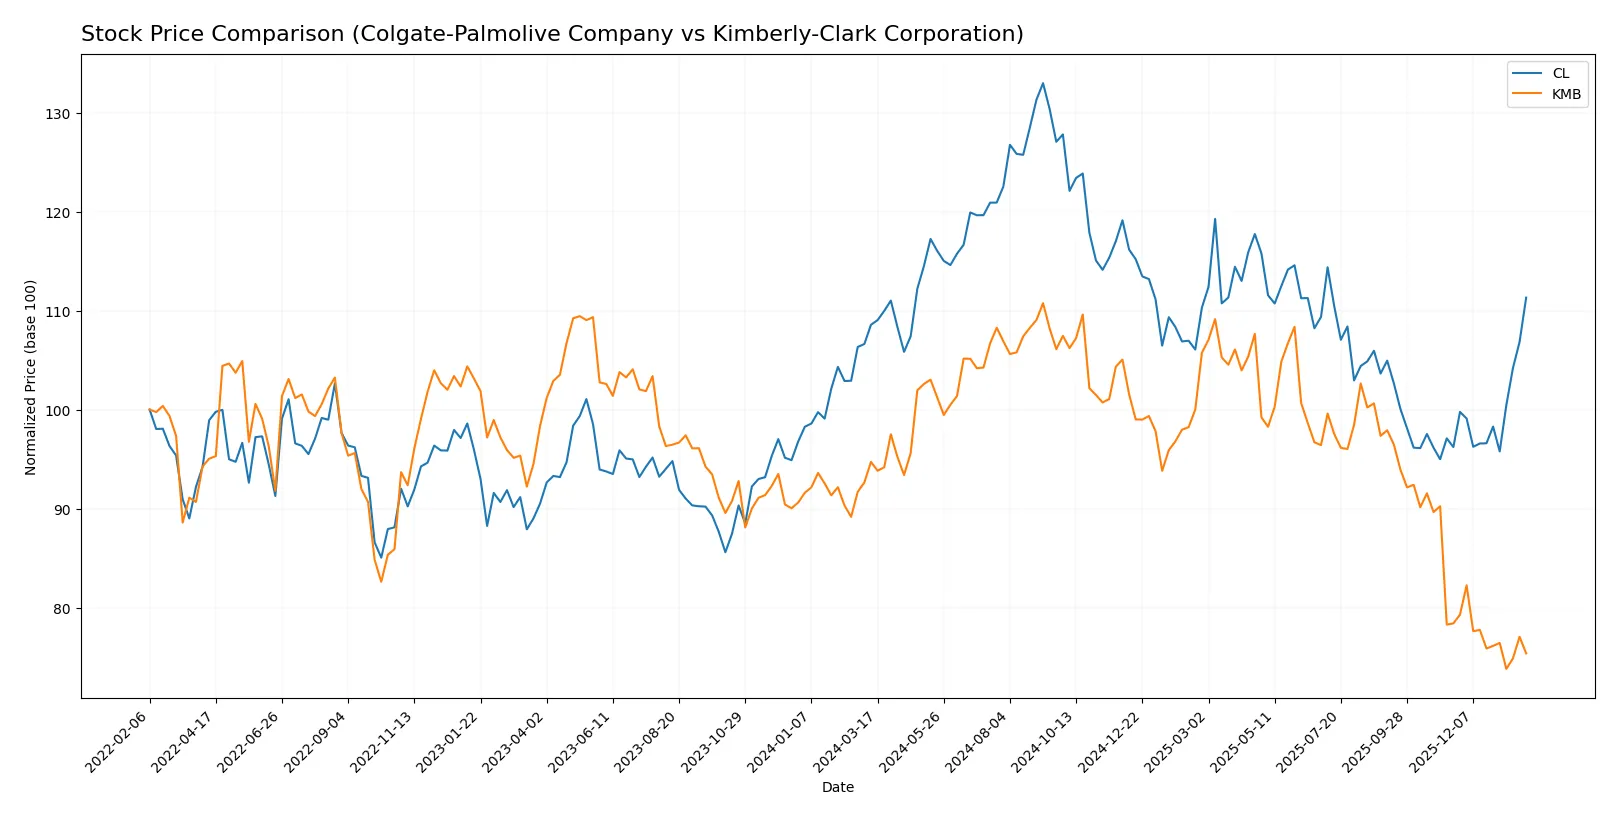
Trend Comparison
Colgate-Palmolive’s stock rose 2.52% over the past 12 months, signaling a bullish trend with price acceleration and moderate volatility (7.34 std deviation). The highest price reached 107.86.
Kimberly-Clark’s shares fell 20.42% over the same period, reflecting a bearish trend with deceleration and higher volatility (12.48 std deviation). The stock hit a low of 97.92.
Comparatively, Colgate-Palmolive outperformed Kimberly-Clark in market returns over one year, showing positive momentum versus Kimberly-Clark’s sustained decline.
Target Prices
Analysts provide a clear consensus on target prices for Colgate-Palmolive and Kimberly-Clark.
| Company | Target Low | Target High | Consensus |
|---|---|---|---|
| Colgate-Palmolive Company | 83 | 96 | 89.2 |
| Kimberly-Clark Corporation | 102 | 162 | 122.38 |
The consensus target for Colgate-Palmolive slightly undercuts its current price of $90.29, indicating modest upside risk. Kimberly-Clark’s target consensus at $122.38 suggests substantial appreciation potential from its $99.99 market price.

Don’t Let Luck Decide Your Entry Point
Optimize your entry points with our advanced ProRealTime indicators. You’ll get efficient buy signals with precise price targets for maximum performance. Start outperforming now!
How do institutions grade them?
The institutional grades for Colgate-Palmolive Company and Kimberly-Clark Corporation are as follows:
Colgate-Palmolive Company Grades
Below is a summary of recent institutional grades for Colgate-Palmolive Company.
| Grading Company | Action | New Grade | Date |
|---|---|---|---|
| JP Morgan | Maintain | Overweight | 2026-01-16 |
| UBS | Maintain | Buy | 2026-01-14 |
| Wells Fargo | Upgrade | Equal Weight | 2026-01-13 |
| TD Cowen | Maintain | Buy | 2026-01-08 |
| Piper Sandler | Upgrade | Overweight | 2026-01-07 |
| JP Morgan | Maintain | Overweight | 2025-12-18 |
| Argus Research | Downgrade | Hold | 2025-12-11 |
| RBC Capital | Upgrade | Outperform | 2025-12-09 |
| Barclays | Maintain | Equal Weight | 2025-11-04 |
| Citigroup | Maintain | Buy | 2025-11-03 |
Kimberly-Clark Corporation Grades
Below is a summary of recent institutional grades for Kimberly-Clark Corporation.
| Grading Company | Action | New Grade | Date |
|---|---|---|---|
| UBS | Maintain | Neutral | 2026-01-28 |
| Citigroup | Maintain | Sell | 2026-01-14 |
| UBS | Maintain | Neutral | 2026-01-14 |
| TD Cowen | Maintain | Hold | 2026-01-08 |
| Wells Fargo | Maintain | Equal Weight | 2026-01-05 |
| Citigroup | Maintain | Sell | 2025-12-17 |
| BNP Paribas Exane | Maintain | Neutral | 2025-12-01 |
| Argus Research | Upgrade | Buy | 2025-11-13 |
| Wells Fargo | Maintain | Equal Weight | 2025-11-04 |
| Evercore ISI Group | Downgrade | In Line | 2025-11-04 |
Which company has the best grades?
Colgate-Palmolive Company consistently receives stronger grades, including multiple Buy and Overweight ratings. Kimberly-Clark’s grades lean more toward Neutral and Sell. This difference suggests a more favorable institutional outlook for Colgate-Palmolive, potentially influencing investor confidence.
Risks specific to each company
The following categories identify the critical pressure points and systemic threats facing both firms in the 2026 market environment:
1. Market & Competition
Colgate-Palmolive Company
- Strong brand portfolio with solid market share but faces pricing pressure in mature markets.
Kimberly-Clark Corporation
- Diverse product lines but struggles with market growth and innovation lag behind peers.
2. Capital Structure & Debt
Colgate-Palmolive Company
- Elevated debt-to-equity ratio (40.15) and debt-to-assets (53.05%) signal leverage risk.
Kimberly-Clark Corporation
- Debt metrics unavailable but rated favorable; suggests conservative leverage or lack of disclosed data.
3. Stock Volatility
Colgate-Palmolive Company
- Low beta (0.28) indicates low volatility, providing stability in turbulent markets.
Kimberly-Clark Corporation
- Similarly low beta (0.28) also reflects defensive stock characteristics with moderate price swings.
4. Regulatory & Legal
Colgate-Palmolive Company
- Operates globally with exposure to consumer product regulations, which can impact costs.
Kimberly-Clark Corporation
- Faces regulatory scrutiny in personal care categories, requiring compliance investments.
5. Supply Chain & Operations
Colgate-Palmolive Company
- Global supply chain exposed to inflationary pressures and raw material cost volatility.
Kimberly-Clark Corporation
- Supply chain disruptions and rising input costs challenge operational efficiency.
6. ESG & Climate Transition
Colgate-Palmolive Company
- Increasing ESG focus with initiatives in sustainability, but transition risks remain.
Kimberly-Clark Corporation
- Stronger ESG disclosures but operational carbon footprint poses medium-term risks.
7. Geopolitical Exposure
Colgate-Palmolive Company
- Significant international exposure, vulnerable to trade tensions and currency fluctuations.
Kimberly-Clark Corporation
- Also globally diversified but less exposure to high-risk emerging markets.
Which company shows a better risk-adjusted profile?
Colgate-Palmolive’s highest risk lies in its elevated leverage, which may constrain flexibility amid rising rates. Kimberly-Clark’s main vulnerability is its operational exposure to supply chain volatility. Both show defensive low stock volatility, but Kimberly-Clark’s cleaner capital structure and strong ESG positioning offer a slightly better risk-adjusted profile. Colgate’s Altman Z-score firmly in the safe zone contrasts with Kimberly-Clark’s grey zone, underscoring my concern about Colgate’s debt levels despite its operational strengths.
Final Verdict: Which stock to choose?
Colgate-Palmolive’s superpower lies in its durable competitive advantage and disciplined capital allocation, delivering consistently high ROIC well above its cost of capital. Its point of vigilance is a stretched liquidity position, which could pressure short-term flexibility. It fits well in portfolios seeking steady, value-driven growth with a margin of safety.
Kimberly-Clark’s strategic moat centers on its strong brand portfolio and robust dividend yield, providing income stability and moderate growth potential. Relative to Colgate, it offers a safer balance sheet but lacks evidence of sustained ROIC growth. It suits investors focused on GARP, blending moderate growth with attractive income.
If you prioritize long-term value creation and resilient profitability, Colgate outshines due to its proven economic moat and accelerating price momentum. However, if you seek income with a defensive tilt, Kimberly-Clark offers better dividend yield and balance-sheet stability despite recent operational headwinds. Both present distinct scenarios aligned to different investor profiles.
Disclaimer: Investment carries a risk of loss of initial capital. The past performance is not a reliable indicator of future results. Be sure to understand risks before making an investment decision.
Go Further
I encourage you to read the complete analyses of Colgate-Palmolive Company and Kimberly-Clark Corporation to enhance your investment decisions: