Home > Comparison > Financial Services > SPGI vs COIN
The strategic rivalry between S&P Global Inc. and Coinbase Global, Inc. shapes the evolution of financial data services. S&P Global, a capital-intensive, diversified financial analytics powerhouse, contrasts sharply with Coinbase, a high-growth, technology-driven crypto marketplace. This head-to-head captures the clash between established market intelligence and innovative digital finance. This analysis will identify which company’s trajectory offers superior risk-adjusted potential for a diversified portfolio amid shifting financial landscapes.
Table of contents
Companies Overview
S&P Global and Coinbase represent pivotal forces shaping financial data and digital asset markets in 2026.
S&P Global Inc.: The Benchmark Authority
S&P Global dominates as a leading provider of credit ratings and market benchmarks. It generates revenue through diverse divisions including Ratings, Dow Jones Indices, and Market Intelligence. In 2026, its strategic focus sharpens on expanding data-driven solutions that empower capital formation and risk management across global markets.
Coinbase Global, Inc.: Crypto’s Infrastructure Backbone
Coinbase stands as a major infrastructure and technology provider in the cryptoeconomy. It earns mainly from transaction fees and services supporting crypto asset trading and developer tools. In 2026, the company prioritizes scaling its marketplace liquidity and enhancing secure crypto payment technologies to solidify its institutional and consumer foothold.
Strategic Collision: Similarities & Divergences
Both firms excel in financial data and infrastructure, but S&P Global operates a broad, traditional market ecosystem while Coinbase champions decentralized crypto markets. Their primary battleground is market data and transaction processing, with S&P focusing on legacy capital markets and Coinbase on digital assets. This divergence creates distinct investment profiles: established stability versus high-growth innovation.
Income Statement Comparison
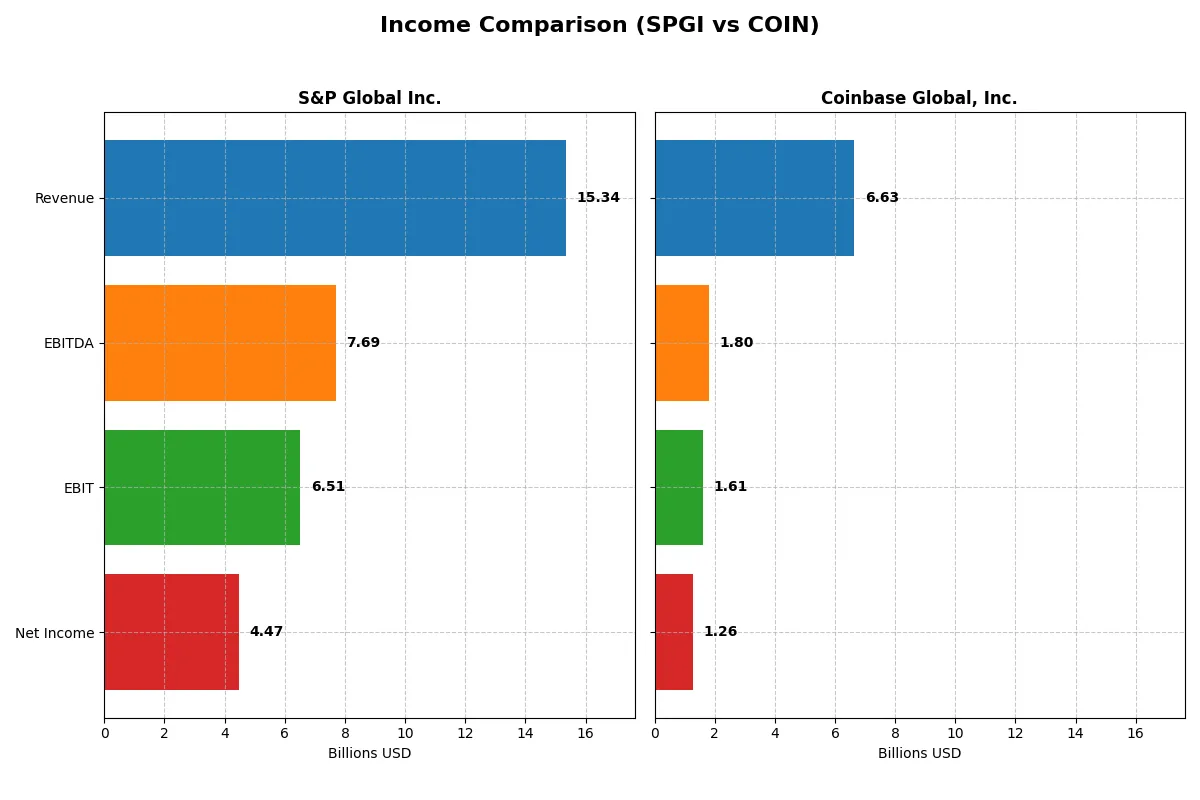
The following data dissects the core profitability and scalability of both corporate engines to reveal who dominates the bottom line:
| Metric | S&P Global Inc. (SPGI) | Coinbase Global, Inc. (COIN) |
|---|---|---|
| Revenue | 15.3B | 6.6B |
| Cost of Revenue | 9.2B | 1.2B |
| Operating Expenses | 0 | 4.5B |
| Gross Profit | 6.2B | 5.4B |
| EBITDA | 7.7B | 1.8B |
| EBIT | 6.5B | 1.6B |
| Interest Expense | 287M | 85M |
| Net Income | 4.5B | 1.3B |
| EPS | 14.67 | 4.85 |
| Fiscal Year | 2025 | 2025 |
Income Statement Analysis: The Bottom-Line Duel
This income statement comparison uncovers which company runs a more efficient and profitable business engine through recent performance metrics.
S&P Global Inc. Analysis
S&P Global’s revenue climbed steadily from 8.3B in 2021 to 15.3B in 2025, alongside net income growth from 3B to 4.5B. Its gross margin remains robust around 40%, while net margin improved to 29% in 2025. The company shows strong momentum, with EBIT growing 16% year-over-year and EPS up 19%, signaling efficient cost control and profitability.
Coinbase Global, Inc. Analysis
Coinbase’s revenue peaked at 7.8B in 2021 but declined to 6.6B by 2025, with net income falling sharply from 3.6B to 1.3B. Despite a high gross margin near 82%, net margin compressed to 19%, reflecting rising expenses. The latest year saw a nearly 47% EBIT decline and a 53% drop in EPS, indicating weakening operational efficiency and profit pressure.
Verdict: Sustainable Growth vs. Profitability Challenges
S&P Global dominates with consistent revenue and net income growth, supported by stable margins and improving earnings quality. Coinbase struggles with declining top-line and bottom-line results, despite strong gross profitability. For investors, S&P Global’s profile offers more reliable, margin-driven returns, while Coinbase faces significant operational headwinds.
Financial Ratios Comparison
These vital ratios act as a diagnostic tool to expose the underlying fiscal health, valuation premiums, and capital efficiency of the companies compared:
| Ratios | S&P Global Inc. (SPGI) | Coinbase Global, Inc. (COIN) |
|---|---|---|
| ROE | 14.3% | 8.5% |
| ROIC | 9.2% | 2.5% |
| P/E | 35.6 | 46.7 |
| P/B | 5.1 | 4.0 |
| Current Ratio | 0.82 | 7.89 |
| Quick Ratio | 0.82 | 7.89 |
| D/E | 0.43 | 0.52 |
| Debt-to-Assets | 22.2% | 25.8% |
| Interest Coverage | 22.6 | 10.6 |
| Asset Turnover | 0.25 | 0.22 |
| Fixed Asset Turnover | 55.2 | 0 |
| Payout ratio | 26.2% | 0% |
| Dividend yield | 0.73% | 0% |
| Fiscal Year | 2025 | 2025 |
Efficiency & Valuation Duel: The Vital Signs
Ratios act as a company’s DNA, exposing hidden risks and operational strengths that numbers alone cannot reveal.
S&P Global Inc.
S&P Global shows strong profitability with a 29.15% net margin and a neutral 14.31% ROE. Its valuation is stretched, with a P/E of 35.63 and P/B of 5.1, signaling a premium price. Dividend yield is low at 0.73%, indicating modest shareholder returns amid reinvestment in intangibles.
Coinbase Global, Inc.
Coinbase posts a decent net margin of 19% but weaker profitability metrics, including an 8.52% ROE and 2.53% ROIC. Its valuation is expensive, with a P/E at 46.67 and P/B of 3.98. The company pays no dividend, focusing on R&D and growth investments, reflected in high SG&A and R&D expenses.
Premium Valuation vs. Operational Safety
S&P Global balances profitability with a stretched valuation and modest shareholder returns, while Coinbase carries higher valuation risk and weaker returns. Investors seeking stability may prefer S&P’s profile; those chasing growth might tolerate Coinbase’s riskier, reinvestment-heavy model.
Which one offers the Superior Shareholder Reward?
I compare S&P Global Inc. (SPGI) and Coinbase Global, Inc. (COIN) on distributions. SPGI yields ~0.73% with a payout ratio near 29%, backed by strong free cash flow (~18/share). It maintains disciplined buybacks, enhancing total return sustainably. COIN pays no dividend, reinvesting all FCF (~9/share) into growth and acquisitions. Its buyback activity is moderate but less consistent. SPGI’s model offers steady income and capital return, while COIN bets on growth with higher volatility. For 2026, I find SPGI’s balanced distribution and cash flow coverage deliver a more attractive, sustainable total shareholder reward.
Comparative Score Analysis: The Strategic Profile
The radar chart reveals the fundamental DNA and trade-offs of S&P Global Inc. and Coinbase Global, Inc., illustrating their financial strengths and vulnerabilities:
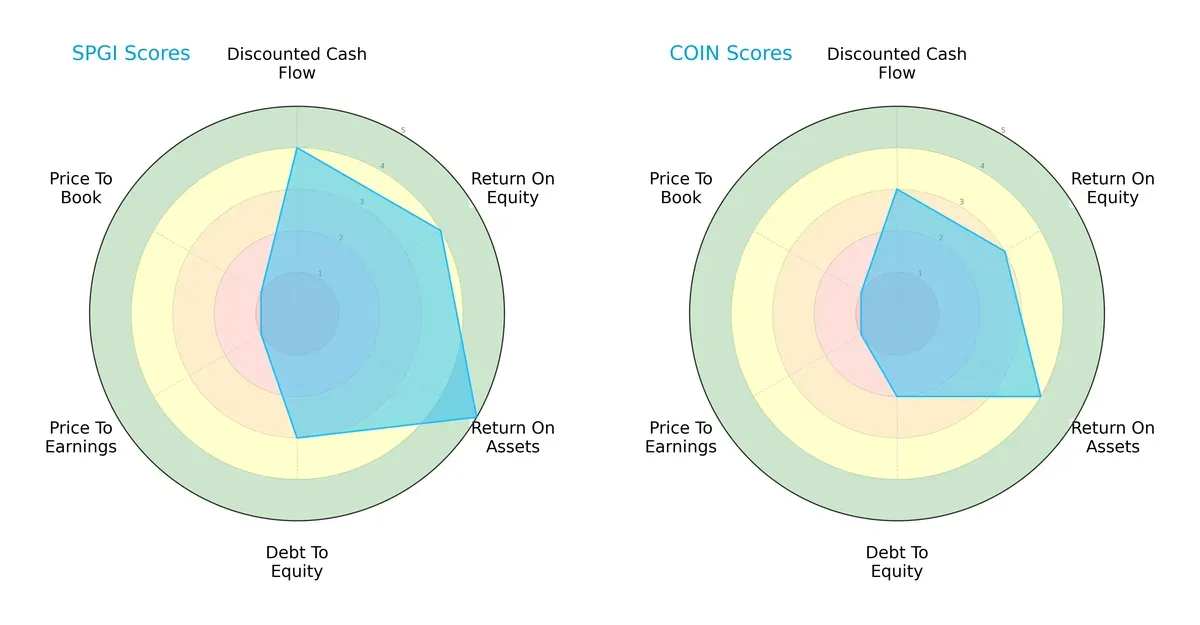
S&P Global shows a more balanced profile with top-tier ROA (5) and solid ROE (4), paired with moderate debt management (3). Coinbase leans on reasonable asset efficiency (4) but trails in debt control (2) and overall scores (2 vs. 3). Both firms suffer from very unfavorable valuation metrics (P/E and P/B at 1), signaling market skepticism or overvaluation risks.
Bankruptcy Risk: Solvency Showdown
S&P Global’s Altman Z-Score of 4.01 places it securely in the safe zone, while Coinbase’s 2.97 sits in the grey zone, indicating higher risk:
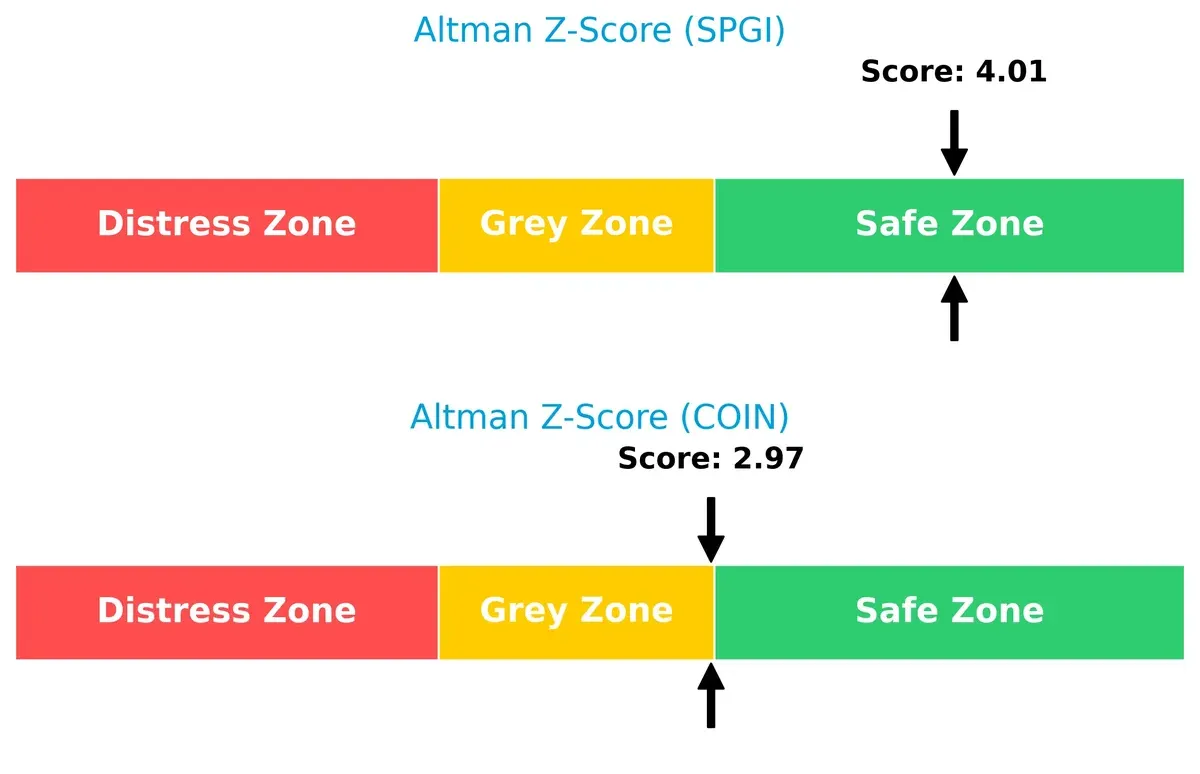
This gap suggests S&P Global offers stronger long-term survival prospects amid economic cycles. Coinbase faces moderate financial distress signals, warranting caution for risk-averse investors.
Financial Health: Quality of Operations
S&P Global’s Piotroski F-Score of 7 reflects strong operational quality, outperforming Coinbase’s average score of 5:
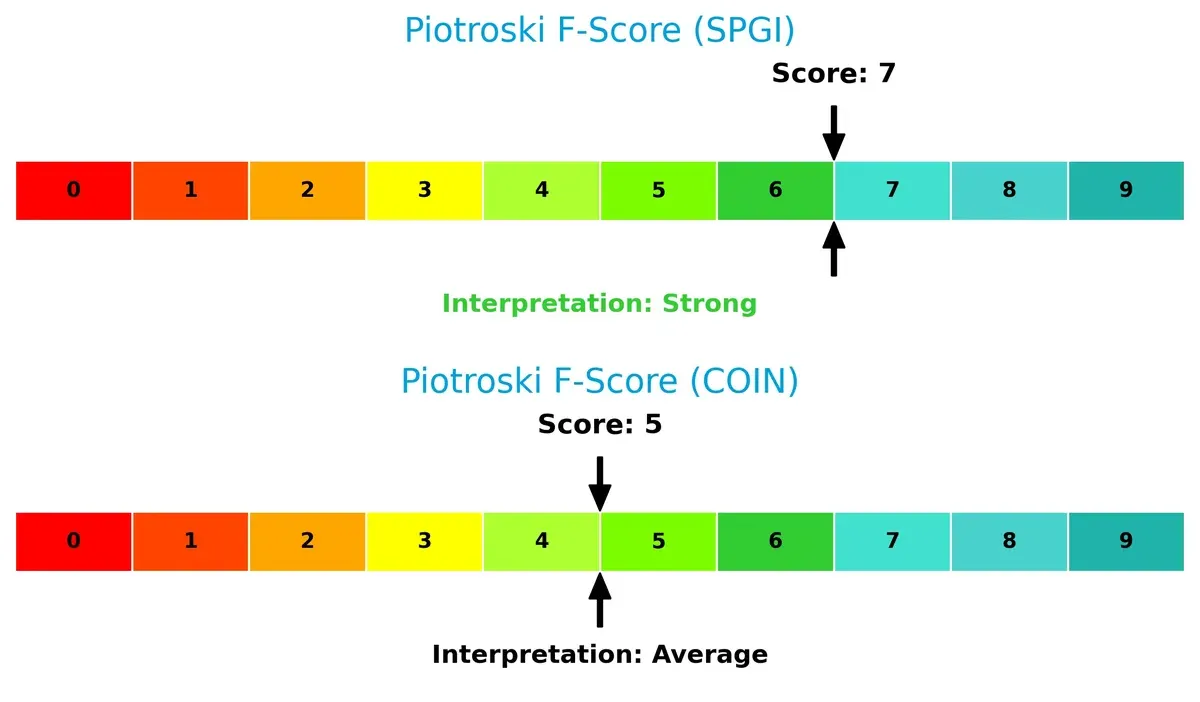
I see S&P Global as the financially healthier firm with fewer red flags in profitability and liquidity. Coinbase’s middling score suggests it must improve internal metrics to solidify investor confidence.
How are the two companies positioned?
This section dissects the operational DNA of S&P Global and Coinbase by comparing their revenue distribution and internal dynamics. The final goal is to confront their economic moats and reveal which business model offers the most resilient competitive advantage today.
Revenue Segmentation: The Strategic Mix
This visual comparison dissects how S&P Global Inc. and Coinbase Global diversify their income streams and reveals their primary sector bets:
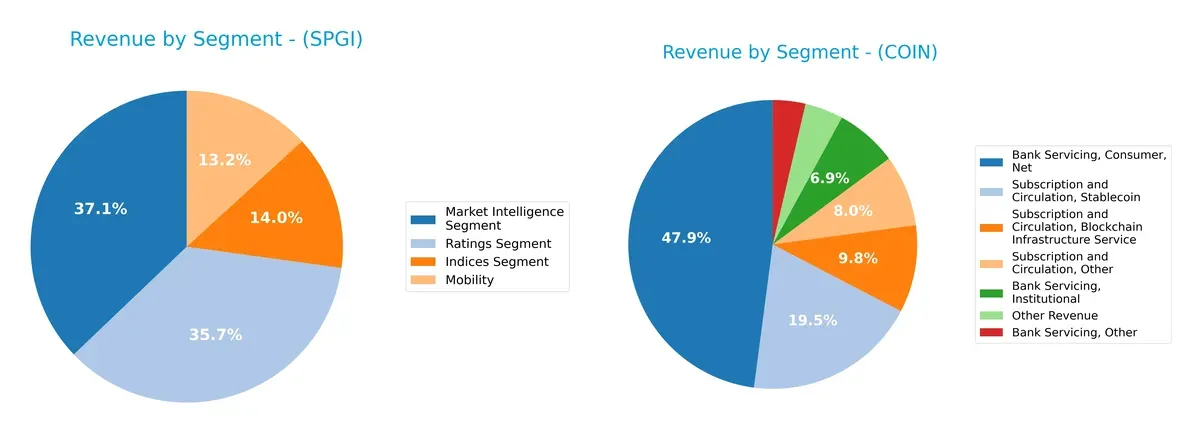
S&P Global anchors revenue across four sizable segments: Market Intelligence at $4.9B, Ratings at $4.7B, Indices at $1.85B, and Mobility at $1.75B. This diversified mix reduces concentration risk and reinforces ecosystem lock-in. Coinbase, by contrast, pivots heavily on Bank Servicing, Consumer at $3.3B, dwarfing other segments like Stablecoin subscriptions at $1.35B. This signals higher dependence on a single dominant stream, exposing it to regulatory and market volatility risks.
Strengths and Weaknesses Comparison
This table compares the strengths and weaknesses of S&P Global Inc. and Coinbase Global, Inc.:
S&P Global Inc. Strengths
- Diverse revenue streams across indices, ratings, intelligence, and mobility segments
- Strong net margin at 29.15%
- Favorable debt metrics and high interest coverage
- Solid global presence with significant US, Europe, and Asia exposure
Coinbase Global, Inc. Strengths
- Favorable net margin at 19.0%
- Strong quick ratio at 7.89 indicates liquidity
- Favorable debt to assets and interest coverage
- Concentrated US market with expanding global revenue
S&P Global Inc. Weaknesses
- Unfavorable valuation multiples (PE 35.63, PB 5.1)
- Low current ratio at 0.82 signals liquidity risk
- Moderate asset turnover at 0.25
- Dividend yield below 1%
Coinbase Global, Inc. Weaknesses
- Unfavorable ROE and ROIC well below WACC
- High WACC at 18.5% raises capital cost concerns
- Unfavorable valuation multiples (PE 46.67, PB 3.98)
- Extremely high current ratio at 7.89 may indicate inefficient asset use
- Zero dividend yield
Both companies show strengths in profitability and debt management but face distinct challenges. S&P boasts a broad geographic and product diversification, while Coinbase’s liquidity and capital efficiency metrics raise caution for sustainable growth.
The Moat Duel: Analyzing Competitive Defensibility
A structural moat alone protects long-term profits from relentless competition erosion. Let’s examine how S&P Global and Coinbase defend their market positions:
S&P Global Inc.: Intangible Assets and Data Dominance
S&P Global’s moat stems from its proprietary data and analytics platforms, driving robust margin stability and a 29% net margin. However, its declining ROIC signals challenges to sustaining this advantage in 2026 amidst evolving market demands.
Coinbase Global, Inc.: Network Effects in Crypto Infrastructure
Coinbase leverages strong network effects as a crypto marketplace, but its steep ROIC decline and shrinking margins indicate a fragile moat. Future growth hinges on expanding beyond volatile crypto markets to stabilize returns.
Intangible Assets vs. Network Effects: The Moat Showdown
S&P Global’s intangible asset moat is wider, underpinning stable profitability despite headwinds. Coinbase’s network effect moat appears weaker and less durable due to market volatility. S&P Global is better positioned to defend and grow its market share long term.
Which stock offers better returns?
The past year shows both S&P Global Inc. and Coinbase Global, Inc. facing significant price declines, with marked deceleration and shifting trading dynamics in recent months.
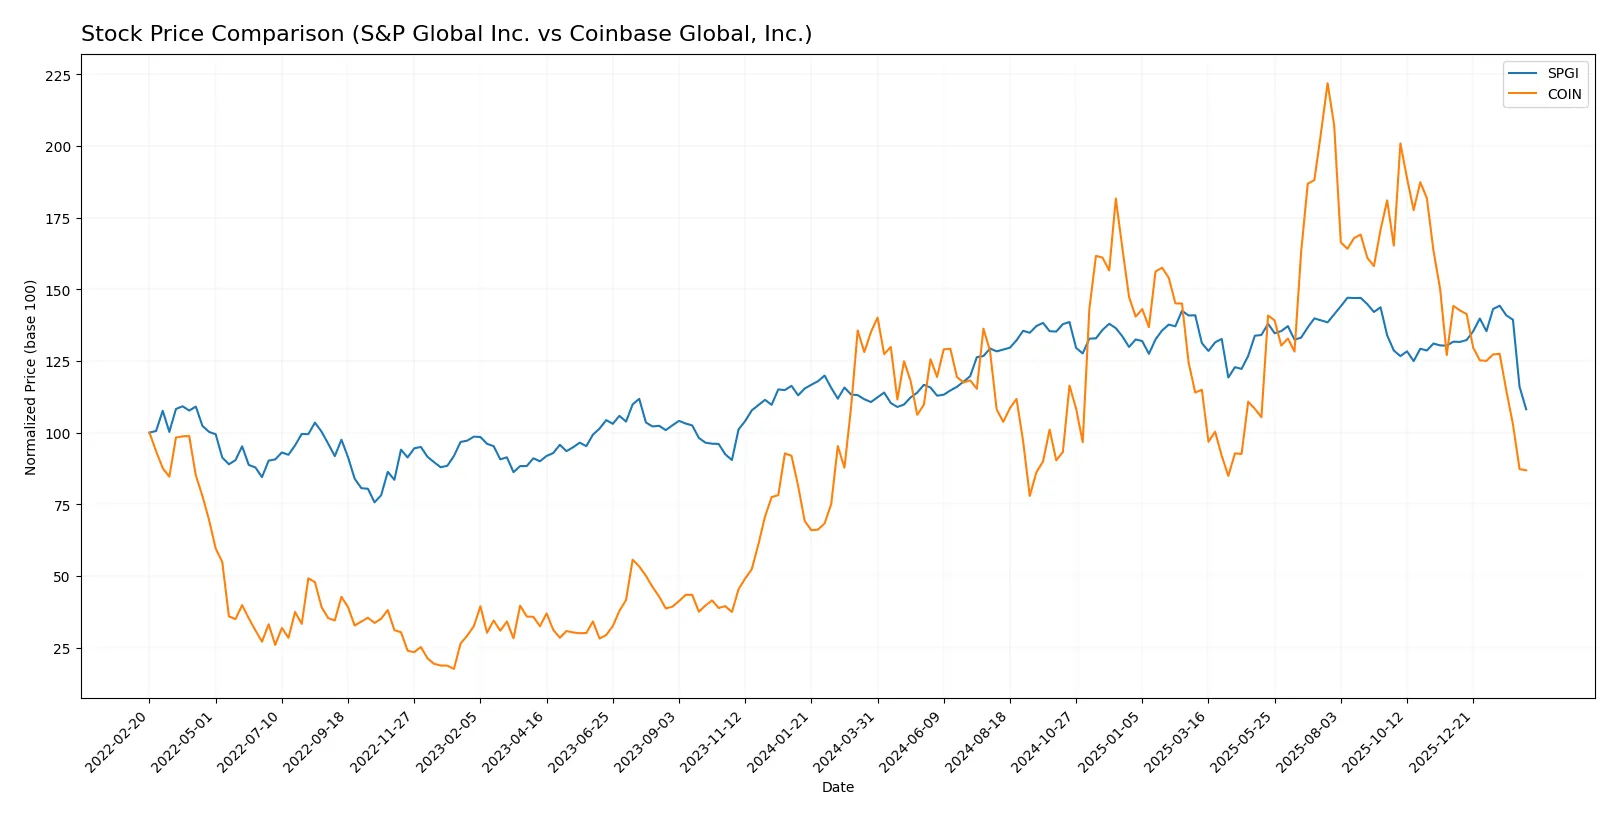
Trend Comparison
S&P Global Inc. exhibits a bearish trend over 12 months with a -2.29% price change, decelerating and ranging between 409.54 and 556.87, indicating moderate volatility with a 36.86 std deviation.
Coinbase Global, Inc. also shows a bearish trend, with a sharper -35.69% price decline over the same period. Its volatility is higher, with a 59.61 std deviation and a wider price range from 147.35 to 419.78.
Coinbase underperforms S&P Global, Inc., delivering the lowest market performance and greater downside risk across the past year.
Target Prices
Analysts present a clear consensus on target prices for S&P Global Inc. and Coinbase Global, Inc.
| Company | Target Low | Target High | Consensus |
|---|---|---|---|
| S&P Global Inc. | 482 | 627 | 544.75 |
| Coinbase Global, Inc. | 120 | 440 | 280.67 |
The target consensus for S&P Global at 545 significantly exceeds its current price of 410, indicating strong growth expectations. Coinbase’s consensus target near 281 also suggests substantial upside from its current 164 price, reflecting bullish analyst sentiment despite crypto market volatility.

Don’t Let Luck Decide Your Entry Point
Optimize your entry points with our advanced ProRealTime indicators. You’ll get efficient buy signals with precise price targets for maximum performance. Start outperforming now!
How do institutions grade them?
S&P Global Inc. Grades
The following table summarizes recent institutional grades for S&P Global Inc.:
| Grading Company | Action | New Grade | Date |
|---|---|---|---|
| BMO Capital | Maintain | Outperform | 2026-02-12 |
| Mizuho | Maintain | Outperform | 2026-02-12 |
| Stifel | Maintain | Buy | 2026-02-11 |
| Evercore ISI Group | Maintain | Outperform | 2026-02-11 |
| RBC Capital | Maintain | Outperform | 2026-02-11 |
| Goldman Sachs | Maintain | Buy | 2026-02-11 |
| Wells Fargo | Maintain | Overweight | 2026-02-11 |
| Goldman Sachs | Maintain | Buy | 2026-02-09 |
| Morgan Stanley | Maintain | Overweight | 2026-01-13 |
| Evercore ISI Group | Maintain | Outperform | 2026-01-08 |
Coinbase Global, Inc. Grades
The following table summarizes recent institutional grades for Coinbase Global, Inc.:
| Grading Company | Action | New Grade | Date |
|---|---|---|---|
| Barclays | Maintain | Equal Weight | 2026-02-13 |
| Piper Sandler | Maintain | Neutral | 2026-02-13 |
| BTIG | Maintain | Buy | 2026-02-13 |
| Benchmark | Maintain | Buy | 2026-02-13 |
| Canaccord Genuity | Maintain | Buy | 2026-02-13 |
| Rosenblatt | Maintain | Buy | 2026-02-13 |
| Needham | Maintain | Buy | 2026-02-13 |
| HC Wainwright & Co. | Maintain | Buy | 2026-02-11 |
| JP Morgan | Maintain | Overweight | 2026-02-10 |
| Citigroup | Maintain | Buy | 2026-02-09 |
Which company has the best grades?
S&P Global Inc. receives consistently high grades such as Outperform and Buy from multiple top-tier firms. Coinbase shows a mix of Buy and Neutral ratings, with several Buy endorsements. S&P Global’s stronger consensus could signal greater institutional confidence, potentially influencing investor perception positively.
Risks specific to each company
The following categories identify the critical pressure points and systemic threats facing both firms in the 2026 market environment:
1. Market & Competition
S&P Global Inc.
- Established leader with diversified data and analytics offerings, facing steady competition from niche and broad financial data providers.
Coinbase Global, Inc.
- Faces intense competition from emerging crypto platforms and traditional financial firms entering digital assets, with high market volatility.
2. Capital Structure & Debt
S&P Global Inc.
- Low debt-to-equity ratio (0.43) and strong interest coverage (22.7) indicate prudent leverage management.
Coinbase Global, Inc.
- Moderate debt-to-equity (0.52) with lower interest coverage (18.8); higher WACC (18.5%) signals costlier capital and financial risk.
3. Stock Volatility
S&P Global Inc.
- Beta of 1.2 suggests moderate volatility aligned with financial sector norms.
Coinbase Global, Inc.
- High beta of 3.7 reflects extreme price swings linked to crypto market turbulence.
4. Regulatory & Legal
S&P Global Inc.
- Operates in a regulated environment with established compliance frameworks; risks mainly relate to rating and data standards changes.
Coinbase Global, Inc.
- Faces significant regulatory uncertainty globally due to evolving crypto laws, exposing it to potential fines and operational constraints.
5. Supply Chain & Operations
S&P Global Inc.
- Robust operational infrastructure with diversified divisions mitigates operational risks.
Coinbase Global, Inc.
- Operational dependence on crypto infrastructure and technology platforms creates vulnerability to cyber threats and technology disruptions.
6. ESG & Climate Transition
S&P Global Inc.
- Active ESG data provider; integrates sustainability into analytics, positioning well for climate transition demands.
Coinbase Global, Inc.
- ESG initiatives less mature; crypto mining’s environmental impact poses reputational and regulatory risks.
7. Geopolitical Exposure
S&P Global Inc.
- Global footprint with exposure to multiple regions but benefits from diversified revenue streams.
Coinbase Global, Inc.
- High exposure to regulatory shifts in key markets like the US and EU; geopolitical tensions could restrict crypto operations.
Which company shows a better risk-adjusted profile?
S&P Global’s most impactful risk is its elevated valuation multiples, which could pressure returns. Coinbase faces extreme volatility and regulatory uncertainty as its primary risks. S&P Global’s strong balance sheet and diversified business offer a more stable risk-adjusted profile. Coinbase’s risk profile remains unfavorable due to regulatory and market instability, despite recent strong price momentum.
Final Verdict: Which stock to choose?
S&P Global Inc. (SPGI) stands out as a cash-generating powerhouse with stable profitability and a well-established market presence. Its main point of vigilance is the slightly weak liquidity position, which could pressure short-term flexibility. SPGI fits portfolios seeking steady income combined with moderate growth.
Coinbase Global, Inc. (COIN) offers a strategic moat rooted in its position as a leader in the digital asset exchange space, supported by strong liquidity and innovation-driven growth. It presents higher volatility and risk compared to SPGI. COIN might suit investors looking for growth at a reasonable price with a tolerance for cyclicality.
If you prioritize resilient cash flow and consistent profitability, SPGI is the compelling choice due to its established business model and relative financial stability. However, if you seek exposure to disruptive fintech innovation and can weather higher volatility, COIN offers superior growth potential despite its weaker profitability metrics.
Disclaimer: Investment carries a risk of loss of initial capital. The past performance is not a reliable indicator of future results. Be sure to understand risks before making an investment decision.
Go Further
I encourage you to read the complete analyses of S&P Global Inc. and Coinbase Global, Inc. to enhance your investment decisions: