Home > Comparison > Financial Services > COIN vs NDAQ
The strategic rivalry between Coinbase Global, Inc. and Nasdaq, Inc. shapes the evolution of the financial data and stock exchange sector. Coinbase operates as a pioneering cryptoeconomy infrastructure provider, while Nasdaq commands a diversified technology-driven marketplace across traditional and digital assets. This head-to-head pits innovative growth against established market breadth. This analysis aims to identify which corporate trajectory offers superior risk-adjusted returns for a diversified investor portfolio in 2026.

Table of contents
Companies Overview
Coinbase Global and Nasdaq dominate the financial market infrastructure with distinct approaches to trading and technology.
Coinbase Global, Inc.: Crypto Financial Infrastructure Leader
Coinbase operates as a primary financial account provider in the cryptoeconomy, serving both consumers and institutions. Its core revenue stems from transaction fees on its crypto asset marketplace and services enabling crypto-based payments. In 2026, Coinbase strategically focuses on expanding its technology platform to support broader developer adoption and institutional liquidity pools.
Nasdaq, Inc.: Diversified Market Technology Powerhouse
Nasdaq functions as a technology provider for capital markets, offering exchange platforms, market surveillance SaaS, and data analytics. It generates revenue through listing fees, trading services, and analytics solutions across multiple asset classes. In 2026, Nasdaq emphasizes enhancing its anti-financial crime technology and expanding its corporate platforms to deepen market intelligence offerings.
Strategic Collision: Similarities & Divergences
Both companies operate in financial market infrastructure but diverge sharply in focus: Coinbase champions a crypto-centric, open marketplace, while Nasdaq pursues a multi-asset, regulated exchange ecosystem. Their primary battleground lies in attracting institutional traders and developers seeking secure, efficient transaction venues. Coinbase’s growth hinges on crypto innovation, whereas Nasdaq offers stability through diversified services and regulatory compliance.
Income Statement Comparison
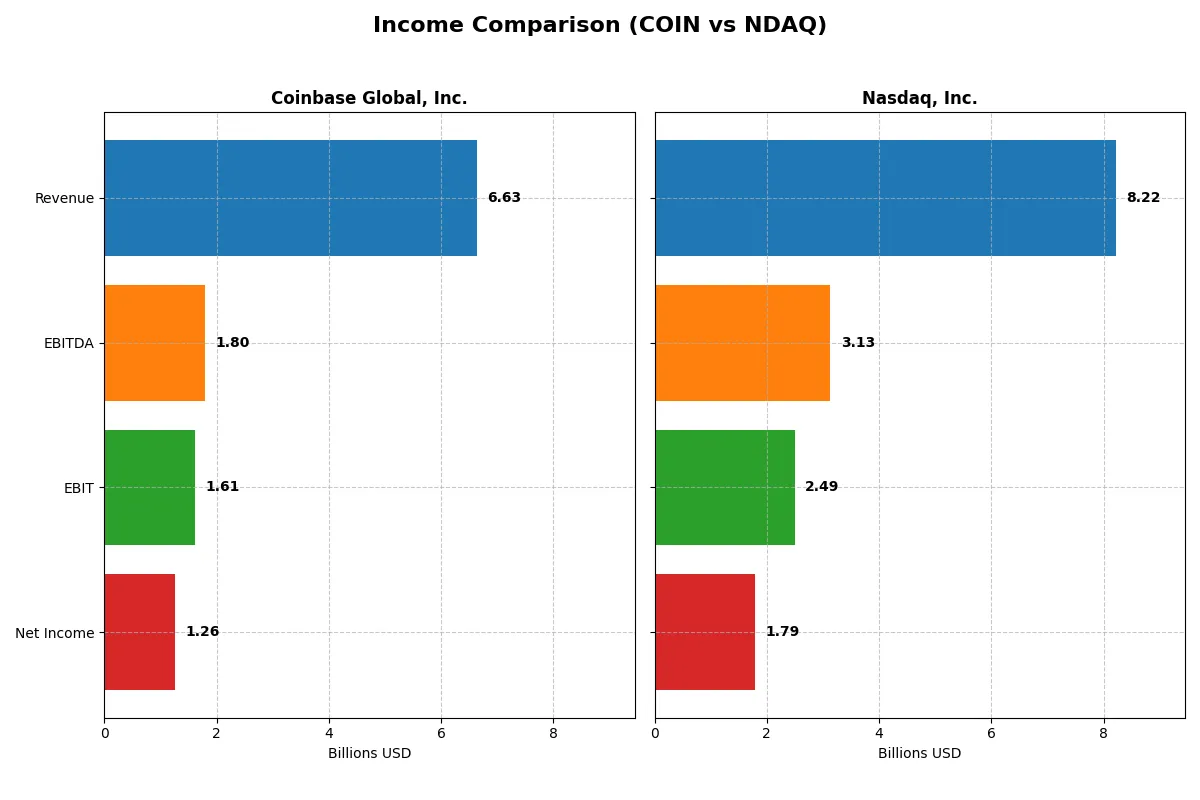
This data dissects the core profitability and scalability of both corporate engines to reveal who dominates the bottom line:
| Metric | Coinbase Global, Inc. (COIN) | Nasdaq, Inc. (NDAQ) |
|---|---|---|
| Revenue | 6.63B | 8.22B |
| Cost of Revenue | 1.21B | 4.28B |
| Operating Expenses | 4.52B | 1.61B |
| Gross Profit | 5.42B | 3.94B |
| EBITDA | 1.80B | 3.13B |
| EBIT | 1.61B | 2.49B |
| Interest Expense | 85.4M | 88.0M |
| Net Income | 1.26B | 1.79B |
| EPS | 4.85 | 3.13 |
| Fiscal Year | 2025 | 2025 |
Income Statement Analysis: The Bottom-Line Duel
This income statement comparison reveals which company manages its revenue and expenses most efficiently to generate sustainable profit.
Coinbase Global, Inc. Analysis
Coinbase’s revenue showed a modest 1% increase in 2025 to 6.6B, but net income halved to 1.26B, reflecting sharp margin compression. Its gross margin remains strong at 81.8%, yet EBIT and net margin dropped significantly, signaling weakening operational efficiency and profit momentum in the latest year.
Nasdaq, Inc. Analysis
Nasdaq posted robust 11% revenue growth to 8.2B in 2025, with net income rising 60% to 1.79B. Despite a lower gross margin of 47.9%, Nasdaq’s EBIT margin improved to 30.4%, driven by disciplined cost control and strong operating leverage, reflecting solid profit expansion and improving margins.
Margin Strength vs. Growth Momentum
Nasdaq outperforms Coinbase with superior revenue and net income growth, alongside expanding margins. Coinbase’s high gross margin is undermined by declining EBIT and net income, indicating eroding profitability. For investors, Nasdaq’s consistent margin improvement and top-line momentum present a more compelling fundamental profile.
Financial Ratios Comparison
These vital ratios act as a diagnostic tool to expose the underlying fiscal health, valuation premiums, and capital efficiency of the companies compared below:
| Ratios | Coinbase Global, Inc. (COIN) | Nasdaq, Inc. (NDAQ) |
|---|---|---|
| ROE | 8.5% | 14.6% |
| ROIC | 2.5% | 8.3% |
| P/E | 46.7 | 31.0 |
| P/B | 4.0 | 4.5 |
| Current Ratio | 7.9 | 1.0 |
| Quick Ratio | 7.9 | 1.0 |
| D/E | 0.52 | 0.81 |
| Debt-to-Assets | 25.8% | 32.0% |
| Interest Coverage | 10.6 | 26.5 |
| Asset Turnover | 0.22 | 0.26 |
| Fixed Asset Turnover | 0 | 7.0 |
| Payout ratio | 0 | 33.6% |
| Dividend yield | 0 | 1.08% |
| Fiscal Year | 2025 | 2025 |
Efficiency & Valuation Duel: The Vital Signs
Financial ratios act as a company’s DNA, uncovering hidden operational strengths and potential risks to guide informed investment decisions.
Coinbase Global, Inc.
Coinbase posts a modest ROE of 8.52% with a healthy net margin of 19%, signaling decent profitability but low capital efficiency. Its P/E ratio of 46.67 suggests an expensive valuation relative to earnings. The stock lacks dividends, instead reinvesting heavily in R&D at 25% of revenue, aiming for growth amid stretched liquidity indicated by a high current ratio of 7.89.
Nasdaq, Inc.
Nasdaq delivers a stronger ROE of 14.63% and a higher net margin at 21.77%, showing more efficient capital use and profitability. Its P/E of 30.98 is still elevated but more reasonable than Coinbase’s. Nasdaq offers a modest 1.08% dividend yield, balancing shareholder returns with steady operational efficiency, supported by a quick ratio near 1.0 and robust fixed asset turnover of 6.99.
Premium Valuation vs. Operational Safety
Nasdaq exhibits a better balance of risk and reward with superior profitability, reasonable valuation, and consistent dividends. Coinbase’s high valuation and reinvestment bet carry more risk. Nasdaq suits investors prioritizing operational safety and income, while Coinbase fits those seeking aggressive growth exposure.
Which one offers the Superior Shareholder Reward?
I see Coinbase (COIN) reinvests all free cash flow into growth, with no dividends and no buybacks in 2025, reflecting a high P/E of 47 and strong margins but no direct payouts. Nasdaq (NDAQ) pays a steady dividend yield around 1.1%, with a 33-48% payout ratio and consistent buybacks fueling a total shareholder return. Nasdaq’s balanced distribution approach offers more sustainable, tangible shareholder rewards in 2026 than Coinbase’s growth-only model.
Comparative Score Analysis: The Strategic Profile
The radar chart reveals the fundamental DNA and trade-offs of Coinbase Global, Inc. and Nasdaq, Inc., highlighting their core financial strengths and vulnerabilities:
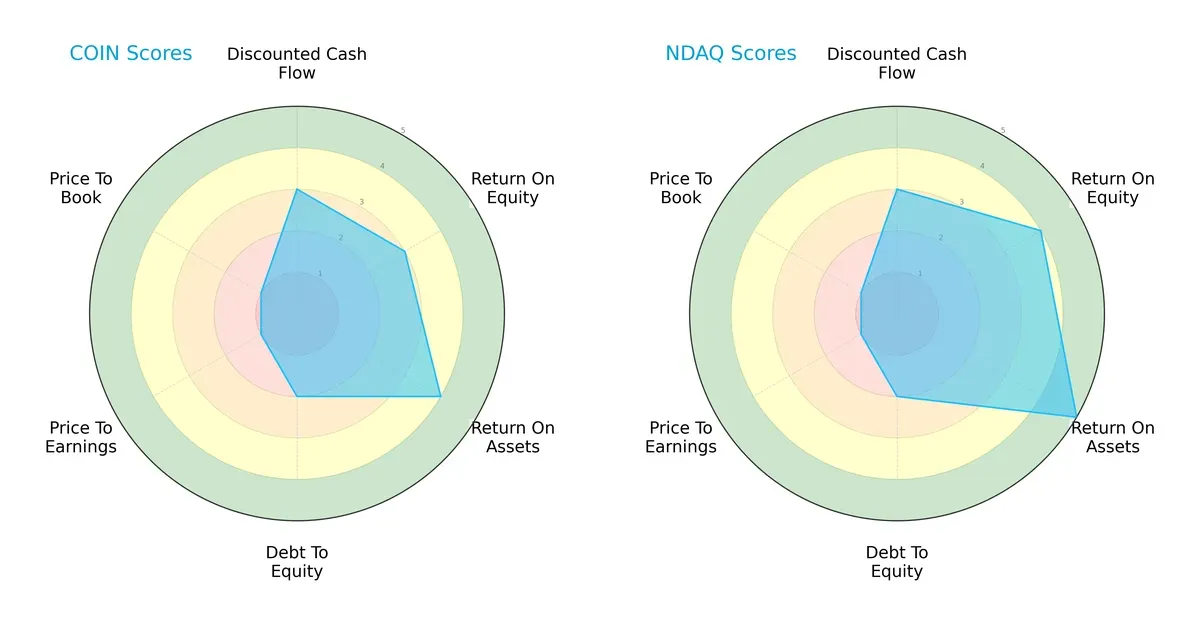
Nasdaq leads with a more balanced profile, excelling in ROE (4 vs. 3) and ROA (5 vs. 4), signaling superior asset efficiency and profitability. Both firms share moderate DCF scores (3), but Coinbase lags with weaker overall (2) and debt-to-equity (2) scores, indicating higher financial risk. Valuation metrics (PE/PB) are equally unfavorable for both, reflecting market skepticism. Nasdaq’s edge lies in operational efficiency; Coinbase relies more on asset utilization despite leverage concerns.
Bankruptcy Risk: Solvency Showdown
Coinbase’s Altman Z-Score of 2.97 slightly outperforms Nasdaq’s 2.41, placing both in the grey zone with moderate bankruptcy risk in this cycle:
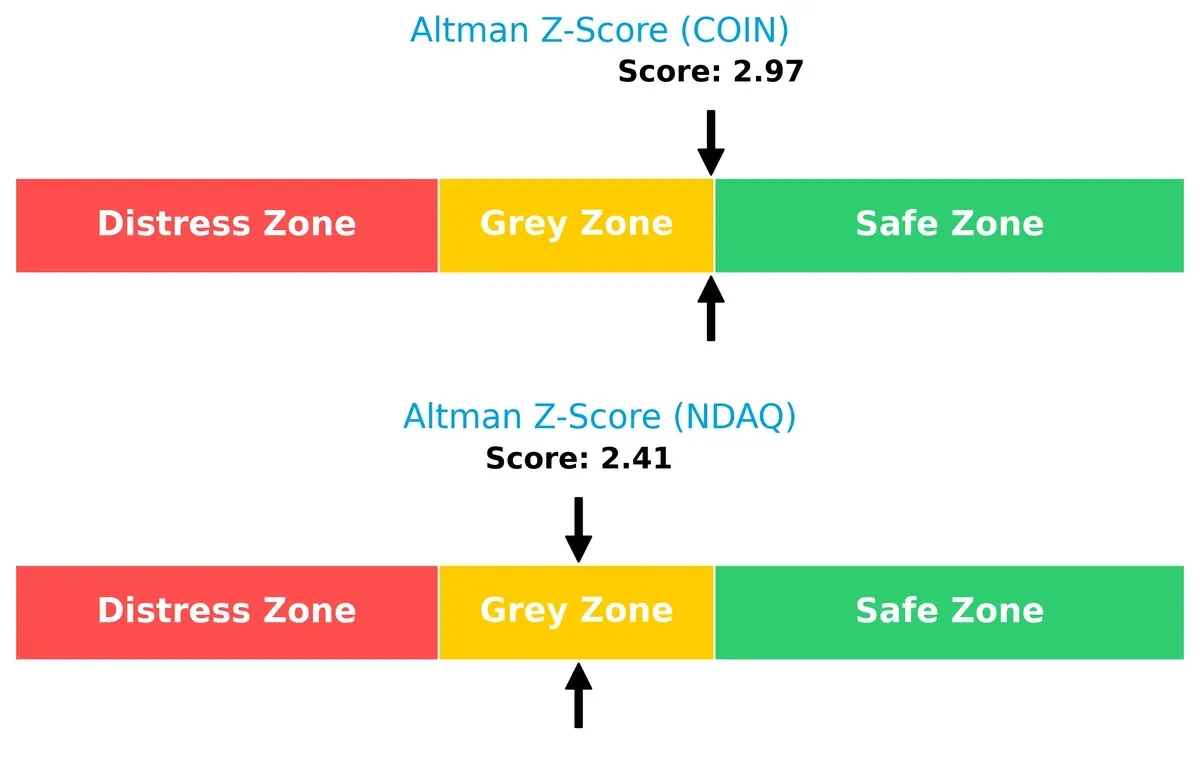
This suggests Coinbase maintains marginally better solvency buffers despite Nasdaq’s operational strength. Investors should monitor liquidity closely as both firms hover near financial caution thresholds.
Financial Health: Quality of Operations
Nasdaq’s Piotroski F-Score of 9 signals peak financial health, sharply contrasting Coinbase’s average score of 5, which raises internal red flags:
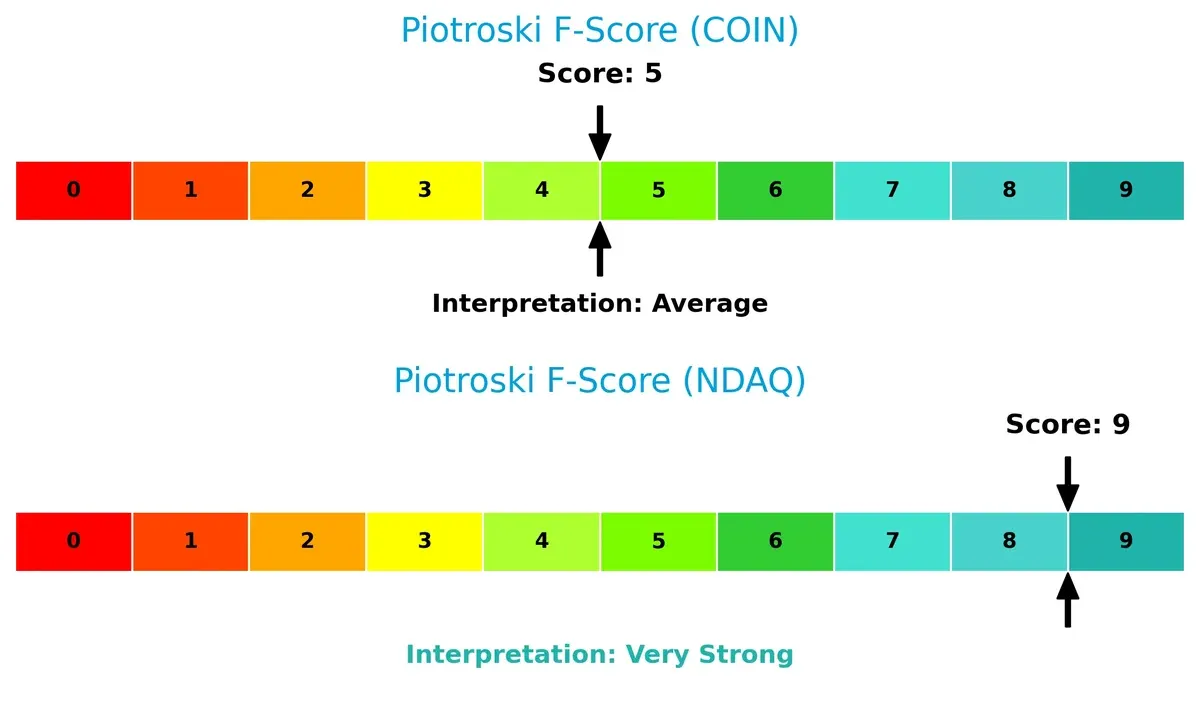
Nasdaq demonstrates superior profitability, leverage, and operational efficiency, while Coinbase’s middling score suggests weaker fundamentals and potential issues in financial quality. This gap underscores Nasdaq’s stronger internal metrics and resilience.
How are the two companies positioned?
This section dissects the operational DNA of Coinbase and Nasdaq by comparing their revenue distribution across segments and analyzing internal strengths and weaknesses. The goal is to confront their economic moats to reveal which model delivers the most resilient competitive advantage today.
Revenue Segmentation: The Strategic Mix
This visual comparison dissects how Coinbase Global, Inc. and Nasdaq, Inc. diversify their income streams and where their primary sector bets lie:
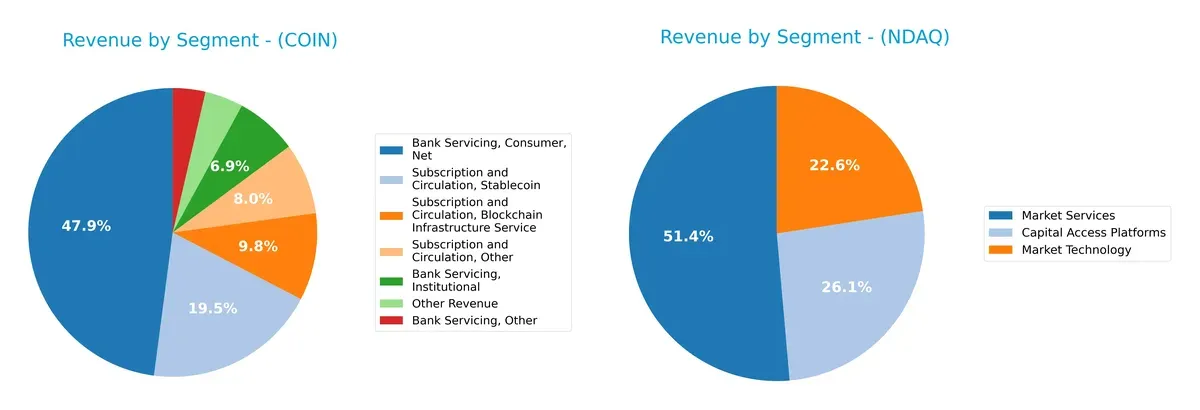
Coinbase leans heavily on “Bank Servicing, Consumer, Net” with $3.32B, anchoring most revenue, whereas Nasdaq spreads $4.21B across “Market Services” and $2.14B in “Capital Access Platforms.” Nasdaq’s diverse portfolio signals infrastructure dominance and resilience. Coinbase’s concentration risks exposure to consumer crypto volatility but benefits from ecosystem lock-in. Nasdaq’s balanced mix supports stable cash flow, reducing sector-specific shocks.
Strengths and Weaknesses Comparison
This table compares the Strengths and Weaknesses of Coinbase Global, Inc. and Nasdaq, Inc.:
Coinbase Strengths
- Strong net margin at 19%
- Very high current and quick ratios at 7.89
- Favorable debt-to-assets at 25.8%
- Interest coverage robust at 18.8x
- Diverse revenue streams in bank servicing and subscriptions
- Significant U.S. revenue of 6B
Nasdaq Strengths
- Higher net margin at 21.8%
- ROIC at 8.3% exceeds WACC at 7.4%
- Favorable interest coverage at 28.3x
- Strong fixed asset turnover at 7.0
- Diverse revenue streams in market services and technology
- Large U.S. revenue of 5.9B with growing non-US sales
Coinbase Weaknesses
- ROIC at 2.5% below high WACC of 18.5%
- Low ROE at 8.5%
- Elevated P/E of 46.7 and P/B of 3.98
- Asset turnover very low at 0.22
- No dividend yield
- Global ratios evaluation unfavorable
Nasdaq Weaknesses
- P/E of 31 and P/B of 4.5 still elevated
- Asset turnover low at 0.26
- Moderate debt-to-assets at 32%
- Dividend yield low at 1.1%
- Global ratios only slightly favorable
Overall, Coinbase shows strong liquidity and debt management but struggles with capital efficiency and profitability relative to its cost of capital. Nasdaq demonstrates better capital returns and asset efficiency, with a more balanced global footprint and slightly favorable financial health, reflecting disciplined capital allocation in mature markets.
The Moat Duel: Analyzing Competitive Defensibility
A structural moat is the only true safeguard for long-term profits against relentless competition erosion. Let’s dissect two rivals’ defenses:
Coinbase Global, Inc.: Network Effects in Cryptoeconomy
Coinbase leverages network effects by connecting millions in crypto trading. This drives high gross margins (82%) but declining ROIC signals weakening competitive strength. Expansion into new crypto services in 2026 could deepen the moat or accelerate margin pressure.
Nasdaq, Inc.: Diversified Market Infrastructure Moat
Nasdaq’s moat rests on its diversified exchange and market technology platforms, delivering stable and growing returns. Its EBIT margin (30%) and positive revenue growth confirm robust positioning, with growth in SaaS anti-financial crime tech offering fresh moat enhancement opportunities.
Market Infrastructure Breadth vs. Crypto Network Depth
Nasdaq’s diversified, expanding moat outpaces Coinbase’s fragile crypto network effect. Nasdaq’s steady ROIC and growth better equip it to defend and extend market share in 2026 and beyond.
Which stock offers better returns?
The past year revealed contrasting price dynamics: Coinbase Global, Inc. faced a sharp decline, while Nasdaq, Inc. recorded solid gains despite recent slight weakness.
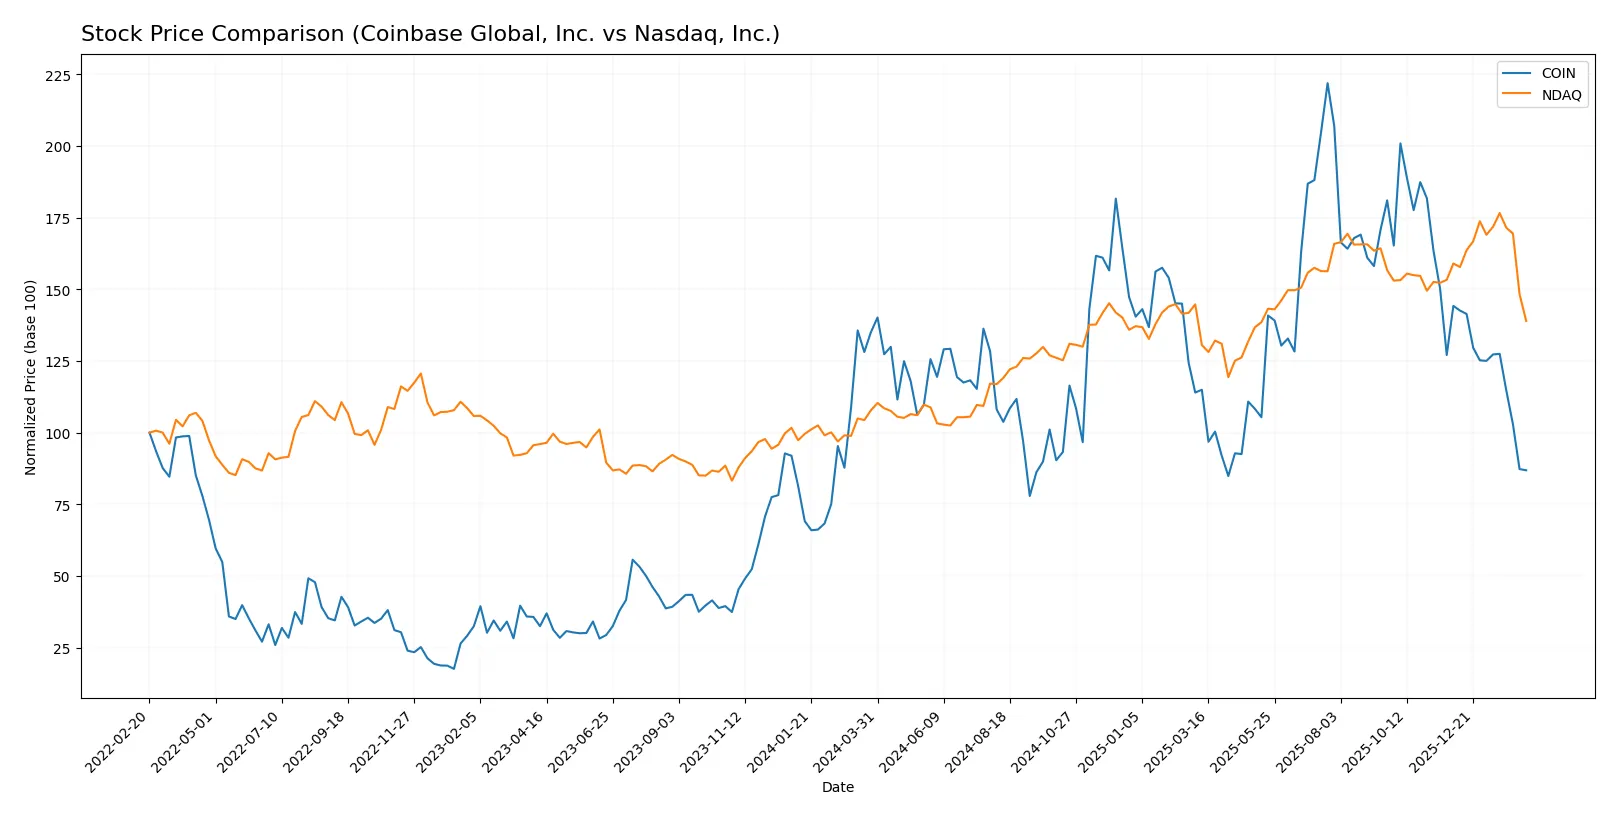
Trend Comparison
Coinbase Global, Inc. shows a bearish trend with a -36% price drop over 12 months. The decline decelerated, hitting a high of 420 and a low near 147.
Nasdaq, Inc. delivered a bullish trend with a 29% gain over the same period. The uptrend slowed but remained positive, trading between 59 and 101.
Nasdaq’s bullish 29% return outperformed Coinbase’s bearish -36%, marking Nasdaq as the stronger performer this year.
Target Prices
Analysts present a broad but optimistic target price consensus for Coinbase Global, Inc. and Nasdaq, Inc.
| Company | Target Low | Target High | Consensus |
|---|---|---|---|
| Coinbase Global, Inc. | 120 | 440 | 280.67 |
| Nasdaq, Inc. | 100 | 120 | 111.8 |
The target consensus for Coinbase suggests strong upside potential from the current 164.32 price, reflecting high volatility. Nasdaq’s consensus at 111.8 indicates moderate appreciation from 79.47, signaling steady confidence in its market position.

Don’t Let Luck Decide Your Entry Point
Optimize your entry points with our advanced ProRealTime indicators. You’ll get efficient buy signals with precise price targets for maximum performance. Start outperforming now!
How do institutions grade them?
Coinbase Global, Inc. Grades
The latest institutional grades for Coinbase Global, Inc. are summarized below:
| Grading Company | Action | New Grade | Date |
|---|---|---|---|
| Barclays | Maintain | Equal Weight | 2026-02-13 |
| Piper Sandler | Maintain | Neutral | 2026-02-13 |
| BTIG | Maintain | Buy | 2026-02-13 |
| Benchmark | Maintain | Buy | 2026-02-13 |
| Canaccord Genuity | Maintain | Buy | 2026-02-13 |
| Rosenblatt | Maintain | Buy | 2026-02-13 |
| Needham | Maintain | Buy | 2026-02-13 |
| HC Wainwright & Co. | Maintain | Buy | 2026-02-11 |
| JP Morgan | Maintain | Overweight | 2026-02-10 |
| Citigroup | Maintain | Buy | 2026-02-09 |
Nasdaq, Inc. Grades
Below is a summary of recent institutional grades for Nasdaq, Inc.:
| Grading Company | Action | New Grade | Date |
|---|---|---|---|
| Barclays | Maintain | Overweight | 2026-01-30 |
| Morgan Stanley | Maintain | Overweight | 2026-01-30 |
| RBC Capital | Maintain | Outperform | 2026-01-30 |
| TD Cowen | Maintain | Hold | 2026-01-30 |
| JP Morgan | Maintain | Overweight | 2026-01-30 |
| Morgan Stanley | Maintain | Overweight | 2026-01-15 |
| TD Cowen | Maintain | Hold | 2026-01-14 |
| UBS | Maintain | Buy | 2026-01-12 |
| JP Morgan | Maintain | Overweight | 2026-01-12 |
| Barclays | Maintain | Overweight | 2026-01-08 |
Which company has the best grades?
Both companies receive predominantly positive grades, but Coinbase shows a concentration of “Buy” ratings, while Nasdaq features more “Overweight” and “Outperform” grades. Investors may interpret Nasdaq’s grades as reflecting steadier confidence, whereas Coinbase’s higher count of “Buy” ratings suggests more bullish sentiment but with potentially higher volatility.
Risks specific to each company
In 2026’s complex market, these categories pinpoint critical pressure points and systemic threats confronting Coinbase Global, Inc. and Nasdaq, Inc.:
1. Market & Competition
Coinbase Global, Inc.
- Faces intense crypto market volatility and disruptive fintech entrants.
Nasdaq, Inc.
- Competes in diverse asset classes with established market infrastructure dominance.
2. Capital Structure & Debt
Coinbase Global, Inc.
- Moderate debt levels with favorable interest coverage but high WACC signals costly capital.
Nasdaq, Inc.
- Higher debt-to-assets ratio but lower WACC and strong interest coverage indicate prudent leverage.
3. Stock Volatility
Coinbase Global, Inc.
- Extremely high beta (3.7) reflects sharp price swings and elevated risk.
Nasdaq, Inc.
- Beta near 1.0 shows stock moves in line with market, implying lower volatility risk.
4. Regulatory & Legal
Coinbase Global, Inc.
- Crypto regulatory uncertainty remains a significant hurdle globally.
Nasdaq, Inc.
- Faces regulatory scrutiny across multiple asset classes but benefits from established compliance systems.
5. Supply Chain & Operations
Coinbase Global, Inc.
- Relies heavily on digital infrastructure vulnerable to cyber risks and service disruptions.
Nasdaq, Inc.
- Diverse operational platforms with robust technology mitigate operational disruption risks.
6. ESG & Climate Transition
Coinbase Global, Inc.
- Crypto energy consumption criticism poses reputational risk and potential regulatory impact.
Nasdaq, Inc.
- Advanced ESG initiatives and governance frameworks align with investor expectations.
7. Geopolitical Exposure
Coinbase Global, Inc.
- Exposure to international crypto regulations and geopolitical tensions impacting cross-border transactions.
Nasdaq, Inc.
- Global market presence entails sensitivity to geopolitical shifts but diversified revenue buffers impact.
Which company shows a better risk-adjusted profile?
Nasdaq’s strongest risk is regulatory complexity but its diversified revenue and stable capital structure reduce impact. Coinbase struggles with market volatility and regulatory uncertainty amplified by high capital costs and stock beta. Nasdaq’s lower beta and stronger Piotroski score (9 vs. 5) illustrate a superior risk-adjusted profile. Coinbase’s Altman Z-score near 3 signals moderate distress risk, warranting caution despite crypto growth potential.
Final Verdict: Which stock to choose?
Coinbase Global, Inc. shines as a cash machine with strong liquidity and a capacity to generate free cash flow. Its main point of vigilance is the sharply declining return on invested capital, signaling value destruction. It suits aggressive growth portfolios willing to tolerate volatility for potential upside.
Nasdaq, Inc. boasts a strategic moat rooted in its market infrastructure dominance and reliable recurring revenue. Its financial stability and healthier margin growth offer better safety than Coinbase. Nasdaq fits well in Growth at a Reasonable Price (GARP) portfolios focused on steady, quality expansion.
If you prioritize high liquidity and aggressive growth potential, Coinbase could be compelling despite its weakening capital efficiency. However, if you seek more stability and a proven moat with sustainable profitability, Nasdaq offers a safer path with more consistent returns. Each appeals to distinct investor profiles balancing risk and reward differently.
Disclaimer: Investment carries a risk of loss of initial capital. The past performance is not a reliable indicator of future results. Be sure to understand risks before making an investment decision.
Go Further
I encourage you to read the complete analyses of Coinbase Global, Inc. and Nasdaq, Inc. to enhance your investment decisions: