Home > Comparison > Financial Services > COIN vs MSCI
The strategic rivalry between Coinbase Global, Inc. and MSCI Inc. defines the current trajectory of the financial data and stock exchange sector. Coinbase operates as a cutting-edge cryptoeconomy infrastructure provider, while MSCI stands as a diversified investment decision support powerhouse. This head-to-head contrasts innovation-driven growth with established analytical dominance. This analysis will assess which company offers a superior risk-adjusted outlook for inclusion in a diversified portfolio.
Table of contents
Companies Overview
Coinbase Global and MSCI stand as pivotal players in the financial data and services arena, shaping investment landscapes globally.
Coinbase Global, Inc.: Crypto Financial Infrastructure Leader
Coinbase dominates as a primary financial account provider in the cryptoeconomy, serving both consumers and institutions. Its core revenue stems from transaction fees on its crypto marketplace and technology services that enable secure crypto payments. In 2026, Coinbase sharpens its focus on expanding liquidity pools and developer tools to capture growing crypto adoption.
MSCI Inc.: Premier Investment Decision Support Provider
MSCI excels in delivering comprehensive investment analytics and indexes that underlie global portfolio management. It generates revenue by licensing indexes and offering risk management, ESG, and private asset analytics to institutional clients. In 2026, MSCI prioritizes ESG integration and climate risk tools, responding to rising investor demand for sustainable investing frameworks.
Strategic Collision: Similarities & Divergences
Both companies operate within financial data but diverge sharply in approach: Coinbase embraces a decentralized crypto ecosystem while MSCI offers a centralized, data-driven investment platform. Their main battleground is the evolving asset management space, where digital assets and ESG considerations increasingly intersect. Coinbase’s growth hinges on crypto adoption volatility; MSCI’s strength lies in steady, fee-based analytics services.
Income Statement Comparison
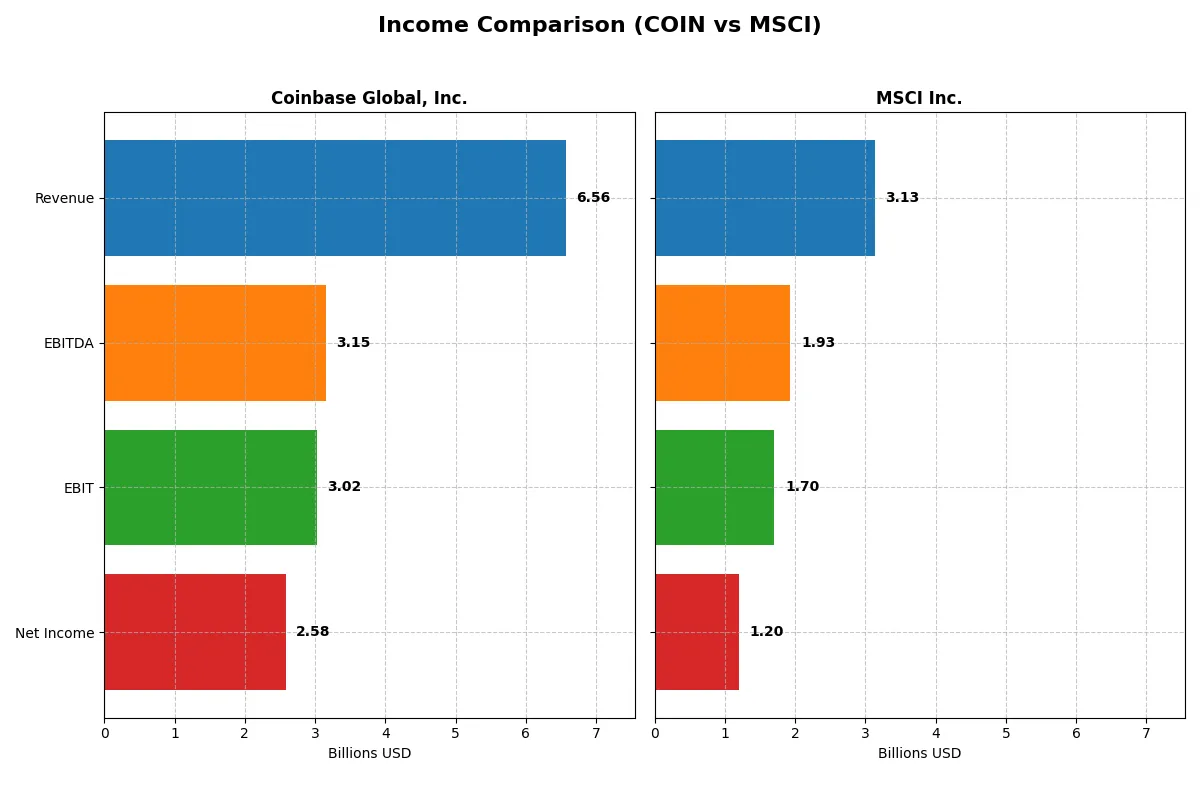
This detailed data dissects the core profitability and scalability of both corporate engines to reveal who dominates the bottom line:
| Metric | Coinbase Global, Inc. (COIN) | MSCI Inc. (MSCI) |
|---|---|---|
| Revenue | 6.56B | 2.86B |
| Cost of Revenue | 1.66B | 514M |
| Operating Expenses | 2.60B | 813M |
| Gross Profit | 4.91B | 2.34B |
| EBITDA | 3.15B | 1.75B |
| EBIT | 3.02B | 1.54B |
| Interest Expense | 81M | 186M |
| Net Income | 2.59B | 1.11B |
| EPS | 10.42 | 14.09 |
| Fiscal Year | 2024 | 2024 |
Income Statement Analysis: The Bottom-Line Duel
This income statement comparison reveals which company transforms revenue into profit with superior efficiency and sustainable growth.
Coinbase Global, Inc. Analysis
Coinbase nearly doubled revenue from $3.1B in 2023 to $6.6B in 2024, driving net income from $95M to $2.6B. Gross margin stands strong at 74.75%, and net margin surged to 39.29%. The company exhibits remarkable momentum, with a 111% revenue growth and a 1187% net margin expansion in the latest year.
MSCI Inc. Analysis
MSCI steadily grew revenue from $2.9B in 2024 to $3.1B in 2025, with net income rising from $1.1B to $1.2B. It commands a higher gross margin of 82.44% and a robust net margin near 38.36%. Growth is steady but moderate, with single-digit revenue and EBIT increases, while net margin slightly declined by 1.22% last year.
High-Growth Surge vs. Consistent Profitability
Coinbase outpaces MSCI with explosive revenue and net income growth, showcasing strong margin expansion and operational leverage. MSCI delivers superior gross margin but slower top-line momentum. For investors, Coinbase’s profile suits those seeking rapid earnings acceleration, while MSCI appeals to steady, margin-focused income stability.
Financial Ratios Comparison
These vital ratios act as a diagnostic tool to expose underlying fiscal health, valuation premiums, and capital efficiency for these two companies:
| Ratios | Coinbase Global, Inc. (COIN) | MSCI Inc. (MSCI) |
|---|---|---|
| ROE | 25.10% | -45.29% |
| ROIC | 13.56% | 35.60% |
| P/E | 23.82 | 36.82 |
| P/B | 5.98 | -16.68 |
| Current Ratio | 2.28 | 0.90 |
| Quick Ratio | 2.28 | 0.90 |
| D/E (Debt-to-Equity) | 0.45 | -2.42 |
| Debt-to-Assets | 20.54% | 112.54% |
| Interest Coverage | 28.61 | 8.16 |
| Asset Turnover | 0.29 | 0.55 |
| Fixed Asset Turnover | 23.34 | 15.66 |
| Payout ratio | 0% | 46.29% |
| Dividend yield | 0% | 1.26% |
| Fiscal Year | 2024 | 2025 |
Efficiency & Valuation Duel: The Vital Signs
Ratios act as the company’s DNA, uncovering hidden risks and operational strengths behind headline financials.
Coinbase Global, Inc.
Coinbase delivers strong profitability, with a 25.1% ROE and a robust 39.3% net margin. Its P/E ratio of 23.8 signals a fairly valued stock, while a high P/B of 5.98 suggests some premium. The company does not pay dividends but reinvests heavily in R&D, supporting growth and innovation.
MSCI Inc.
MSCI posts a solid 38.4% net margin and a high 35.6% ROIC, reflecting operational efficiency. However, a negative ROE and stretched P/E of 36.8 point to valuation risk. MSCI offers a modest 1.26% dividend yield, balancing shareholder returns with capital discipline despite weaker liquidity ratios.
Premium Valuation vs. Operational Safety
Coinbase balances profitability and valuation more prudently, showing healthier liquidity and shareholder reinvestment. MSCI’s strong operational returns come with valuation and balance sheet risks. Investors seeking growth with operational resilience may prefer Coinbase, while those prioritizing dividends might lean toward MSCI.
Which one offers the Superior Shareholder Reward?
I observe that Coinbase Global, Inc. (COIN) pays no dividends, focusing on reinvestment and growth. It maintains a zero dividend payout ratio with no buybacks reported, indicating capital retention for expansion. Conversely, MSCI Inc. (MSCI) distributes steady dividends yielding around 1.1% with payout ratios near 46%, supported by strong free cash flow coverage (~97.5%). MSCI also sustains consistent buyback activity, enhancing total shareholder return. MSCI’s balanced distribution strategy combines cash returns with buybacks, making it more sustainable and attractive for long-term investors. I conclude MSCI offers a superior total return profile compared to Coinbase in 2026.
Comparative Score Analysis: The Strategic Profile
The radar chart reveals the fundamental DNA and trade-offs of Coinbase Global, Inc. and MSCI Inc., highlighting their core financial strengths and weaknesses:
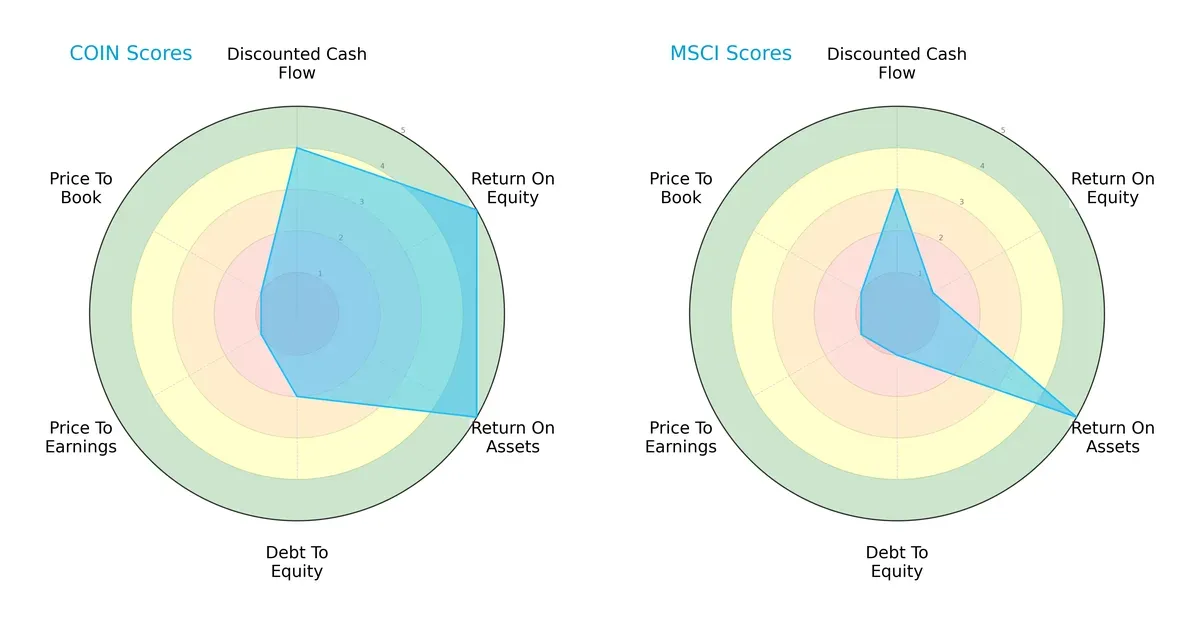
Coinbase shows a robust ROE and ROA, scoring 5 in both, signaling strong profitability and asset efficiency. However, its debt-to-equity and valuation scores (1 for P/E and P/B) indicate high leverage risk and overvaluation concerns. MSCI presents a more conservative balance sheet with a very low debt-to-equity score of 1 but suffers from weak ROE at 1, relying heavily on asset efficiency (ROA 5). Coinbase’s profile is less balanced, leaning on profitability but burdened by leverage and valuation risks. MSCI offers a steadier, albeit less profitable, financial stance with fewer risk flags.
Bankruptcy Risk: Solvency Showdown
Coinbase’s Altman Z-Score stands at 3.35, while MSCI’s is higher at 5.84, both in the safe zone but indicating different resilience levels in this cycle:
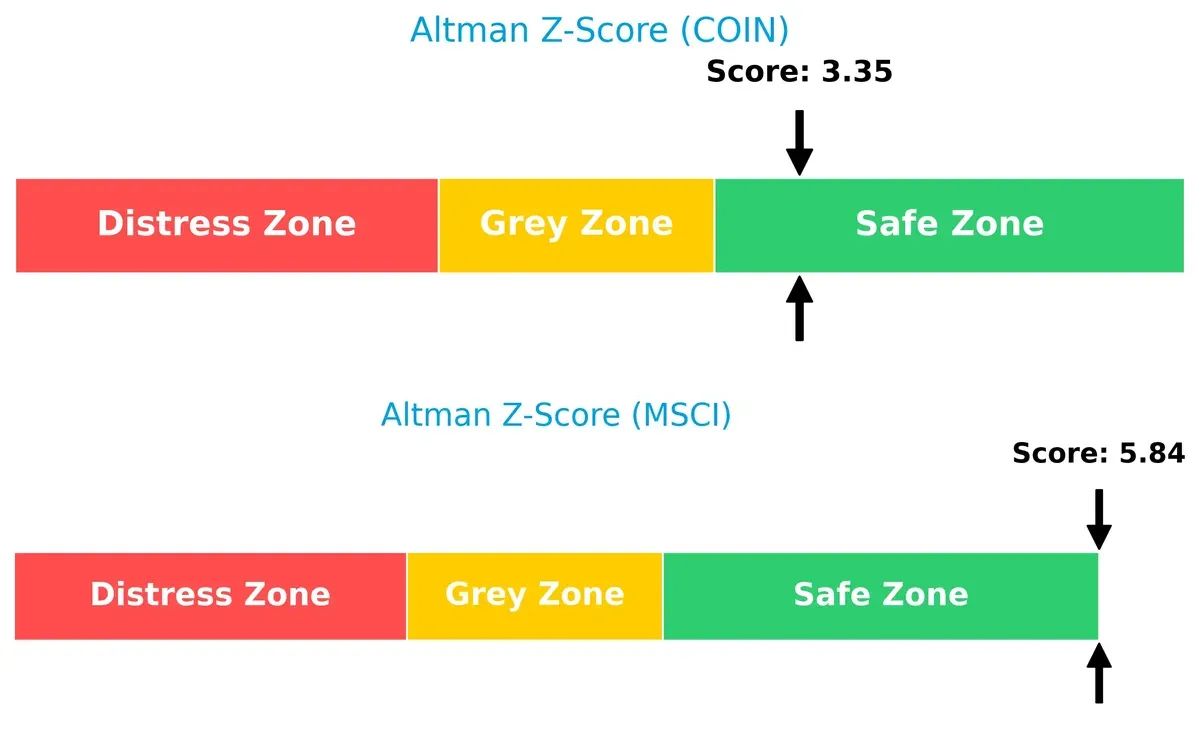
MSCI’s superior Z-Score reflects stronger financial stability and lower bankruptcy risk, showcasing prudent capital management. Coinbase, though in the safe zone, carries more vulnerability due to its higher leverage, which could pressure it during economic downturns.
Financial Health: Quality of Operations
MSCI’s Piotroski F-Score of 8 outperforms Coinbase’s 6, signaling superior operational health and fewer internal red flags:
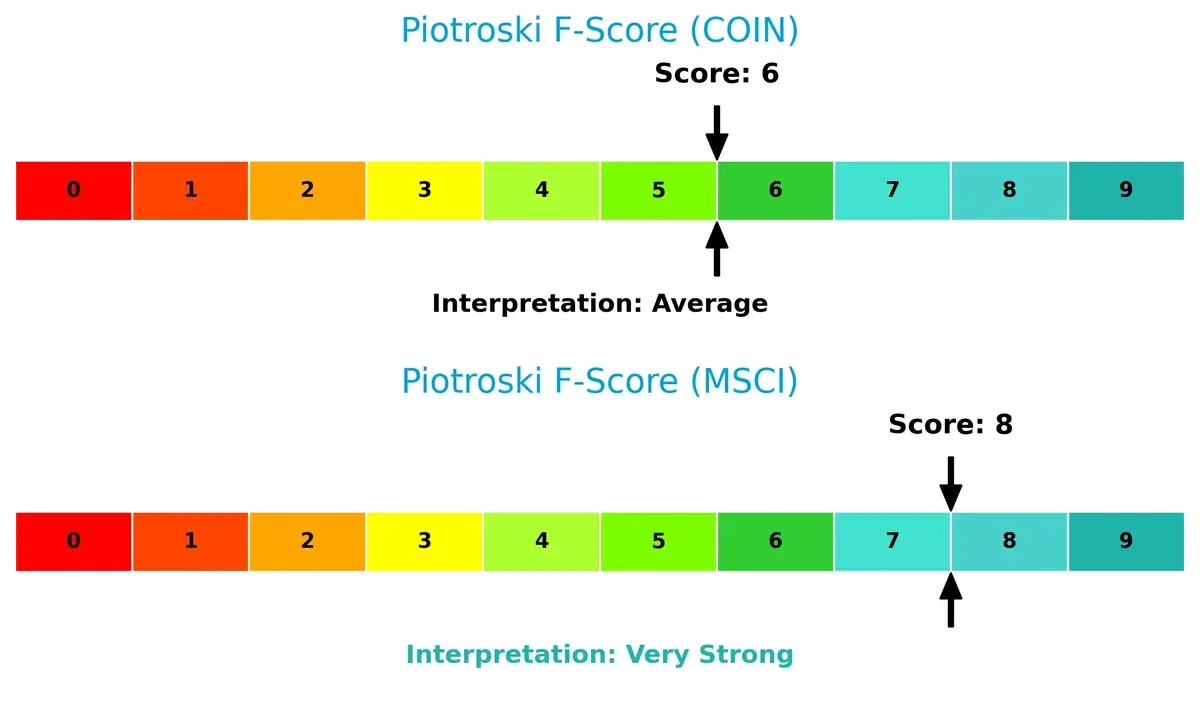
MSCI’s score indicates very strong financial quality, reflecting efficient leverage, liquidity, and profitability management. Coinbase’s average score suggests moderate strength but hints at potential operational weaknesses investors should monitor carefully.
How are the two companies positioned?
This section dissects the operational DNA of Coinbase and MSCI by comparing their revenue distribution and internal dynamics. The goal is to confront their economic moats to reveal which business model offers the most resilient competitive advantage today.
Revenue Segmentation: The Strategic Mix
The following comparison dissects how Coinbase Global, Inc. and MSCI Inc. diversify their income streams and reveal where their primary sector bets lie:
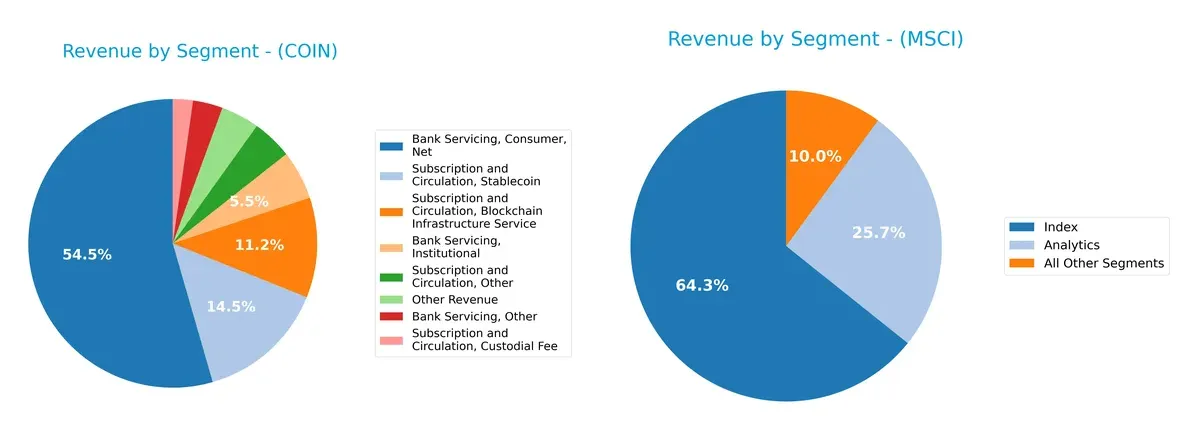
Coinbase leans heavily on its Consumer Bank Servicing segment at $3.43B, dwarfing its other smaller blockchain infrastructure and subscription revenues. MSCI shows a more balanced mix with $1.79B from Index services, $714M from Analytics, and $279M from other segments. Coinbase’s concentration signals dependence on consumer crypto trading, risking volatility, while MSCI’s diversified streams anchor stability and ecosystem lock-in in financial data services.
Strengths and Weaknesses Comparison
This table compares the strengths and weaknesses of Coinbase Global, Inc. and MSCI Inc.:
Coinbase Strengths
- Strong net margin at 39.29%
- Favorable ROE at 25.1%
- Healthy liquidity with current and quick ratios above 2
- Low debt-to-assets ratio at 20.54%
- Significant US revenue exceeding 5.4B
- Diversified revenue across consumer and subscription services
MSCI Strengths
- Strong net margin at 38.36%
- High ROIC at 35.6% surpassing WACC
- Favorable interest coverage ratio at 8.12
- Robust fixed asset turnover at 15.66
- Diversified global revenue across Americas, EMEA and Asia
- Positive PB ratio indicating asset value
Coinbase Weaknesses
- ROIC below WACC at 13.56% vs. 19.51% WACC indicates inefficient capital use
- High PB ratio at 5.98 may imply overvaluation
- Low asset turnover at 0.29 signals less efficient asset use
- No dividend yield limits income appeal
MSCI Weaknesses
- Negative ROE at -45.29% signals poor profitability
- Debt-to-assets ratio very high at 112.54% raises solvency concerns
- Current ratio below 1 at 0.9 risks short-term liquidity problems
- Elevated PE ratio at 36.82 may indicate overvaluation
Both companies show strong profitability and diversified revenue streams. However, Coinbase’s capital efficiency and asset utilization lag, while MSCI faces significant solvency and profitability challenges. These factors influence each firm’s financial flexibility and strategy execution in competitive markets.
The Moat Duel: Analyzing Competitive Defensibility
A structural moat is the only true shield protecting long-term profits from relentless competitive erosion. Let’s examine two industry players’ moats:
Coinbase Global, Inc.: Network Effects with Volatility
Coinbase’s moat stems from network effects within the crypto ecosystem, shown by rapid revenue growth and margin expansion. However, a declining ROIC signals weakening capital efficiency in 2026.
MSCI Inc.: Intangible Assets and Data Dominance
MSCI’s moat relies on intangible assets, especially proprietary indexes and analytics. Its ROIC far exceeds WACC, reflecting efficient capital use and steady margin strength. Expansion in ESG and private assets deepens this advantage.
Verdict: Network Effects’ Fragility vs. Intangibles’ Durability
MSCI possesses a deeper, more sustainable moat with rising ROIC and consistent profitability. Coinbase’s network effect is powerful but currently undermined by value destruction. MSCI stands better poised to defend market share.
Which stock offers better returns?
Over the past year, Coinbase Global, Inc. experienced a sharp price decline, while MSCI Inc. showed a modest upward trend with accelerating momentum.
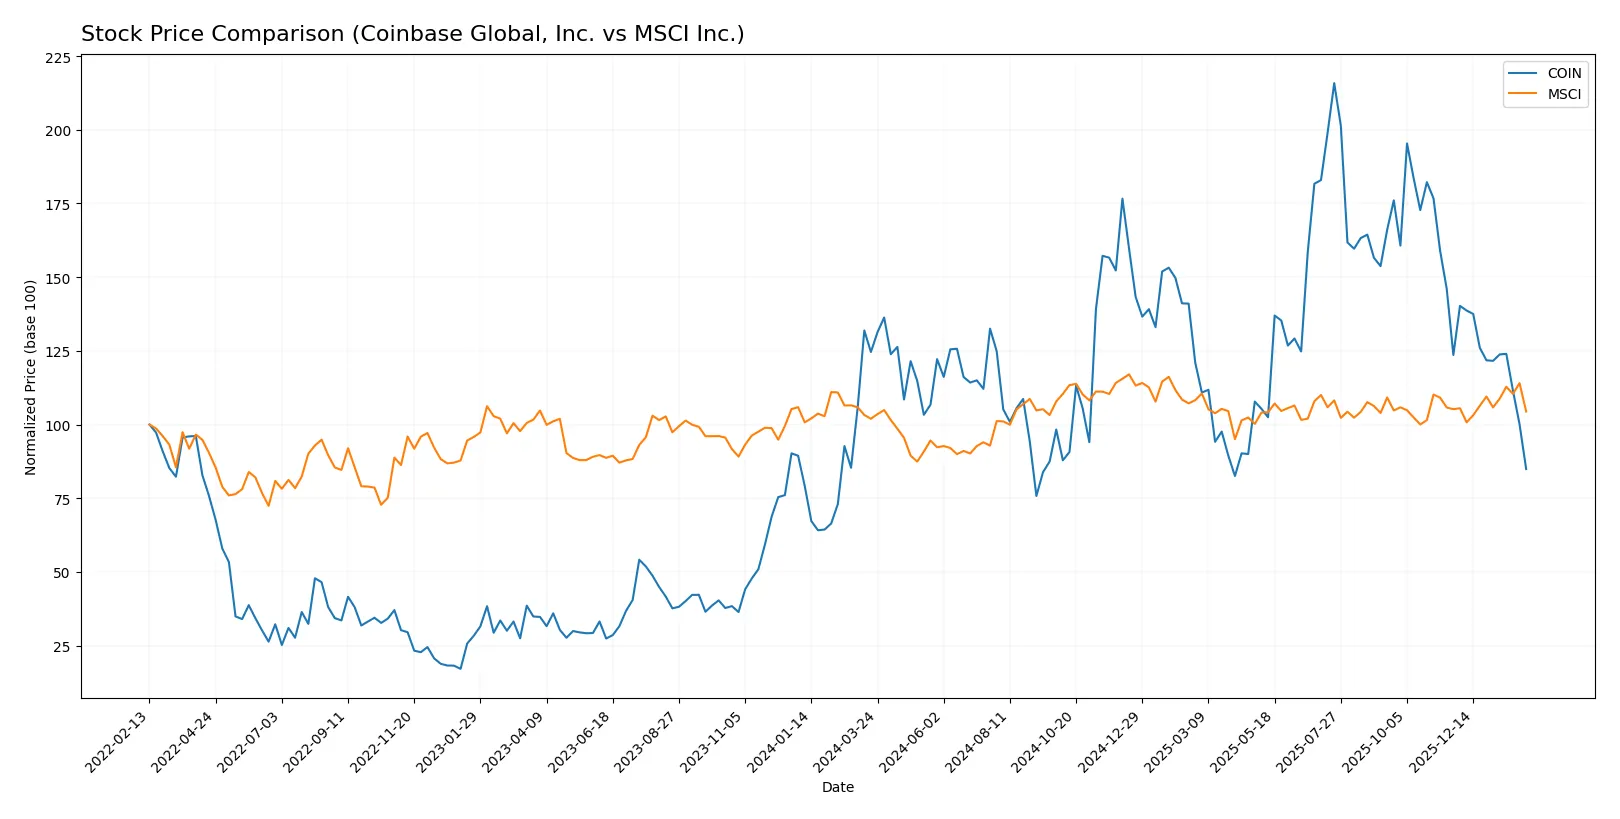
Trend Comparison
Coinbase Global, Inc. shows a bearish trend with a -31.87% price change over 12 months. The trend decelerates amid high volatility, ranging from $147.35 to $419.78.
MSCI Inc. registers a bullish trend with a 2.39% gain over the same period. The price accelerates, fluctuating between $467.04 and $625.10, despite a slight recent dip.
MSCI outperforms Coinbase, delivering positive returns versus a significant decline. MSCI’s trend demonstrates stronger market resilience in this timeframe.
Target Prices
Analysts present a clear target consensus for Coinbase Global, Inc. and MSCI Inc., indicating potential upside from current prices.
| Company | Target Low | Target High | Consensus |
|---|---|---|---|
| Coinbase Global, Inc. | 230 | 440 | 336.44 |
| MSCI Inc. | 618 | 715 | 664.5 |
Both stocks show significant upside potential versus their current prices. Coinbase’s target consensus suggests more than 100% gain, while MSCI’s target implies roughly 20% appreciation.

Don’t Let Luck Decide Your Entry Point
Optimize your entry points with our advanced ProRealTime indicators. You’ll get efficient buy signals with precise price targets for maximum performance. Start outperforming now!
How do institutions grade them?
The following tables summarize recent institutional grades for Coinbase Global, Inc. and MSCI Inc.:
Coinbase Global, Inc. Grades
This table shows recent grades from recognized financial institutions for Coinbase Global, Inc.
| Grading Company | Action | New Grade | Date |
|---|---|---|---|
| BTIG | Maintain | Buy | 2026-02-05 |
| Piper Sandler | Maintain | Neutral | 2026-01-14 |
| Oppenheimer | Maintain | Outperform | 2026-01-12 |
| B of A Securities | Upgrade | Buy | 2026-01-08 |
| Barclays | Maintain | Equal Weight | 2026-01-08 |
| Cantor Fitzgerald | Maintain | Overweight | 2025-12-18 |
| BTIG | Maintain | Buy | 2025-12-18 |
| Compass Point | Maintain | Sell | 2025-12-15 |
| Barclays | Maintain | Equal Weight | 2025-12-12 |
| Argus Research | Downgrade | Hold | 2025-11-25 |
MSCI Inc. Grades
This table shows recent grades from recognized financial institutions for MSCI Inc.
| Grading Company | Action | New Grade | Date |
|---|---|---|---|
| Evercore ISI Group | Maintain | Outperform | 2026-01-29 |
| Wells Fargo | Maintain | Equal Weight | 2026-01-29 |
| Wells Fargo | Maintain | Equal Weight | 2026-01-14 |
| JP Morgan | Maintain | Overweight | 2025-10-29 |
| UBS | Maintain | Buy | 2025-10-29 |
| Wells Fargo | Maintain | Equal Weight | 2025-10-29 |
| Barclays | Maintain | Overweight | 2025-10-29 |
| Evercore ISI Group | Maintain | Outperform | 2025-10-14 |
| JP Morgan | Maintain | Overweight | 2025-09-10 |
| Wells Fargo | Maintain | Equal Weight | 2025-07-23 |
Which company has the best grades?
MSCI Inc. consistently receives higher grades, including multiple “Outperform” and “Overweight” ratings. Coinbase Global shows more mixed signals, ranging from “Buy” to “Sell.” MSCI’s stronger grades may signal greater institutional confidence, potentially affecting investor sentiment positively.
Risks specific to each company
The following categories identify critical pressure points and systemic threats facing Coinbase Global, Inc. and MSCI Inc. in the 2026 market environment:
1. Market & Competition
Coinbase Global, Inc.
- Faces intense competition in the volatile crypto market; innovation pace and regulation impact market share.
MSCI Inc.
- Competes in a mature data analytics and index market with steady but slower growth and established client base.
2. Capital Structure & Debt
Coinbase Global, Inc.
- Maintains favorable debt metrics with low leverage and strong interest coverage, reducing financial risk.
MSCI Inc.
- Exhibits concerning debt-to-assets ratio above 100%, signaling high leverage and potential solvency pressure.
3. Stock Volatility
Coinbase Global, Inc.
- High beta (3.7) indicates significant stock price volatility and sensitivity to market swings.
MSCI Inc.
- Moderate beta (1.28) reflects comparatively stable stock movement aligned with market benchmarks.
4. Regulatory & Legal
Coinbase Global, Inc.
- Vulnerable to evolving crypto regulations globally, which can affect operational licenses and business models.
MSCI Inc.
- Faces regulatory scrutiny mainly around ESG data transparency and index methodology, with lower disruption risk.
5. Supply Chain & Operations
Coinbase Global, Inc.
- Dependent on technology infrastructure and liquidity pools; operational risks from cyber threats and system outages.
MSCI Inc.
- Relies on data integrity and analytics platforms, with operational risks centered on data accuracy and client retention.
6. ESG & Climate Transition
Coinbase Global, Inc.
- Crypto industry faces criticism for energy use; must navigate increasing ESG pressures on sustainability and transparency.
MSCI Inc.
- ESG and Climate segment is a core business driver, positioning MSCI as a leader but exposing it to regulatory and reputational risks.
7. Geopolitical Exposure
Coinbase Global, Inc.
- International crypto regulations and geopolitical tensions can disrupt cross-border transactions and market access.
MSCI Inc.
- Global client base exposes MSCI to geopolitical risks, but diversified revenue streams mitigate concentrated impact.
Which company shows a better risk-adjusted profile?
Coinbase’s greatest risk is high market volatility amplified by regulatory uncertainty in crypto. MSCI’s most severe risk lies in its elevated debt-to-assets ratio, threatening financial stability. I regard MSCI as having a better risk-adjusted profile, supported by a safer Altman Z-score and stronger Piotroski score, despite its debt concerns. Coinbase’s high beta and disruptive market position warrant cautious risk management.
Final Verdict: Which stock to choose?
Coinbase’s superpower lies in its rapid revenue and earnings growth, fueled by a strong net margin and robust cash generation. However, its declining ROIC versus WACC signals a value destruction warning, making it a point of vigilance. It fits well in aggressive growth portfolios willing to tolerate higher operational risk.
MSCI stands out with a durable competitive moat supported by a rising ROIC well above WACC, reflecting efficient capital use and sustainable profitability. Its safety profile is stronger than Coinbase’s, despite a less dynamic growth pace. MSCI suits investors focused on GARP, balancing growth with reasonable risk.
If you prioritize aggressive growth and can tolerate operational volatility, Coinbase offers compelling upside through rapid expansion. However, if you seek stability and capital efficiency with a proven moat, MSCI outshines as the better choice for a prudently managed portfolio. Both present valid scenarios depending on your risk appetite and investment horizon.
Disclaimer: Investment carries a risk of loss of initial capital. The past performance is not a reliable indicator of future results. Be sure to understand risks before making an investment decision.
Go Further
I encourage you to read the complete analyses of Coinbase Global, Inc. and MSCI Inc. to enhance your investment decisions: