Coherent, Inc. and Trimble Inc. stand out as influential players in the Hardware, Equipment & Parts industry, each driving innovation in distinct yet overlapping technological fields. While Coherent specializes in laser technologies for industrial and scientific applications, Trimble focuses on advanced software and hardware solutions for construction, agriculture, and transportation sectors. This article will analyze both companies to help you determine which presents the most compelling investment opportunity in 2026.
Table of contents
Companies Overview
I will begin the comparison between Coherent, Inc. and Trimble Inc. by providing an overview of these two companies and their main differences.
Coherent, Inc. Overview
Coherent, Inc. specializes in lasers and laser-based technologies for commercial, industrial, and scientific research applications. The company operates mainly through two segments: Original Equipment Manufacturers (OEM) Laser Sources and Industrial Lasers & Systems. It designs and markets precision optics, laser tools, and measurement products, serving industries like microelectronics and materials processing. Coherent has a strong market position and is a subsidiary of II-VI Incorporated since 2022.
Trimble Inc. Overview
Trimble Inc. delivers technology solutions aimed at improving the efficiency of professionals and mobile field workers globally. Its offerings span several segments including Buildings and Infrastructure, Geospatial, Resources and Utilities, and Transportation. The company provides software, hardware, and integrated systems for construction, surveying, agriculture, and fleet management. Trimble is headquartered in California and has evolved from Trimble Navigation Limited, reflecting its broadened technological scope.
Key similarities and differences
Both Coherent and Trimble operate within the Technology sector focusing on hardware and equipment, with a significant presence in precision instruments and systems. Coherent concentrates on laser technologies for industrial and scientific uses, while Trimble covers a broader range of technology solutions including software and hardware for construction, agriculture, and transportation. Their business models differ in specialization, with Coherent focusing on laser systems and Trimble on integrated technological platforms for various professional industries.
Income Statement Comparison
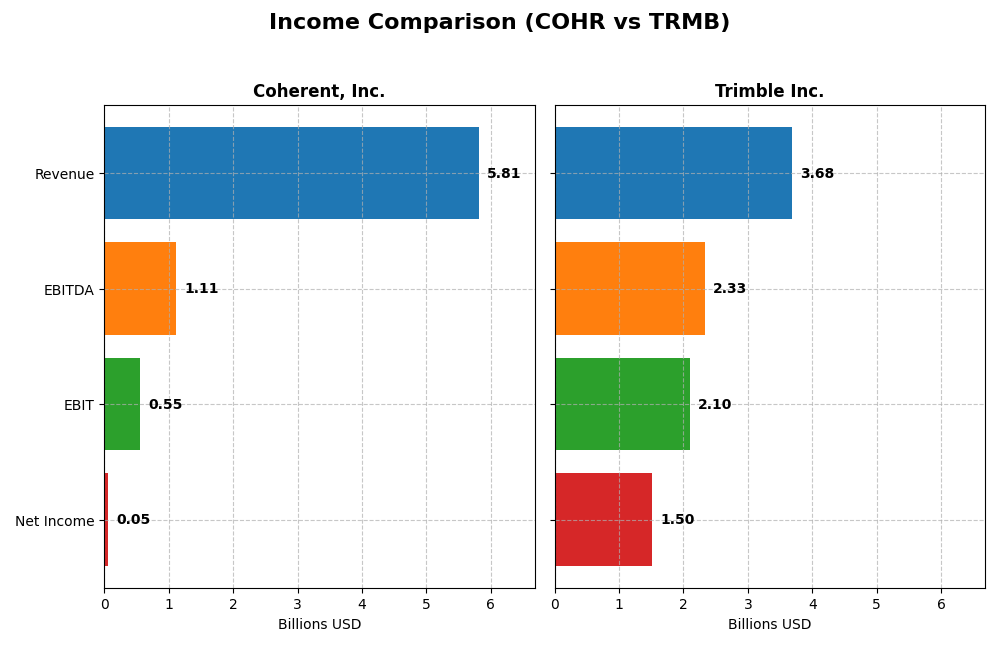
This table presents the key income statement metrics for Coherent, Inc. and Trimble Inc. for their most recent fiscal years, providing a clear side-by-side financial snapshot.
| Metric | Coherent, Inc. (2025) | Trimble Inc. (2024) |
|---|---|---|
| Market Cap | 29.5B | 19.1B |
| Revenue | 5.81B | 3.68B |
| EBITDA | 1.11B | 2.33B |
| EBIT | 552M | 2.10B |
| Net Income | 49.4M | 1.50B |
| EPS | -0.52 | 6.13 |
| Fiscal Year | 2025 | 2024 |
Income Statement Interpretations
Coherent, Inc.
Coherent, Inc. shows a strong revenue growth of 87.07% from 2021 to 2025, with a notable 23.42% increase in the last year. Gross margins remain favorable at 35.41%, while net margin is stable but low at 0.85%. The recent year’s performance highlights significant improvements in EBIT and net margin growth, reversing previous net income declines despite ongoing challenges.
Trimble Inc.
Trimble Inc. experienced moderate revenue growth of 17.02% over 2020–2024, with a slight 3.04% decline in the last year. Margins are robust, with gross margin at 65.06%, EBIT margin at 56.92%, and net margin at 40.84%, all favorable. The most recent year shows strong EBIT and net margin growth, supported by efficient cost management and improved EPS despite a small revenue setback.
Which one has the stronger fundamentals?
Trimble’s fundamentals appear stronger, supported by consistently high margins and favorable net income growth of 285.84% over the period. Coherent has achieved higher revenue growth but struggles with net income and margin volatility. Both companies have favorable overall income statement evaluations, yet Trimble’s superior profitability and margin stability provide a more robust financial foundation.
Financial Ratios Comparison
This table presents the latest key financial ratios for Coherent, Inc. and Trimble Inc., highlighting their financial performance and stability as of their most recent fiscal year.
| Ratios | Coherent, Inc. (2025) | Trimble Inc. (2024) |
|---|---|---|
| ROE | 0.61% | 26.18% |
| ROIC | 1.31% | 4.49% |
| P/E | 279.75 | 11.52 |
| P/B | 1.70 | 3.02 |
| Current Ratio | 2.19 | 1.27 |
| Quick Ratio | 1.39 | 1.16 |
| D/E | 0.48 | 0.26 |
| Debt-to-Assets | 26.11% | 15.96% |
| Interest Coverage | 2.26 | 5.08 |
| Asset Turnover | 0.39 | 0.39 |
| Fixed Asset Turnover | 3.09 | 11.81 |
| Payout ratio | 23.17% | 0% |
| Dividend yield | 0.08% | 0% |
Interpretation of the Ratios
Coherent, Inc.
Coherent’s financial ratios show several weaknesses, including a very low net margin of 0.85% and a return on equity (ROE) of just 0.61%, both rated unfavorable. While liquidity ratios like the current ratio at 2.19 are favorable, high price-to-earnings (PE) ratio of 279.75 and low dividend yield of 0.08% raise concerns. The company does not pay dividends, possibly prioritizing reinvestment or facing earnings challenges.
Trimble Inc.
Trimble exhibits stronger profitability with a net margin of 40.84% and ROE of 26.18%, both favorable, despite an unfavorable return on invested capital (ROIC) of 4.49%. Its PE ratio of 11.52 is attractive, but the price-to-book (PB) ratio at 3.02 is less favorable. Trimble does not pay dividends, likely focusing on growth or R&D, supported by solid free cash flow and shareholder returns.
Which one has the best ratios?
Trimble’s ratios are generally more favorable, with better profitability, lower PE, and stronger liquidity coverage. Coherent, while showing some liquidity strength, struggles with profitability and valuation metrics. Overall, Trimble’s financial profile appears more robust compared to Coherent’s slightly unfavorable ratio analysis.
Strategic Positioning
This section compares the strategic positioning of Coherent, Inc. and Trimble Inc., focusing on market position, key segments, and exposure to technological disruption:
Coherent, Inc.
- Operates in hardware with strong competition; $29.5B market cap; higher beta indicates volatility.
- Key segments include Lasers ($1.43B) and Materials ($954M), mainly serving industrial and research.
- Focused on laser technologies and precision optics; moderate disruption risk from tech innovation.
Trimble Inc.
- Competes in hardware and tech solutions; $19.1B market cap; moderately high beta shows risk.
- Diverse segments: Buildings, Geospatial, Resources, Transportation, totaling multi-billion revenues.
- Technology solutions in software and hardware, including autonomous and data management systems.
Coherent, Inc. vs Trimble Inc. Positioning
Coherent has a concentrated focus on laser-based hardware and materials, serving specialized industrial sectors. Trimble’s approach is more diversified, spanning multiple industries with integrated software and hardware solutions, offering broader business drivers but higher complexity.
Which has the best competitive advantage?
Both companies show very unfavorable MOAT evaluations with declining ROIC trends and are currently destroying value. Neither demonstrates a sustainable competitive advantage based on recent capital efficiency data.
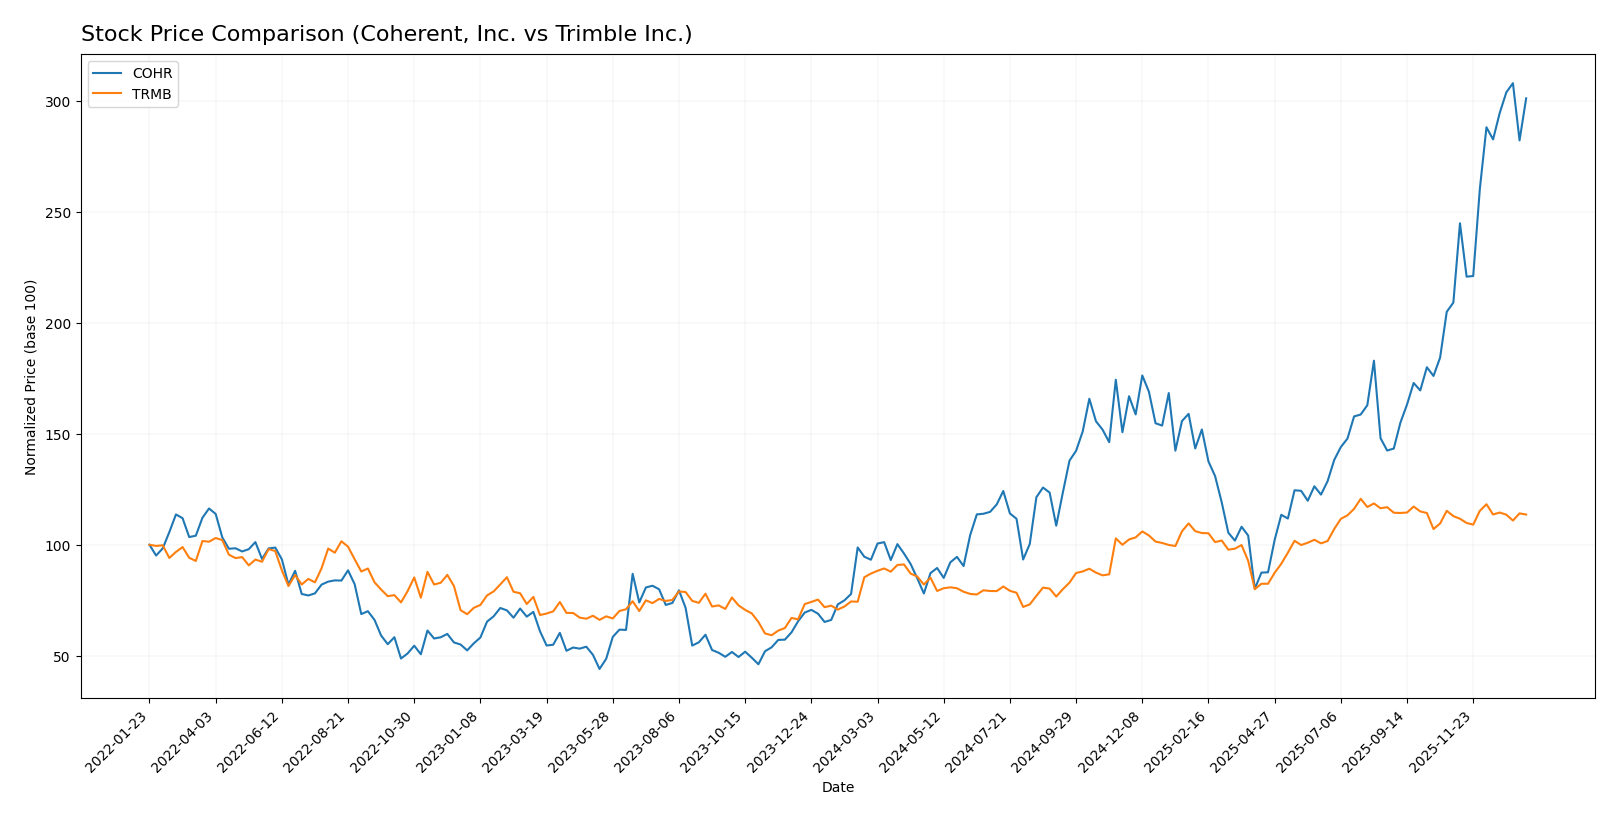
Stock Comparison
The stock price charts for Coherent, Inc. (COHR) and Trimble Inc. (TRMB) over the past 12 months reveal significant price appreciation for COHR with accelerating momentum, while TRMB shows moderate gains accompanied by slowing upward movement.
Trend Analysis
Coherent, Inc. (COHR) experienced a strong bullish trend over the past year with a 222.85% price increase and accelerating momentum. The stock exhibited high volatility with a standard deviation of 34.26, reaching a peak of 194.33 and a low of 49.26.
Trimble Inc. (TRMB) also exhibited a bullish trend over the past year, with a 30.56% price increase; however, the trend showed deceleration and lower volatility at a standard deviation of 9.8. Its highest and lowest prices were 85.24 and 50.86, respectively.
Comparing both stocks, COHR delivered the highest market performance with a significantly larger price increase and accelerating trend, whereas TRMB posted moderate gains with a slowing upward trend.
Target Prices
The current analyst consensus on target prices for Coherent, Inc. and Trimble Inc. reflects moderate expectations relative to their market prices.
| Company | Target High | Target Low | Consensus |
|---|---|---|---|
| Coherent, Inc. | 210 | 135 | 175 |
| Trimble Inc. | 102 | 94 | 98.2 |
For Coherent, Inc., the consensus target price of 175 is below its current market price of 190.03, suggesting a cautious outlook. Trimble Inc.’s consensus target of 98.2 is notably higher than its current price of 80.24, indicating potential upside.
Analyst Opinions Comparison
This section compares analysts’ ratings and grades for Coherent, Inc. and Trimble Inc.:
Rating Comparison
Coherent, Inc. Rating
- Rating: Both companies have a B- rating, considered very favorable by analysts.
- Discounted Cash Flow Score: Coherent scores 3, indicating moderate valuation based on future cash flows.
- ROE Score: Coherent has a score of 2, showing moderate efficiency in generating profit from equity.
- ROA Score: Coherent’s score is 3, reflecting moderate effectiveness in asset utilization.
- Debt To Equity Score: Coherent scores 2, indicating moderate financial risk.
- Overall Score: Coherent’s overall score is 2, considered moderate by analysts.
Trimble Inc. Rating
- Rating: Both companies have a B- rating, considered very favorable by analysts.
- Discounted Cash Flow Score: Trimble also scores 3, reflecting a similar moderate valuation.
- ROE Score: Trimble scores higher at 3, indicating better efficiency in profit generation from equity.
- ROA Score: Trimble also has a 3 score, showing similar asset utilization effectiveness.
- Debt To Equity Score: Trimble also scores 2, indicating comparable financial risk.
- Overall Score: Trimble has the same overall score of 2, also considered moderate.
Which one is the best rated?
Both Coherent and Trimble share the same overall rating of B- and an overall score of 2, indicating moderate standing. Trimble holds a slight advantage with a higher ROE score of 3 versus Coherent’s 2, suggesting better profitability efficiency.
Scores Comparison
The comparison of the Altman Z-Score and Piotroski Score for Coherent and Trimble is as follows:
Coherent Scores
- Altman Z-Score: 3.70, indicating a safe zone with low bankruptcy risk.
- Piotroski Score: 7, indicating strong financial health.
Trimble Scores
- Altman Z-Score: 4.56, indicating a safe zone with low bankruptcy risk.
- Piotroski Score: 6, indicating average financial health.
Which company has the best scores?
Trimble has a higher Altman Z-Score, suggesting slightly lower bankruptcy risk, while Coherent has a better Piotroski Score, reflecting stronger financial health. The scores show strengths in different financial aspects for each company.
Grades Comparison
Here is a summary of the recent grades assigned to Coherent, Inc. and Trimble Inc.:
Coherent, Inc. Grades
This table presents the latest grades and actions from reputable grading companies for Coherent, Inc.:
| Grading Company | Action | New Grade | Date |
|---|---|---|---|
| Morgan Stanley | Maintain | Equal Weight | 2025-12-17 |
| JP Morgan | Maintain | Overweight | 2025-12-05 |
| Barclays | Maintain | Overweight | 2025-11-07 |
| Morgan Stanley | Maintain | Equal Weight | 2025-11-06 |
| Stifel | Maintain | Buy | 2025-11-06 |
| Rosenblatt | Maintain | Buy | 2025-11-06 |
| Needham | Maintain | Buy | 2025-11-06 |
| Susquehanna | Maintain | Positive | 2025-10-22 |
| Barclays | Maintain | Overweight | 2025-10-20 |
| Rosenblatt | Maintain | Buy | 2025-10-14 |
Coherent, Inc. shows a consistent pattern of buy and overweight ratings with no recent downgrades.
Trimble Inc. Grades
The following table lists recent grades and actions from verified grading firms for Trimble Inc.:
| Grading Company | Action | New Grade | Date |
|---|---|---|---|
| Barclays | Maintain | Overweight | 2026-01-12 |
| Keybanc | Upgrade | Overweight | 2025-12-16 |
| Piper Sandler | Maintain | Overweight | 2025-11-07 |
| JP Morgan | Maintain | Overweight | 2025-09-19 |
| JP Morgan | Maintain | Overweight | 2025-08-07 |
| Oppenheimer | Maintain | Outperform | 2025-08-07 |
| Raymond James | Maintain | Outperform | 2025-08-07 |
| Oppenheimer | Maintain | Outperform | 2025-07-17 |
| JP Morgan | Maintain | Overweight | 2025-07-10 |
| JP Morgan | Maintain | Overweight | 2025-05-14 |
Trimble Inc. maintains a strong consensus with multiple outperform and overweight ratings, including a recent upgrade.
Which company has the best grades?
Both Coherent, Inc. and Trimble Inc. hold a consensus “Buy” rating from analysts, but Trimble Inc. has more frequent “Outperform” and “Overweight” ratings, indicating stronger confidence. This pattern may attract investors seeking companies with sustained positive analyst sentiment.
Strengths and Weaknesses
Below is a comparison of key strengths and weaknesses for Coherent, Inc. (COHR) and Trimble Inc. (TRMB) based on the latest financial and operational data.
| Criterion | Coherent, Inc. (COHR) | Trimble Inc. (TRMB) |
|---|---|---|
| Diversification | Moderate: Focused on Lasers (1.43B) and Materials (954M) segments | High: Diverse segments including Buildings, Geospatial, Resources, Transportation, Products, and Services |
| Profitability | Low profitability; net margin 0.85%, ROIC 1.31%, ROE 0.61% (unfavorable) | Strong profitability; net margin 40.84%, ROE 26.18% (favorable), but ROIC 4.49% below WACC |
| Innovation | Moderate innovation indicated by fixed asset turnover 3.09 (favorable) | High innovation with fixed asset turnover 11.81 and strong service/product development |
| Global presence | Limited global footprint implied by segment focus and lower asset turnover | Broad global presence across multiple infrastructure and geospatial markets |
| Market Share | Challenged by declining ROIC and high P/E (280) indicating overvaluation risk | Solid market position with favorable P/E (11.52) and strong service revenue (2.4B) |
Key takeaways: Trimble demonstrates stronger diversification, profitability, and market position despite a slightly unfavorable ROIC trend, whereas Coherent faces profitability challenges with declining returns and value destruction risks. Investors should weigh Trimble’s robust fundamentals against Coherent’s financial struggles and high valuation.
Risk Analysis
Below is a comparative table outlining key risks for Coherent, Inc. (COHR) and Trimble Inc. (TRMB) based on the most recent available data in 2026:
| Metric | Coherent, Inc. (COHR) | Trimble Inc. (TRMB) |
|---|---|---|
| Market Risk | High beta (1.835) indicating higher volatility | Moderately high beta (1.589), moderate volatility |
| Debt Level | Moderate debt-to-equity (0.48), debt-to-assets 26.11% | Lower debt-to-equity (0.26), debt-to-assets 15.96% |
| Regulatory Risk | Moderate, in technology and laser manufacturing | Moderate, operating in tech solutions with broad applications |
| Operational Risk | Moderate due to product complexity and OEM reliance | Moderate, diversified segments but dependent on software and hardware integration |
| Environmental Risk | Moderate, laser manufacturing with some environmental controls required | Moderate, precision agriculture and infrastructure solutions with environmental impacts |
| Geopolitical Risk | Moderate, global sales with exposure to international markets | Moderate, international operations with supply chain dependencies |
In synthesis, Coherent, Inc. exhibits higher market risk due to its elevated beta and slightly greater leverage, which could impact its financial stability in volatile markets. Trimble shows stronger financial stability with lower leverage and higher interest coverage, reducing its debt risk. The most impactful risk for both companies remains market volatility and operational complexity, especially given their exposure to technology sector fluctuations and global supply chains. Investors should weigh these risks carefully, considering Trimble’s favorable financial ratios versus Coherent’s higher risk profile.
Which Stock to Choose?
Coherent, Inc. (COHR) shows a favorable income statement with strong revenue and profit growth over the past year, yet it has an unfavorable long-term net income trend. Its financial ratios are slightly unfavorable, reflecting low profitability and high valuation multiples, while maintaining a solid liquidity and moderate debt profile. The company’s rating is very favorable overall, supported by strong financial health scores but challenged by value destruction indicated by declining ROIC versus WACC.
Trimble Inc. (TRMB) demonstrates a favorable income statement marked by consistent net income and margin growth over the overall period despite slightly negative recent revenue growth. Its financial ratios are favorable, with robust profitability, conservative debt levels, and efficient asset use, coupled with a very favorable rating. However, like COHR, TRMB faces value destruction concerns with a declining ROIC below its cost of capital, balanced by strong financial stability scores.
For investors prioritizing growth potential, COHR’s recent revenue and profit acceleration might appear attractive despite its weaker profitability ratios and value destruction signals. Conversely, TRMB’s stronger profitability ratios and financial stability could be more appealing for those favoring quality and moderate risk. Both companies show very favorable ratings but have moat challenges, suggesting that an investor’s risk tolerance and strategy could influence which stock may appear more suitable.
Disclaimer: Investment carries a risk of loss of initial capital. The past performance is not a reliable indicator of future results. Be sure to understand risks before making an investment decision.
Go Further
I encourage you to read the complete analyses of Coherent, Inc. and Trimble Inc. to enhance your investment decisions: