Home > Comparison > Technology > COHR vs TDY
The strategic rivalry between Coherent, Inc. and Teledyne Technologies shapes the competitive landscape of the Technology sector’s hardware and equipment industry. Coherent operates as a specialized laser technology provider, focusing on precision optics and OEM laser sources. In contrast, Teledyne offers a diversified portfolio spanning instrumentation, digital imaging, aerospace, and defense electronics. This analysis assesses which company’s operational model delivers superior risk-adjusted returns for a balanced investment portfolio.
Table of contents
Companies Overview
Coherent, Inc. and Teledyne Technologies Incorporated represent key players in the hardware and equipment sector, shaping industrial and scientific innovation.
Coherent, Inc.: Laser Technology Pioneer
Coherent, Inc. dominates the laser technology market, generating revenue primarily through OEM laser sources and industrial laser systems. Its focus in 2026 remains on precision optics and laser-based solutions for microelectronics, materials processing, and scientific research. As a subsidiary of II-VI Incorporated, Coherent leverages its strong R&D capabilities to maintain technological leadership.
Teledyne Technologies Incorporated: Industrial Tech Integrator
Teledyne Technologies Incorporated leads in providing instrumentation and digital imaging technologies across industrial, aerospace, and defense sectors. Its core revenue stems from monitoring instruments, digital sensors, and electronic components. In 2026, Teledyne emphasizes systems engineering and advanced electronics for defense and environmental applications, capitalizing on its diversified product portfolio and global reach.
Strategic Collision: Similarities & Divergences
Coherent and Teledyne share a foundation in hardware innovation but diverge sharply in approach. Coherent pursues a focused laser-centric model, while Teledyne embraces a broad, integrated multi-segment platform. Their primary battleground lies in industrial and scientific instrumentation markets. Coherent attracts investors seeking concentrated tech expertise; Teledyne appeals to those valuing strategic diversification and defense exposure.
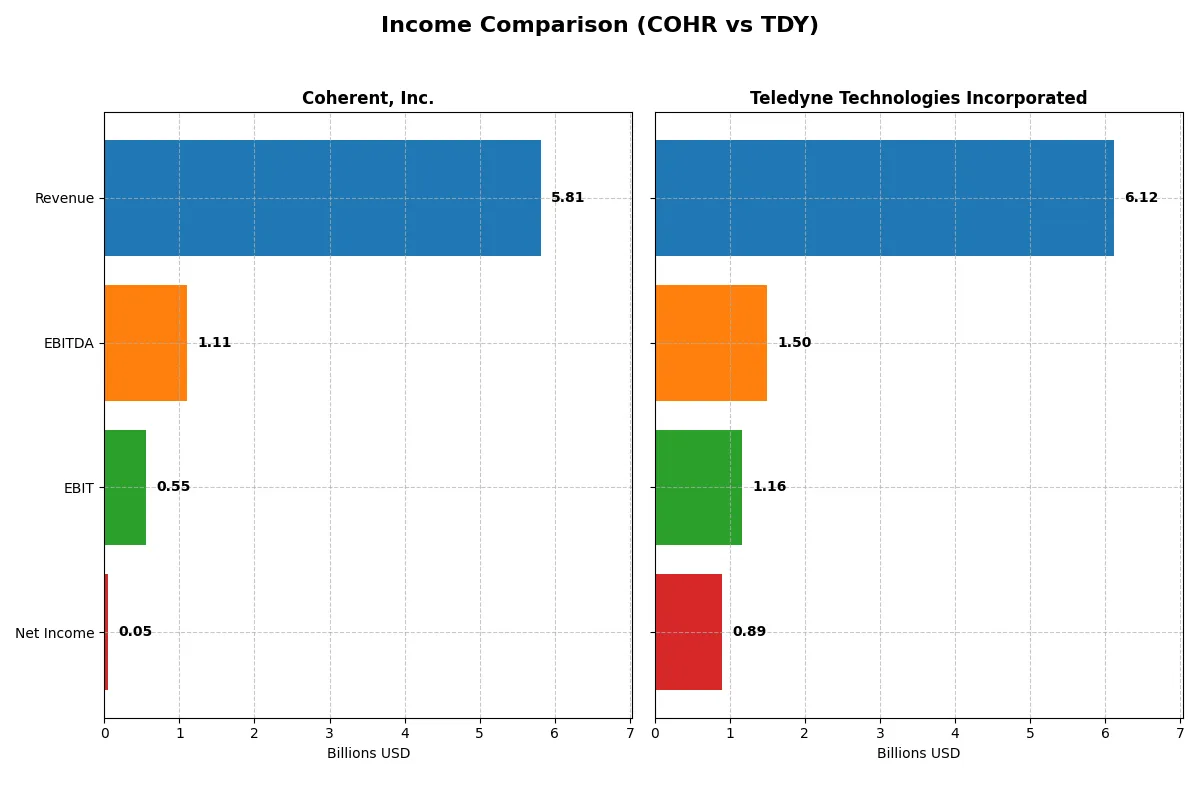
Income Statement Comparison
This data dissects the core profitability and scalability of both corporate engines to reveal who dominates the bottom line:
| Metric | Coherent, Inc. (COHR) | Teledyne Technologies Incorporated (TDY) |
|---|---|---|
| Revenue | 5.81B | 6.12B |
| Cost of Revenue | 3.75B | 3.72B |
| Operating Expenses | 1.51B | 1.25B |
| Gross Profit | 2.06B | 2.40B |
| EBITDA | 1.11B | 1.50B |
| EBIT | 552M | 1.16B |
| Interest Expense | 243M | 60M |
| Net Income | 49M | 895M |
| EPS | -0.52 | 18.88 |
| Fiscal Year | 2025 | 2025 |
Income Statement Analysis: The Bottom-Line Duel
This income statement comparison reveals which company runs a more efficient and profitable corporate engine in the current market cycle.
Coherent, Inc. Analysis
Coherent’s revenue climbed 23% in the latest year, reaching $5.8B, with gross margins steady at 35%. EBIT surged 348%, yet net income remains minimal at $49M, reflecting margin pressure and high expenses. Despite strong top-line momentum, the net margin of 0.85% signals ongoing profitability challenges.
Teledyne Technologies Incorporated Analysis
Teledyne posted $6.1B revenue in 2025, growing 8% year-over-year with a robust gross margin of 39%. EBIT margin improved to nearly 19%, driving a solid net income of $895M and a net margin of 14.6%. The company sustains healthy profit growth and operational efficiency with consistent margin expansion.
Margin Strength vs. Growth Momentum
Teledyne clearly outperforms Coherent in profitability and margin stability, delivering superior net income and margin expansion over time. Coherent shows impressive revenue and EBIT growth but struggles with converting that into bottom-line profits. Investors seeking steady, high-margin earnings will find Teledyne’s profile more compelling.
Financial Ratios Comparison
These vital ratios act as a diagnostic tool to expose the underlying fiscal health, valuation premiums, and capital efficiency of the companies compared:
| Ratios | Coherent, Inc. (COHR) | Teledyne Technologies Inc. (TDY) |
|---|---|---|
| ROE | 0.6% | 8.5% |
| ROIC | 1.3% | 6.8% |
| P/E | 280x | 27x |
| P/B | 1.7x | 2.3x |
| Current Ratio | 2.19 | 1.64 |
| Quick Ratio | 1.39 | 1.08 |
| D/E | 0.48 | 0.24 |
| Debt-to-Assets | 26.1% | 16.2% |
| Interest Coverage | 2.26x | 19.29x |
| Asset Turnover | 0.39 | 0.40 |
| Fixed Asset Turnover | 3.09 | 7.29 |
| Payout ratio | 23.2% | 0% |
| Dividend yield | 0.08% | 0% |
| Fiscal Year | 2025 | 2025 |
Efficiency & Valuation Duel: The Vital Signs
Ratios act as the company’s DNA, uncovering hidden risks and operational strengths essential to assessing investment quality.
Coherent, Inc.
Coherent’s profitability underperforms with a low ROE of 0.61% and net margin at 0.85%, signaling weak operational efficiency. The valuation is stretched, reflected by an extremely high P/E of 280. Dividend yield is minimal at 0.08%, suggesting limited shareholder returns and a focus on reinvestment in R&D for growth.
Teledyne Technologies Incorporated
Teledyne posts a healthier net margin of 14.63% and a solid ROE of 8.51%, indicating more robust profitability. Its P/E of 27.35 shows a more reasonable valuation but still not cheap. The company pays no dividend, implying reinvestment into growth initiatives, supported by favorable leverage and interest coverage metrics.
Premium Valuation vs. Operational Safety
Teledyne balances profitability and valuation more effectively than Coherent, which suffers from poor returns and an inflated P/E. Investors seeking operational safety and moderate valuation likely prefer Teledyne’s profile, while Coherent’s stretched valuation and weak returns suggest higher risk.
Which one offers the Superior Shareholder Reward?
I see Coherent, Inc. (COHR) pays a modest dividend yield of 0.08% with a 23% payout ratio, signaling cautious income distribution supported by free cash flow. Its buyback program appears limited, reflecting financial prudence amid volatile margins and earnings. Teledyne Technologies (TDY) pays no dividends but aggressively repurchases shares, fueling strong total returns. TDY’s free cash flow yield is robust, with buybacks driving capital return alongside reinvestment in high-margin growth. Historically, TDY’s higher operating margins and sustainable buybacks outpace COHR’s restrained distribution. For 2026, I favor TDY’s shareholder reward strategy as more sustainable and compelling for long-term value creation.
Comparative Score Analysis: The Strategic Profile
The radar chart reveals the fundamental DNA and trade-offs of Coherent, Inc. and Teledyne Technologies Incorporated, highlighting their financial strengths and vulnerabilities:
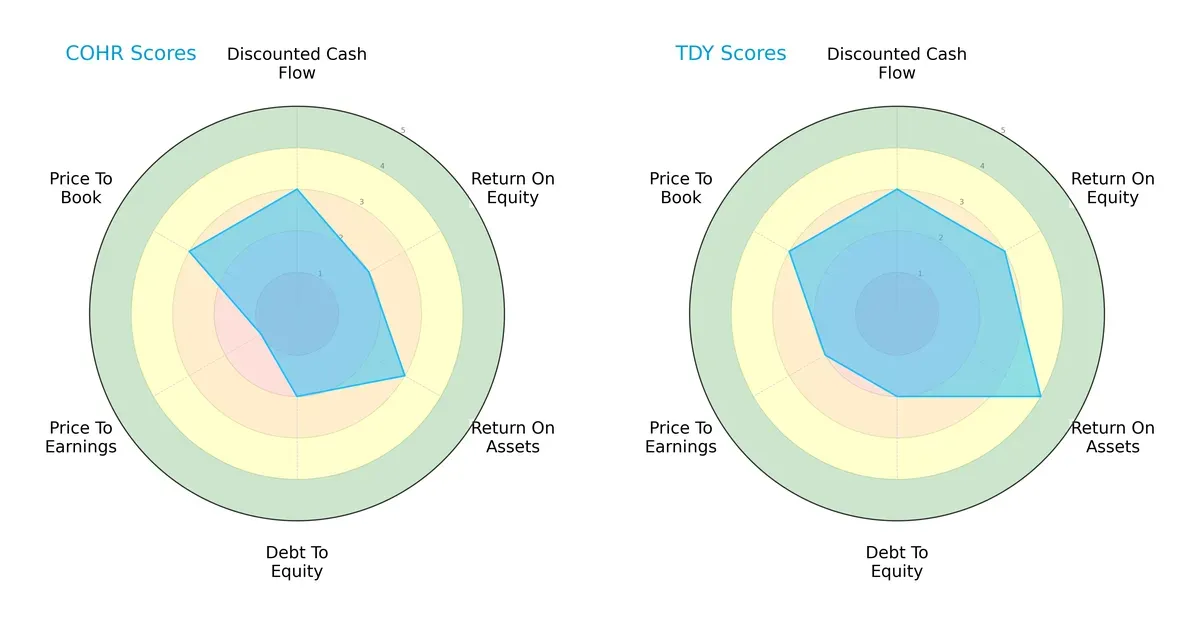
Teledyne leads with a stronger overall score (3 vs. 2) and outperforms Coherent on ROE (3 vs. 2) and ROA (4 vs. 3), signaling superior profitability and asset efficiency. Both share moderate debt-to-equity scores (2), but Coherent’s valuation metrics lag, with a very unfavorable P/E score (1) versus Teledyne’s moderate (2). Teledyne presents a more balanced financial profile, while Coherent relies heavily on asset utilization and book value advantages.
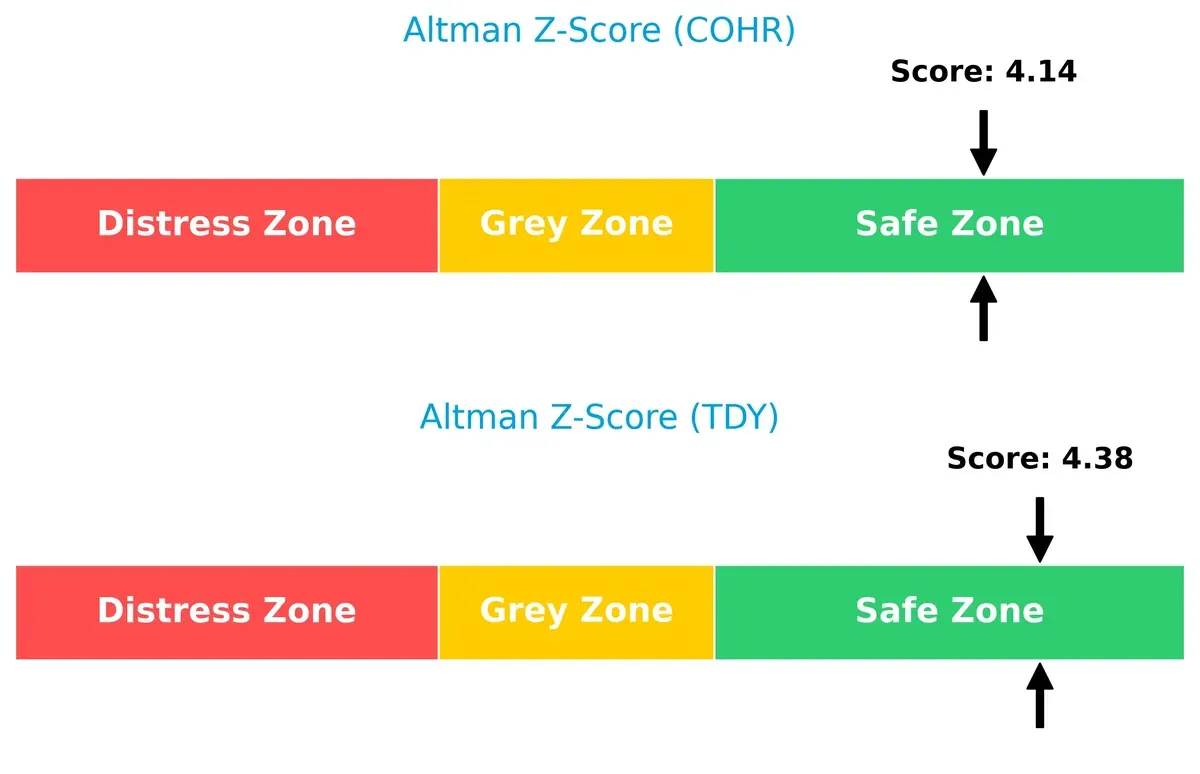
Bankruptcy Risk: Solvency Showdown
Teledyne (4.38) and Coherent (4.14) both reside comfortably in the safe zone for Altman Z-Scores, indicating strong solvency and low bankruptcy risk in this cycle:
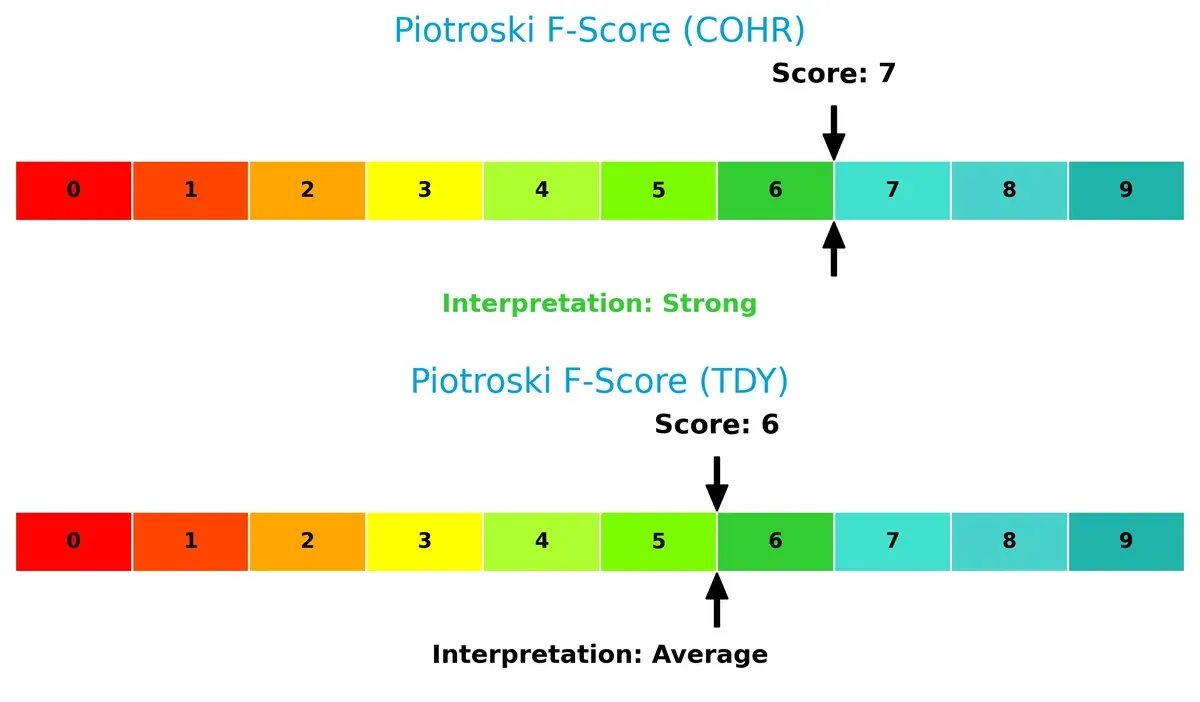
Financial Health: Quality of Operations
Coherent scores a robust 7 on the Piotroski scale, indicating strong financial health and operational quality. Teledyne scores slightly lower at 6, signaling solid but less stellar fundamentals:
How are the two companies positioned?
This section dissects the operational DNA of Coherent and Teledyne by comparing revenue distribution and internal dynamics. The goal is to confront their economic moats to identify which model offers the most resilient, sustainable advantage today.
Revenue Segmentation: The Strategic Mix
This visual comparison dissects how Coherent, Inc. and Teledyne Technologies diversify their income streams and reveals their primary sector bets:
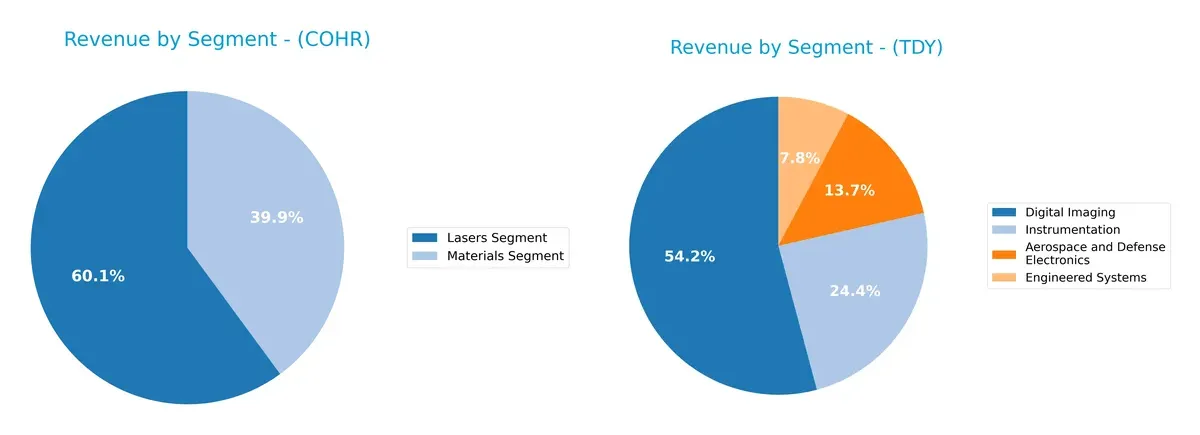
Coherent anchors its revenue predominantly in Lasers at $1.43B, with Materials contributing $954M, showing moderate diversification. Teledyne pivots on Digital Imaging, which dwarfs other segments at $3.07B, while Aerospace & Defense Electronics, Instrumentation, and Engineered Systems collectively diversify its base. Teledyne’s broad footprint reduces concentration risk, unlike Coherent’s reliance on lasers, which may expose it to cyclical tech shifts.
Strengths and Weaknesses Comparison
This table compares the Strengths and Weaknesses of Coherent, Inc. and Teledyne Technologies Incorporated:
Coherent, Inc. Strengths
- Strong current and quick ratios indicating solid short-term liquidity
- Moderate debt-to-equity and debt-to-assets ratios show controlled leverage
- Favorable fixed asset turnover signals efficient use of property and equipment
- Diverse revenue from Lasers and Materials segments
- Significant North American and global presence including China and Europe
Teledyne Technologies Incorporated Strengths
- Higher net margin indicating stronger profitability
- Favorable interest coverage ratio reduces default risk
- Strong fixed asset turnover shows efficient asset use
- Broad product diversification across Aerospace, Digital Imaging, Engineered Systems, Instrumentation
- Extensive geographic reach including US, Europe, and Asia
Coherent, Inc. Weaknesses
- Unfavorable net margin, ROE, and ROIC indicate weak profitability and capital efficiency
- Very high WACC compared to ROIC suggests value destruction
- Extremely high P/E ratio implies overvaluation or low earnings
- Low dividend yield may reduce income appeal
- Low asset turnover points to underutilized assets
Teledyne Technologies Incorporated Weaknesses
- ROE is below industry average, raising concerns on equity returns
- P/E ratio still elevated, limiting valuation upside
- Dividend yield at zero may deter income investors
- Asset turnover slightly unfavorable indicating room for operational improvement
Coherent struggles with profitability and capital efficiency despite strong liquidity and asset management. Teledyne demonstrates better profitability and diversification but faces valuation and return on equity challenges. Both companies show strengths in global reach and product breadth, influencing their strategic focus areas.
The Moat Duel: Analyzing Competitive Defensibility
A structural moat is the only reliable shield protecting long-term profits from relentless competitive erosion. Let’s dissect the defenses of Coherent and Teledyne:
Coherent, Inc.: Intangible Assets and Specialized Technology
Coherent’s moat stems from proprietary laser technology and specialized OEM solutions. Its financials show stable margins but declining ROIC signals weakening capital efficiency. New industrial applications in 2026 could either reinforce or further strain this moat.
Teledyne Technologies: Diversified Engineering and Integration Expertise
Teledyne’s moat lies in its diversified tech portfolio and systems integration capabilities, contrasting Coherent’s niche focus. Its improving ROIC and strong EBIT margins demonstrate rising value creation. Expansion into aerospace and defense markets may deepen its competitive edge in 2026.
Precision Engineering vs. Diversified Integration
Teledyne holds the wider and more durable moat with growing capital returns and diverse market exposure. Coherent’s shrinking ROIC warns of value destruction. Teledyne is better positioned to defend and expand its market share.
Which stock offers better returns?
The past year has seen Coherent, Inc. surge sharply, outpacing Teledyne Technologies with notable acceleration and sustained buyer dominance in trading volumes.
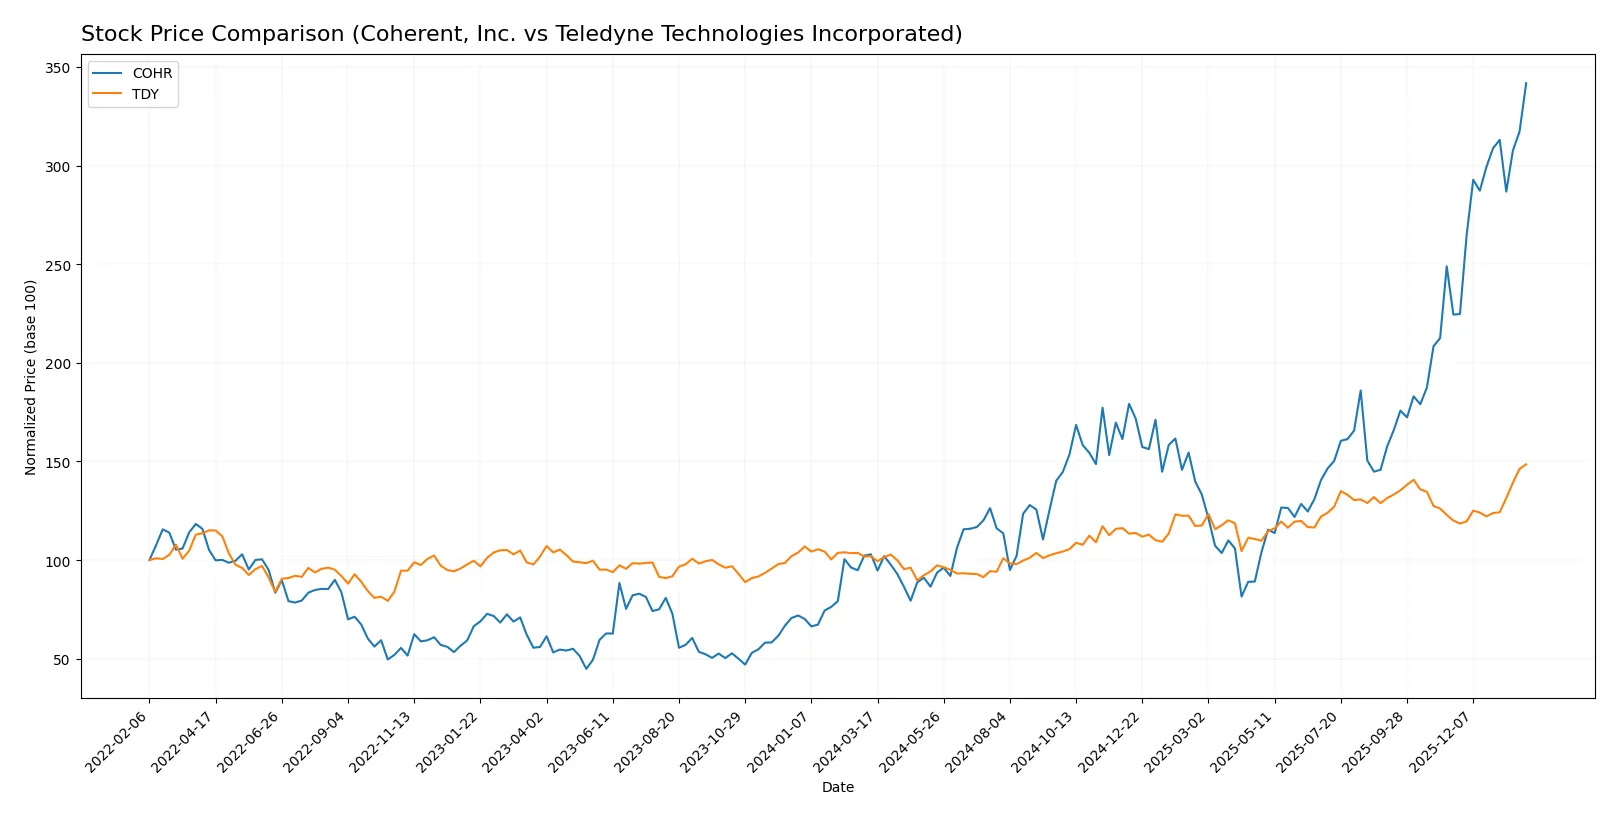
Trend Comparison
Coherent, Inc. posted a 232.26% price increase over 12 months, confirming a strong bullish trend with accelerating momentum and a high of 212.18. Volatility remains moderate with a 37.42 standard deviation.
Teledyne Technologies gained 45.62% in the same period, also bullish with acceleration. It experienced higher volatility (58.2 std dev) and a peak price of 620.3.
Coherent’s return substantially outperformed Teledyne’s, delivering the highest market performance despite Teledyne’s greater price level and volatility.
Target Prices
Analysts present a solid target price consensus for Coherent, Inc. and Teledyne Technologies Incorporated.
| Company | Target Low | Target High | Consensus |
|---|---|---|---|
| Coherent, Inc. | 190 | 235 | 210 |
| Teledyne Technologies Incorporated | 599 | 720 | 638.5 |
Coherent’s consensus target of $210 aligns closely with its current price near $212, suggesting limited upside. Teledyne’s target consensus of $638.5 stands above its $620 price, indicating moderate upside potential.

Don’t Let Luck Decide Your Entry Point
Optimize your entry points with our advanced ProRealTime indicators. You’ll get efficient buy signals with precise price targets for maximum performance. Start outperforming now!
How do institutions grade them?
The following tables summarize recent institutional grades for Coherent, Inc. and Teledyne Technologies Incorporated:
Coherent, Inc. Grades
This table shows recent grades from reputable financial institutions for Coherent, Inc.
| Grading Company | Action | New Grade | Date |
|---|---|---|---|
| Morgan Stanley | Maintain | Equal Weight | 2026-01-30 |
| Citigroup | Maintain | Buy | 2026-01-26 |
| Susquehanna | Maintain | Positive | 2026-01-22 |
| Stifel | Maintain | Buy | 2026-01-22 |
| Barclays | Maintain | Overweight | 2026-01-15 |
| Morgan Stanley | Maintain | Equal Weight | 2025-12-17 |
| JP Morgan | Maintain | Overweight | 2025-12-05 |
| Barclays | Maintain | Overweight | 2025-11-07 |
| Needham | Maintain | Buy | 2025-11-06 |
| Morgan Stanley | Maintain | Equal Weight | 2025-11-06 |
Teledyne Technologies Incorporated Grades
This table shows recent grades from reputable financial institutions for Teledyne Technologies Incorporated.
| Grading Company | Action | New Grade | Date |
|---|---|---|---|
| Barclays | Maintain | Equal Weight | 2026-01-22 |
| Needham | Maintain | Buy | 2026-01-22 |
| Stifel | Maintain | Buy | 2026-01-22 |
| Citigroup | Maintain | Neutral | 2026-01-13 |
| Barclays | Maintain | Equal Weight | 2026-01-12 |
| Needham | Maintain | Buy | 2025-10-23 |
| Barclays | Maintain | Equal Weight | 2025-10-23 |
| Stifel | Maintain | Buy | 2025-10-23 |
| Morgan Stanley | Maintain | Equal Weight | 2025-10-15 |
| UBS | Maintain | Buy | 2025-07-24 |
Which company has the best grades?
Coherent, Inc. shows a mix of Buy and Overweight grades, with multiple institutions maintaining positive views. Teledyne Technologies also receives Buy ratings but leans more toward Equal Weight. Investors might perceive Coherent’s higher grade consistency as a stronger endorsement.
Risks specific to each company
The following categories identify the critical pressure points and systemic threats facing both firms in the 2026 market environment:
1. Market & Competition
Coherent, Inc.
- Faces intense competition in laser technology with pressure on margins and innovation pace.
Teledyne Technologies Incorporated
- Operates in diverse segments, mitigating risk but competes in specialized industrial and aerospace markets.
2. Capital Structure & Debt
Coherent, Inc.
- Moderate leverage with debt-to-equity at 0.48; interest coverage ratio is low at 2.27, signaling caution.
Teledyne Technologies Incorporated
- Lower leverage with debt-to-equity at 0.24; strong interest coverage ratio at 19.47, indicating financial stability.
3. Stock Volatility
Coherent, Inc.
- High beta of 1.835 implies significant stock price volatility and market sensitivity.
Teledyne Technologies Incorporated
- Lower beta of 1.027 suggests more stable stock price movements relative to the market.
4. Regulatory & Legal
Coherent, Inc.
- Exposure to export controls and technology regulations in laser and optics markets.
Teledyne Technologies Incorporated
- Faces complex regulations in defense and aerospace sectors, increasing compliance costs and risks.
5. Supply Chain & Operations
Coherent, Inc.
- Supply chain risks linked to precision component sourcing and manufacturing scale.
Teledyne Technologies Incorporated
- Diverse operations reduce single-point supply risks but require complex logistical coordination.
6. ESG & Climate Transition
Coherent, Inc.
- Moderate ESG risks; energy-intensive manufacturing challenges amid climate regulations.
Teledyne Technologies Incorporated
- Increasing focus on sustainable aerospace and defense solutions; moderate transition risks.
7. Geopolitical Exposure
Coherent, Inc.
- International sales expose it to trade tensions and export restrictions, notably with China.
Teledyne Technologies Incorporated
- Global defense contracts and industrial operations expose it to geopolitical uncertainties and sanctions.
Which company shows a better risk-adjusted profile?
Coherent’s biggest risk is its high stock volatility and low profitability metrics, straining investor confidence. Teledyne’s main risk lies in regulatory complexity and geopolitical exposure inherent in defense sectors. Overall, Teledyne offers a stronger risk-adjusted profile, supported by a safer capital structure, higher interest coverage, and lower beta. Its robust Altman Z-score and Piotroski strength confirm greater financial stability, justifying my preference for Teledyne amid today’s market uncertainties.
Final Verdict: Which stock to choose?
Coherent, Inc. (COHR) stands out for its impressive revenue and gross profit growth, showcasing a strong operational momentum. Its superpower lies in efficient capital deployment reflected in solid cash flow management. However, its declining profitability and value destruction signal a point of vigilance. COHR suits investors pursuing aggressive growth who can tolerate near-term volatility.
Teledyne Technologies Incorporated (TDY) offers a robust strategic moat with consistent free cash flow generation and expanding profitability. Its advantage stems from diversified industrial exposure and improving return on capital, providing a relatively safer profile than COHR. TDY fits well within GARP portfolios that seek steady growth balanced with financial discipline.
If you prioritize rapid growth and are comfortable with higher risk, COHR’s accelerating top-line and cash flow dynamics make it a compelling scenario despite its profitability challenges. However, if you seek better stability and a more established economic moat, TDY outshines as the choice due to its consistent returns and healthier balance sheet metrics. Each stock caters to distinct investor profiles.
Disclaimer: Investment carries a risk of loss of initial capital. The past performance is not a reliable indicator of future results. Be sure to understand risks before making an investment decision.
Go Further
I encourage you to read the complete analyses of Coherent, Inc. and Teledyne Technologies Incorporated to enhance your investment decisions: