Home > Comparison > Technology > TEL vs COHR
The strategic rivalry between TE Connectivity Ltd. and Coherent, Inc. shapes the evolution of the technology hardware sector. TE Connectivity operates as a global industrial and transportation solutions manufacturer, while Coherent specializes in laser technologies and precision optics. This analysis pits TE’s diversified connectivity solutions against Coherent’s high-tech laser systems to assess which offers superior risk-adjusted returns. I will determine the optimal corporate trajectory for a balanced, forward-looking portfolio.
Table of contents
Companies Overview
TE Connectivity Ltd. and Coherent, Inc. each play critical roles in the hardware and equipment sector with distinct market footprints.
TE Connectivity Ltd.: Global Connectivity Specialist
TE Connectivity Ltd. dominates as a global provider of connectivity and sensor solutions. Its revenue stems from three segments: Transportation, Industrial, and Communications Solutions, serving automotive, aerospace, energy, and data markets worldwide. In 2026, it prioritizes expanding its sensor technologies and strengthening its direct sales channels across 140 countries to solidify its market position.
Coherent, Inc.: Laser Technology Innovator
Coherent, Inc. leads in laser-based technologies and system solutions across commercial, industrial, and scientific applications. Its revenue primarily derives from OEM Laser Sources and Industrial Lasers & Systems, focusing on microelectronics and materials processing. The company’s 2026 strategy centers on innovation in precision optics and expanding its industrial laser footprint under new ownership by II-VI Incorporated.
Strategic Collision: Similarities & Divergences
TE Connectivity emphasizes a broad, diversified product portfolio with a global direct sales model, while Coherent specializes in niche laser technologies within a focused industrial framework. Both compete in high-tech hardware but target different end markets—connectivity versus laser precision. Their distinct investment profiles reflect TE’s scale and diversification versus Coherent’s innovation-driven growth under a strategic parent company.
Income Statement Comparison
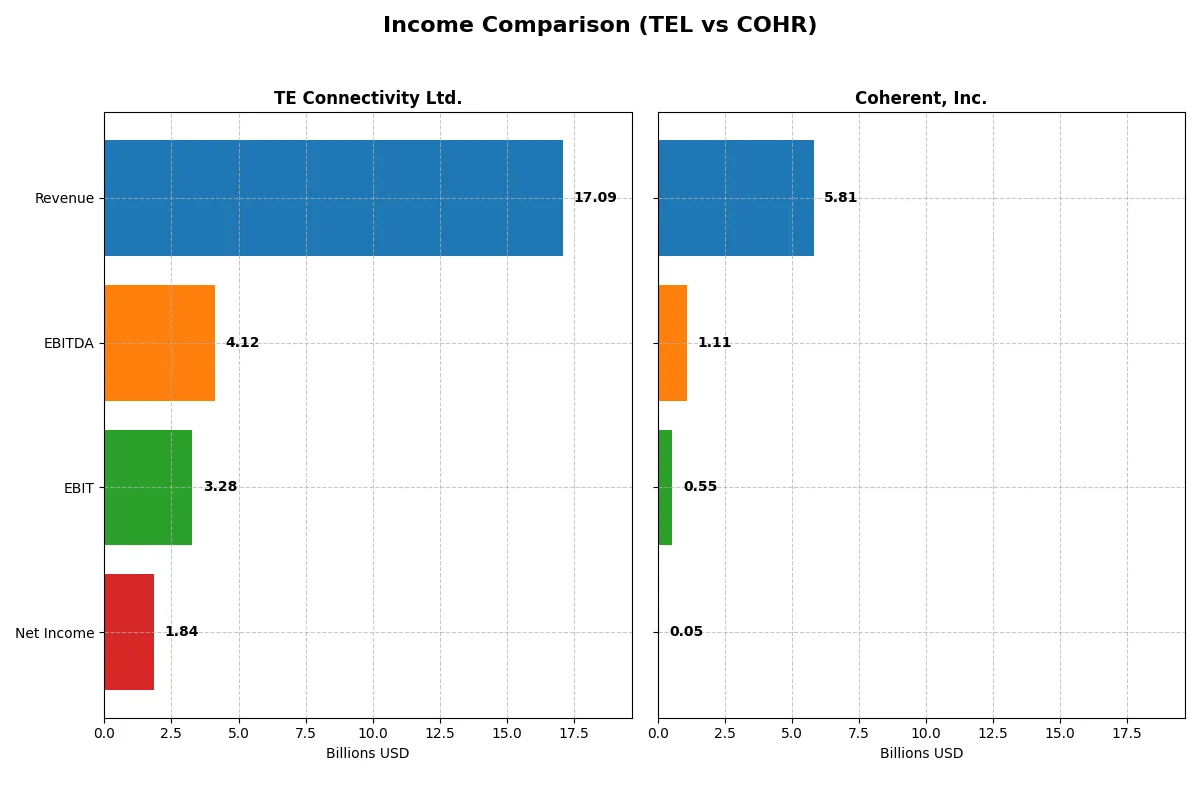
This data dissects the core profitability and scalability of both corporate engines to reveal who dominates the bottom line:
| Metric | TE Connectivity Ltd. (TEL) | Coherent, Inc. (COHR) |
|---|---|---|
| Revenue | 17.1B | 5.8B |
| Cost of Revenue | 11.2B | 3.8B |
| Operating Expenses | 2.7B | 1.5B |
| Gross Profit | 5.9B | 2.1B |
| EBITDA | 4.1B | 1.1B |
| EBIT | 3.3B | 552M |
| Interest Expense | 77M | 243M |
| Net Income | 1.8B | 49M |
| EPS | 6.20 | -0.52 |
| Fiscal Year | 2025 | 2025 |
Income Statement Analysis: The Bottom-Line Duel
This income statement comparison reveals which company runs a more efficient and profitable corporate engine in the current market cycle.
TE Connectivity Ltd. Analysis
TE Connectivity’s revenue grew steadily from $14.9B in 2021 to $17.1B in 2025, reflecting a 14.5% overall increase. Net income, however, declined by 18.5% over the period, dropping to $1.84B in 2025. The company maintains strong gross and net margins at 34.6% and 10.8%, respectively, but recent net margin contraction signals pressure on bottom-line efficiency despite favorable operating income growth.
Coherent, Inc. Analysis
Coherent’s revenue surged 87.1% over five years, reaching $5.81B in 2025, driven by 23.4% growth in the latest year. Gross margin holds firm at 35.4%, slightly above TE’s, but net margin remains slim at 0.85%. Despite impressive EBIT growth of 348% last year, net income declined sharply overall, reflecting high costs and interest expenses that erode profitability and challenge sustainable earnings momentum.
Verdict: Margin Strength vs. Growth Velocity
TE Connectivity delivers superior margin stability and healthier net income levels, while Coherent excels in rapid revenue and EBIT growth but struggles to convert scale into profits. The clear fundamental winner is TE, offering a more attractive profile for investors prioritizing consistent profitability over volatile expansion.
Financial Ratios Comparison
These vital ratios act as a diagnostic tool to expose the underlying fiscal health, valuation premiums, and capital efficiency of the companies compared below:
| Ratios | TE Connectivity Ltd. (TEL) | Coherent, Inc. (COHR) |
|---|---|---|
| ROE | 14.6% | 0.6% |
| ROIC | 8.8% | 1.3% |
| P/E | 35.0 | 279.8 |
| P/B | 5.12 | 1.70 |
| Current Ratio | 1.56 | 2.19 |
| Quick Ratio | 1.03 | 1.39 |
| D/E (Debt-to-Equity) | 0.52 | 0.48 |
| Debt-to-Assets | 26.1% | 26.1% |
| Interest Coverage | 41.7 | 2.26 |
| Asset Turnover | 0.68 | 0.39 |
| Fixed Asset Turnover | 3.96 | 3.09 |
| Payout Ratio | 43.6% | 23.2% |
| Dividend Yield | 1.25% | 0.08% |
| Fiscal Year | 2025 | 2025 |
Efficiency & Valuation Duel: The Vital Signs
Financial ratios act as the company’s DNA, unveiling hidden risks and operational excellence that shape investor confidence and valuation.
TE Connectivity Ltd.
TE Connectivity shows solid profitability with a 14.64% ROE and a 10.78% net margin, signaling operational strength. Its valuation appears stretched with a P/E of 35.0 and P/B of 5.12, above typical sector averages. The company balances this with a 1.25% dividend yield, reflecting steady shareholder returns amid moderate reinvestment.
Coherent, Inc.
Coherent struggles with profitability, posting a weak 0.61% ROE and a narrow 0.85% net margin, indicating operational challenges. Its valuation is highly stretched, with a P/E ratio near 280, far exceeding industry norms. The negligible 0.08% dividend yield suggests limited shareholder returns, as the firm prioritizes R&D for future growth over current payouts.
Premium Valuation vs. Operational Safety
TE Connectivity offers a better risk-reward balance with stronger profitability and moderate dividends despite its rich valuation. Coherent’s extreme valuation and weak returns raise concerns. Investors seeking operational safety and some income may prefer TE, while risk-tolerant growth seekers might consider Coherent’s R&D focus.
Which one offers the Superior Shareholder Reward?
I see TE Connectivity (TEL) offers a more balanced and sustainable shareholder reward model than Coherent, Inc. (COHR). TEL yields 1.25–1.86% dividends with a comfortable payout ratio around 24–44%, supported by strong free cash flow coverage near 77%. Its share buyback program is substantial, enhancing total returns. In contrast, COHR pays a negligible 0.08% dividend with a low payout ratio and weak free cash flow coverage below 40%. COHR relies more on reinvestment but struggles with profitability and cash flow, limiting buybacks. TEL’s disciplined capital allocation and reliable distributions position it as the superior total return choice for 2026 investors.
Comparative Score Analysis: The Strategic Profile
The radar chart reveals the fundamental DNA and trade-offs of TE Connectivity Ltd. and Coherent, Inc., showcasing their financial strengths and valuation nuances:
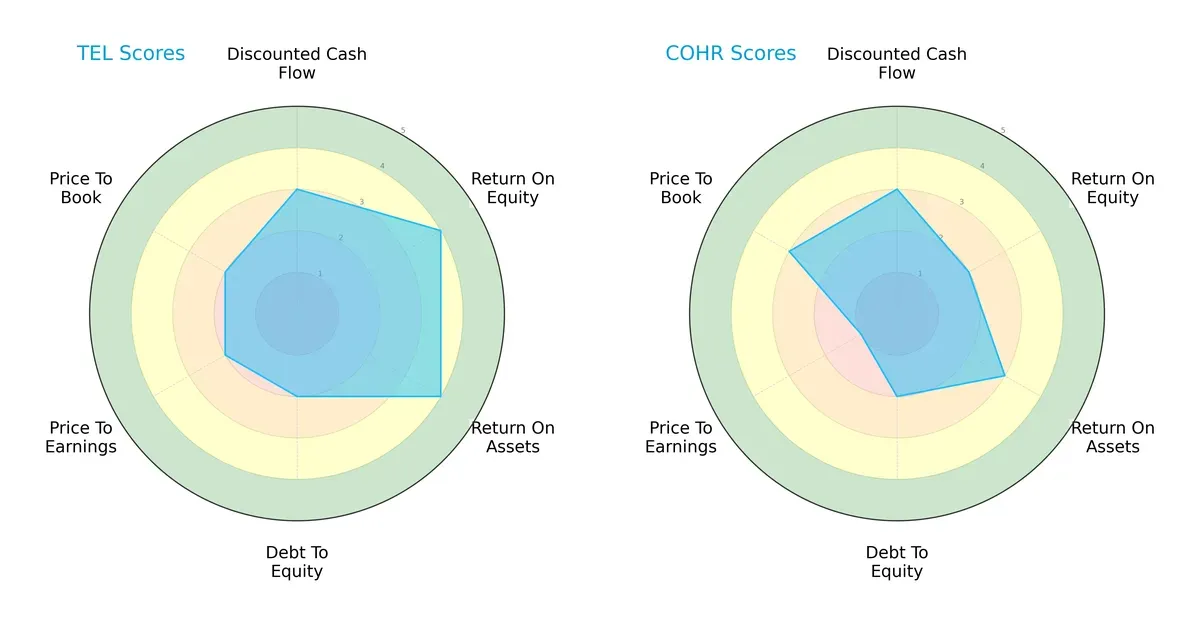
TE Connectivity demonstrates a more balanced profile with strong ROE and ROA scores (4 each), indicating efficient profit generation and asset utilization. Coherent leans on moderate operational returns but shows weakness in valuation metrics, notably a very unfavorable P/E score of 1. Both companies share moderate debt-to-equity risk, yet TE’s consistent edge in returns signals a sturdier operational moat.
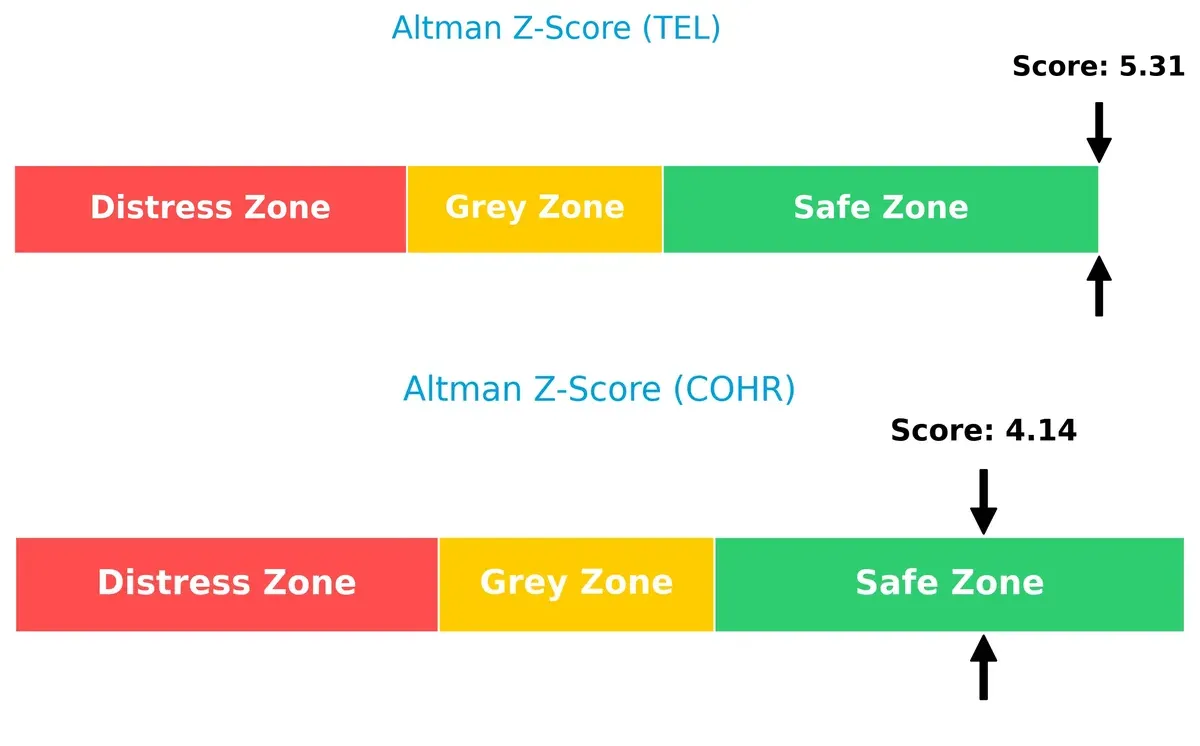
Bankruptcy Risk: Solvency Showdown
TE Connectivity’s Altman Z-Score of 5.3 surpasses Coherent’s 4.1, placing both comfortably in the safe zone but highlighting TE’s superior financial stability and lower bankruptcy risk in this market cycle:
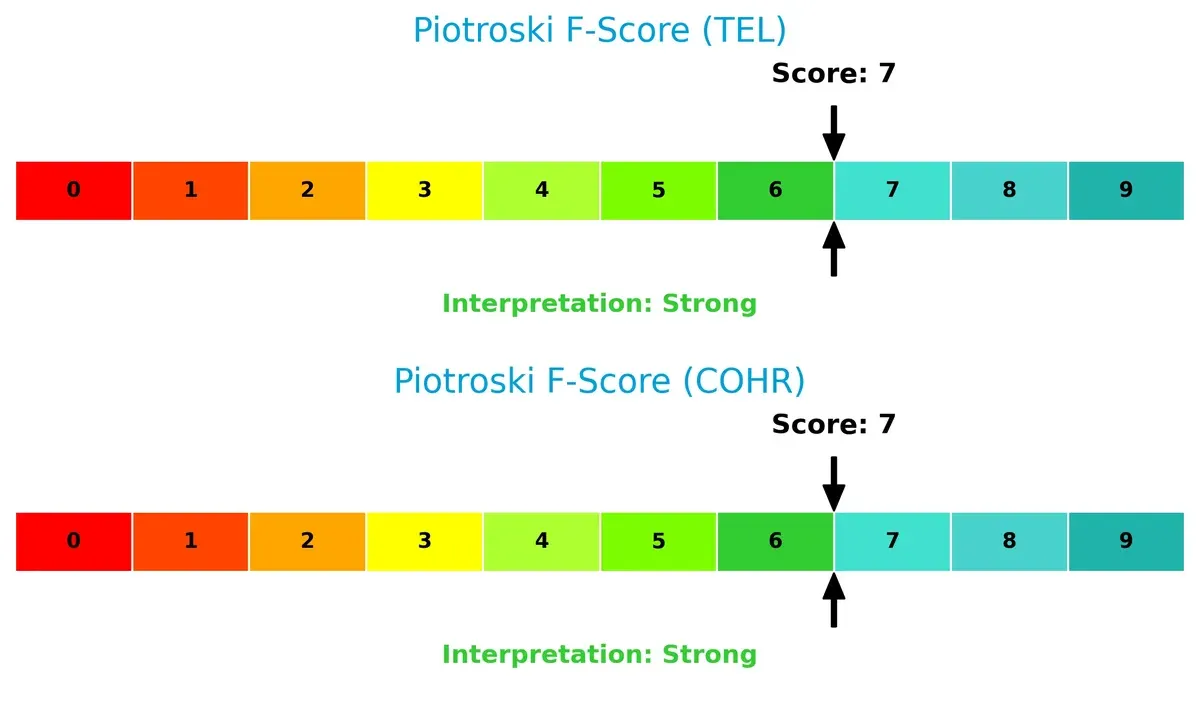
Financial Health: Quality of Operations
Both firms score a solid 7 on the Piotroski F-Score, reflecting strong financial health and operational quality. Neither company exhibits red flags, but this parity suggests investors should weigh other strategic factors carefully:
How are the two companies positioned?
This section dissects the operational DNA of TEL and COHR by comparing their revenue distribution by segment and internal strengths and weaknesses. The goal is to confront their economic moats to reveal which business model offers the most resilient, sustainable competitive advantage today.
Revenue Segmentation: The Strategic Mix
The following visual comparison dissects how TE Connectivity Ltd. and Coherent, Inc. diversify their income streams and highlights where each firm places its primary sector bets:
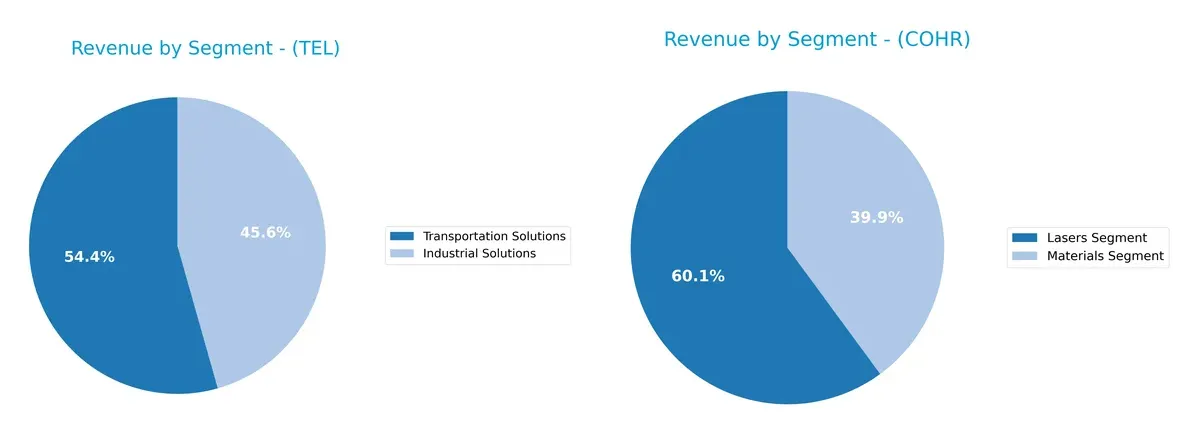
TE Connectivity’s revenue pivots on two robust pillars: Transportation Solutions at $9.4B and Industrial Solutions at $7.9B, reflecting a strong focus but with meaningful diversification. Conversely, Coherent anchors its revenue in two segments—Lasers at $1.4B and Materials at $950M—showing a narrower but balanced exposure. TE’s concentration in transportation suggests infrastructure dominance but carries sector-specific risks, while Coherent’s split mitigates single-segment dependency within a specialized technology niche.
Strengths and Weaknesses Comparison
This table compares the Strengths and Weaknesses of TE Connectivity Ltd. (TEL) and Coherent, Inc. (COHR):
TEL Strengths
- Diverse revenue streams across Industrial and Transportation Solutions
- Strong global presence with significant sales in China, US, and Europe
- Favorable liquidity ratios showing financial stability
- High interest coverage indicating low default risk
- Robust fixed asset turnover signaling operational efficiency
COHR Strengths
- Favorable current and quick ratios reflecting solid short-term liquidity
- Low debt-to-equity ratio supporting conservative leverage
- Geographic revenue diversification including North America, Europe, and Asia
- Favorable fixed asset turnover demonstrating efficient asset use
TEL Weaknesses
- High price-to-earnings and price-to-book ratios potentially indicating overvaluation
- Neutral return on equity and invested capital close to weighted average cost of capital
- Moderate asset turnover suggesting room for improvement in asset utilization
COHR Weaknesses
- Very low profitability metrics including net margin, ROE, and ROIC
- Unfavorable weighted average cost of capital exceeding returns
- Extremely high price-to-earnings ratio raising valuation concerns
- Low dividend yield limiting income appeal
- Unfavorable asset turnover indicating less efficient operations
TEL’s strengths lie in diversified revenue and solid financial health, yet valuation and efficiency metrics temper its profile. COHR faces significant profitability challenges despite good liquidity and asset management, which may impact its strategic flexibility.
The Moat Duel: Analyzing Competitive Defensibility
A strong structural moat is the sole protector of long-term profits against relentless competitive pressures. Let’s dissect two industry players’ moats:
TE Connectivity Ltd.: Diversified Industrial Integration
TE Connectivity’s moat stems from its broad product portfolio and global scale, driving stable margins and solid ROIC historically. However, its declining ROIC warns of margin pressure from intensifying competition in 2026.
Coherent, Inc.: Laser Technology Specialization
Coherent’s moat relies on proprietary laser technologies and innovation. Despite a narrower market, it achieves rapid revenue growth but faces steep ROIC erosion, signaling rising capital intensity and competitive threats ahead.
Verdict: Scale and Diversification vs. Specialized Innovation
Both firms struggle with declining ROIC, signaling value destruction. TE Connectivity’s wider industrial moat offers steadier margin defense. It is better positioned to protect market share amid evolving competition in 2026.
Which stock offers better returns?
Over the past 12 months, TE Connectivity Ltd. and Coherent, Inc. showed strong gains with contrasting recent momentum and volume dynamics. Their price trends reveal divergent trajectories and market interest.
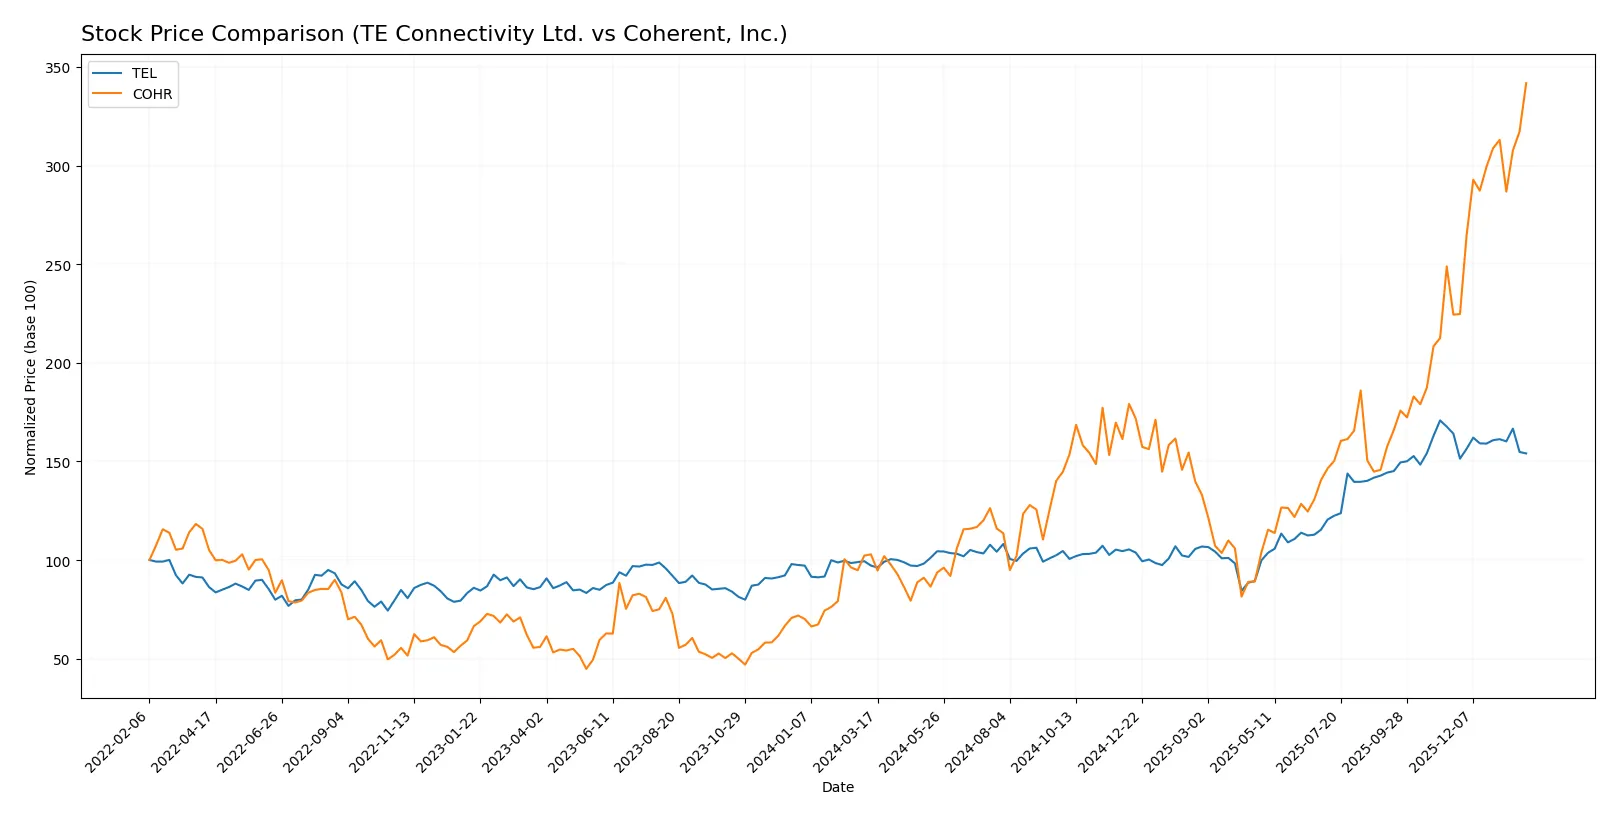
Trend Comparison
TE Connectivity Ltd. posted a 58.53% gain over the past year, marking a bullish trend with decelerating momentum. Price ranged from 122.0 to 247.01, showing volatility with a 34.24 std deviation.
Coherent, Inc. surged 232.26% in the same period, accelerating its bullish trend. It hit a low of 49.26 and peaked at 212.18, with a higher volatility of 37.42 std deviation.
Coherent, Inc. delivered the highest market performance with a significantly larger price increase and accelerating momentum compared to TE Connectivity Ltd.
Target Prices
Analysts present a clear target consensus indicating growth potential for both TE Connectivity Ltd. and Coherent, Inc.
| Company | Target Low | Target High | Consensus |
|---|---|---|---|
| TE Connectivity Ltd. | 238 | 306 | 270.29 |
| Coherent, Inc. | 190 | 235 | 210 |
The target consensus for TE Connectivity exceeds its current price of 223, signaling upside potential. Coherent’s consensus of 210 closely aligns with its current price near 212, suggesting a more balanced outlook.

Don’t Let Luck Decide Your Entry Point
Optimize your entry points with our advanced ProRealTime indicators. You’ll get efficient buy signals with precise price targets for maximum performance. Start outperforming now!
How do institutions grade them?
Here is a comparison of the latest institutional grades for TE Connectivity Ltd. and Coherent, Inc.:
TE Connectivity Ltd. Grades
The table below summarizes recent grade actions from major institutions for TE Connectivity Ltd.:
| Grading Company | Action | New Grade | Date |
|---|---|---|---|
| Oppenheimer | Upgrade | Outperform | 2026-01-27 |
| Barclays | Maintain | Overweight | 2026-01-23 |
| Wells Fargo | Maintain | Equal Weight | 2026-01-22 |
| Truist Securities | Maintain | Hold | 2026-01-22 |
| UBS | Maintain | Buy | 2026-01-14 |
Coherent, Inc. Grades
The following table lists the latest institutional grades for Coherent, Inc.:
| Grading Company | Action | New Grade | Date |
|---|---|---|---|
| Morgan Stanley | Maintain | Equal Weight | 2026-01-30 |
| Citigroup | Maintain | Buy | 2026-01-26 |
| Susquehanna | Maintain | Positive | 2026-01-22 |
| Stifel | Maintain | Buy | 2026-01-22 |
| Barclays | Maintain | Overweight | 2026-01-15 |
Which company has the best grades?
TE Connectivity Ltd. holds a notable upgrade to Outperform from Oppenheimer, coupled with Buy and Overweight ratings. Coherent, Inc. maintains mostly Buy and Overweight ratings but lacks upgrades. TE Connectivity’s recent positive momentum may signal stronger institutional conviction, potentially influencing investor sentiment more favorably.
Risks specific to each company
The following categories identify the critical pressure points and systemic threats facing both firms in the 2026 market environment:
1. Market & Competition
TE Connectivity Ltd.
- Operates in broad hardware and connectivity markets with diversified segments, facing intense competition globally.
Coherent, Inc.
- Focuses on laser technologies, a niche but highly competitive sector with rapid innovation and consolidation risks.
2. Capital Structure & Debt
TE Connectivity Ltd.
- Maintains a moderate debt-to-equity ratio (0.52), solid interest coverage (42.6x), indicating financial stability.
Coherent, Inc.
- Holds similar debt-to-equity (0.48) but lower interest coverage (2.27x), raising concerns about debt servicing capacity.
3. Stock Volatility
TE Connectivity Ltd.
- Beta of 1.24 suggests moderate volatility, reflecting stable investor confidence in a mature industry.
Coherent, Inc.
- Beta of 1.83 signals higher volatility, consistent with sector cyclicality and growth uncertainties.
4. Regulatory & Legal
TE Connectivity Ltd.
- Global footprint exposes it to diverse regulatory regimes, but its established compliance mitigates legal risks.
Coherent, Inc.
- Operates primarily in the U.S., facing strict laser product regulations and export controls that may constrain growth.
5. Supply Chain & Operations
TE Connectivity Ltd.
- Complex global supply chain with multiple sectors, vulnerable to geopolitical disruptions but diversified inputs.
Coherent, Inc.
- Specialized manufacturing reliant on precision components, sensitive to supply shocks and production delays.
6. ESG & Climate Transition
TE Connectivity Ltd.
- Increasing focus on sustainable products and energy-efficient solutions aligns with industry ESG trends.
Coherent, Inc.
- ESG efforts less visible, potential risks from regulatory pressure and investor scrutiny on sustainability.
7. Geopolitical Exposure
TE Connectivity Ltd.
- Swiss base and global sales expose it to currency fluctuations and trade tensions, especially in Asia.
Coherent, Inc.
- U.S.-centric operations face risks from trade policy shifts and technology export restrictions.
Which company shows a better risk-adjusted profile?
TE Connectivity faces manageable risks with strong financial health and diversified markets. Coherent’s higher volatility, weaker profitability, and lower interest coverage increase its risk exposure. TE’s Altman Z-score (5.3) and strong interest coverage highlight resilience. Coherent’s stretched valuation (P/E ~280) and thin margins amplify caution. I favor TE Connectivity for a more balanced risk-return tradeoff in 2026.
Final Verdict: Which stock to choose?
TE Connectivity Ltd. (TEL) stands out as a cash-generating powerhouse with a resilient operational model. Its ability to maintain strong liquidity and favorable margins supports consistent value creation. However, investors should watch its elevated valuation multiples, which temper upside potential. TEL suits portfolios seeking steady income with moderate growth ambitions.
Coherent, Inc. (COHR) leverages a strategic moat rooted in its accelerating revenue growth and innovative R&D investment. Its robust current ratio and moderate leverage provide a cushion against volatility compared to TEL. COHR fits well in growth-at-a-reasonable-price portfolios that tolerate higher execution risk for outsized expansion.
If you prioritize stable cash flow and proven operational efficiency, TEL is the compelling choice due to its consistent value creation and financial strength. However, if you seek dynamic growth fueled by innovation and can handle elevated risk, COHR offers better upside potential and a rapidly expanding market footprint. Both present distinct analytical scenarios tailored to differing investor profiles.
Disclaimer: Investment carries a risk of loss of initial capital. The past performance is not a reliable indicator of future results. Be sure to understand risks before making an investment decision.
Go Further
I encourage you to read the complete analyses of TE Connectivity Ltd. and Coherent, Inc. to enhance your investment decisions: