In the fast-evolving technology sector, Coherent, Inc. (COHR) and Novanta Inc. (NOVT) stand out as key players specializing in advanced hardware and photonics solutions. Both companies serve overlapping markets, focusing on laser technologies and precision components that drive innovation in industrial, medical, and scientific applications. This comparison will help you, the investor, identify which company offers the most compelling opportunity for your portfolio in 2026.

Table of contents
Companies Overview
I will begin the comparison between Coherent, Inc. and Novanta Inc. by providing an overview of these two companies and their main differences.
Coherent, Inc. Overview
Coherent, Inc. specializes in lasers and laser-based technologies serving commercial, industrial, and scientific research markets. It operates through two main segments: Original Equipment Manufacturers (OEM) Laser Sources and Industrial Lasers & Systems. The company is headquartered in Santa Clara, California, and is a subsidiary of II-VI Incorporated, focusing on precision optics, laser tools, and laser measurement products.
Novanta Inc. Overview
Novanta Inc. designs and manufactures photonics, vision, and precision motion components primarily for medical and industrial applications worldwide. Its business segments include Photonics, Vision, and Precision Motion, offering products like laser scanning systems, medical grade visualization solutions, and motion control technologies. Headquartered in Bedford, Massachusetts, Novanta serves customers through various brands and distribution channels.
Key similarities and differences
Both companies operate in the hardware, equipment, and parts industry within the technology sector, focusing on laser and photonics technologies. Coherent emphasizes laser systems and precision optics primarily for OEMs and industrial use, while Novanta has a broader product range covering photonics, vision, and motion components with strong medical market exposure. Coherent is significantly larger in market capitalization and workforce compared to Novanta.
Income Statement Comparison
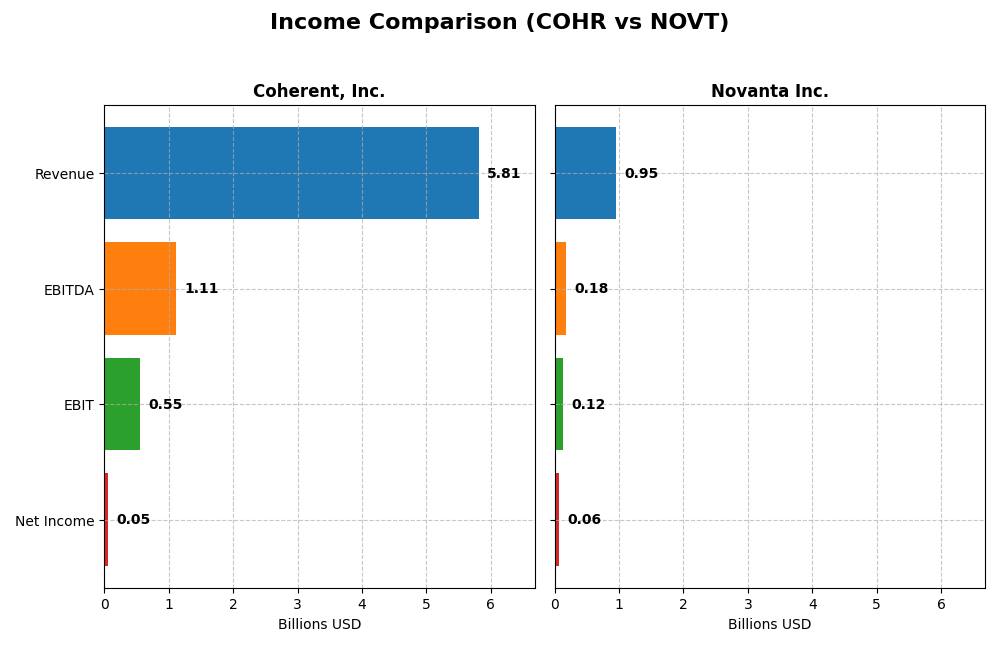
Below is a comparison of the most recent fiscal year income statement metrics for Coherent, Inc. and Novanta Inc., providing key financial figures for investor analysis.
| Metric | Coherent, Inc. (COHR) | Novanta Inc. (NOVT) |
|---|---|---|
| Market Cap | 29.5B | 4.7B |
| Revenue | 5.81B | 949M |
| EBITDA | 1.11B | 180M |
| EBIT | 552M | 124M |
| Net Income | 49.4M | 64.1M |
| EPS | -0.52 | 1.78 |
| Fiscal Year | 2025 | 2024 |
Income Statement Interpretations
Coherent, Inc.
Coherent, Inc. experienced strong revenue growth of 23.4% in the most recent year, reaching $5.81B, with a favorable gross margin of 35.41%. Despite this, net income remained low at $49M, reflecting a net margin of 0.85%, stable but modest. EBIT surged 348%, indicating operational improvements, though net income growth over five years declined significantly.
Novanta Inc.
Novanta Inc. showed steady revenue growth, up 7.7% to $949M in 2024, with a robust gross margin of 44.41% and an EBIT margin of 13.09%. Net income was $64M, with a net margin of 6.75%, though net margin and EPS declined slightly in the past year. Overall, net income and EPS demonstrated positive growth over the five-year period.
Which one has the stronger fundamentals?
Both companies have favorable overall income statement evaluations, with Coherent showing rapid recent growth in revenue and EBIT but struggling with net income stability, while Novanta maintains higher margins and steady income growth. Coherent’s net income volatility contrasts with Novanta’s consistent profitability, making each company’s fundamentals strong in different aspects.
Financial Ratios Comparison
Below is a side-by-side comparison of key financial ratios for Coherent, Inc. (COHR) and Novanta Inc. (NOVT) based on their most recent fiscal year-end data.
| Ratios | Coherent, Inc. (2025 FY) | Novanta Inc. (2024 FY) |
|---|---|---|
| ROE | 0.61% | 8.59% |
| ROIC | 1.31% | 7.19% |
| P/E | 280 | 85.7 |
| P/B | 1.70 | 7.37 |
| Current Ratio | 2.19 | 2.58 |
| Quick Ratio | 1.39 | 1.72 |
| D/E (Debt-to-Equity) | 0.48 | 0.63 |
| Debt-to-Assets | 26.1% | 33.9% |
| Interest Coverage | 2.26 | 3.51 |
| Asset Turnover | 0.39 | 0.68 |
| Fixed Asset Turnover | 3.09 | 6.08 |
| Payout Ratio | 23.2% | 0% |
| Dividend Yield | 0.08% | 0% |
Interpretation of the Ratios
Coherent, Inc.
Coherent, Inc. shows a mixed ratio profile with favorable liquidity ratios (current ratio 2.19, quick ratio 1.39) and manageable debt levels (debt-to-equity 0.48), but weak profitability metrics such as low return on equity (0.61%) and return on invested capital (1.31%). Its extremely high P/E ratio (280) and low dividend yield (0.08%) point to limited shareholder returns, with no dividend paid, likely reflecting reinvestment or operational challenges.
Novanta Inc.
Novanta Inc. presents moderate strength in liquidity (current ratio 2.58, quick ratio 1.72) and a solid fixed asset turnover (6.08), but profitability remains modest with return on equity at 8.59% and a P/E ratio of 85.7. The company does not pay dividends, which may reflect a focus on reinvestment or growth. Debt levels are somewhat higher, with a debt-to-assets ratio near 34%, though interest coverage remains neutral.
Which one has the best ratios?
Both companies have slightly unfavorable overall ratio evaluations. Coherent benefits from stronger liquidity and lower leverage, but suffers from weak profitability and an extremely high valuation multiple. Novanta shows better asset efficiency but mixed profitability and higher valuation concerns. Neither company stands out decisively, as both exhibit strengths and weaknesses in key financial metrics.
Strategic Positioning
This section compares the strategic positioning of Coherent, Inc. and Novanta Inc. regarding market position, key segments, and exposure to technological disruption:
Coherent, Inc.
- Large market cap of 29.5B in hardware with strong NYSE listing, faces high competitive pressure.
- Revenue driven by two main segments: Lasers (1.43B) and Materials (0.95B) serving industrial and scientific applications.
- Operates in laser-based technologies with potential disruption from advanced photonics and precision optics innovations.
Novanta Inc.
- Smaller market cap of 4.7B on NASDAQ, operating in competitive technology hardware sector.
- Diversified segments including Photonics, Vision, and Precision Motion with combined revenues around 0.95B, focusing on medical and industrial OEMs.
- Exposure to disruption through photonics, medical technologies, and robotics integrating new laser and vision systems.
Coherent, Inc. vs Novanta Inc. Positioning
Coherent maintains a concentrated focus on laser systems and materials with large scale operations, while Novanta is more diversified across photonics, vision, and precision motion segments. Coherent’s scale offers potential operational advantages; Novanta’s diversification spreads market risk but with smaller revenues per segment.
Which has the best competitive advantage?
Both companies are currently shedding value as ROIC is below WACC; however, Novanta shows improving profitability trends, whereas Coherent’s profitability is declining, indicating Novanta may have a slightly more favorable competitive position.
Stock Comparison
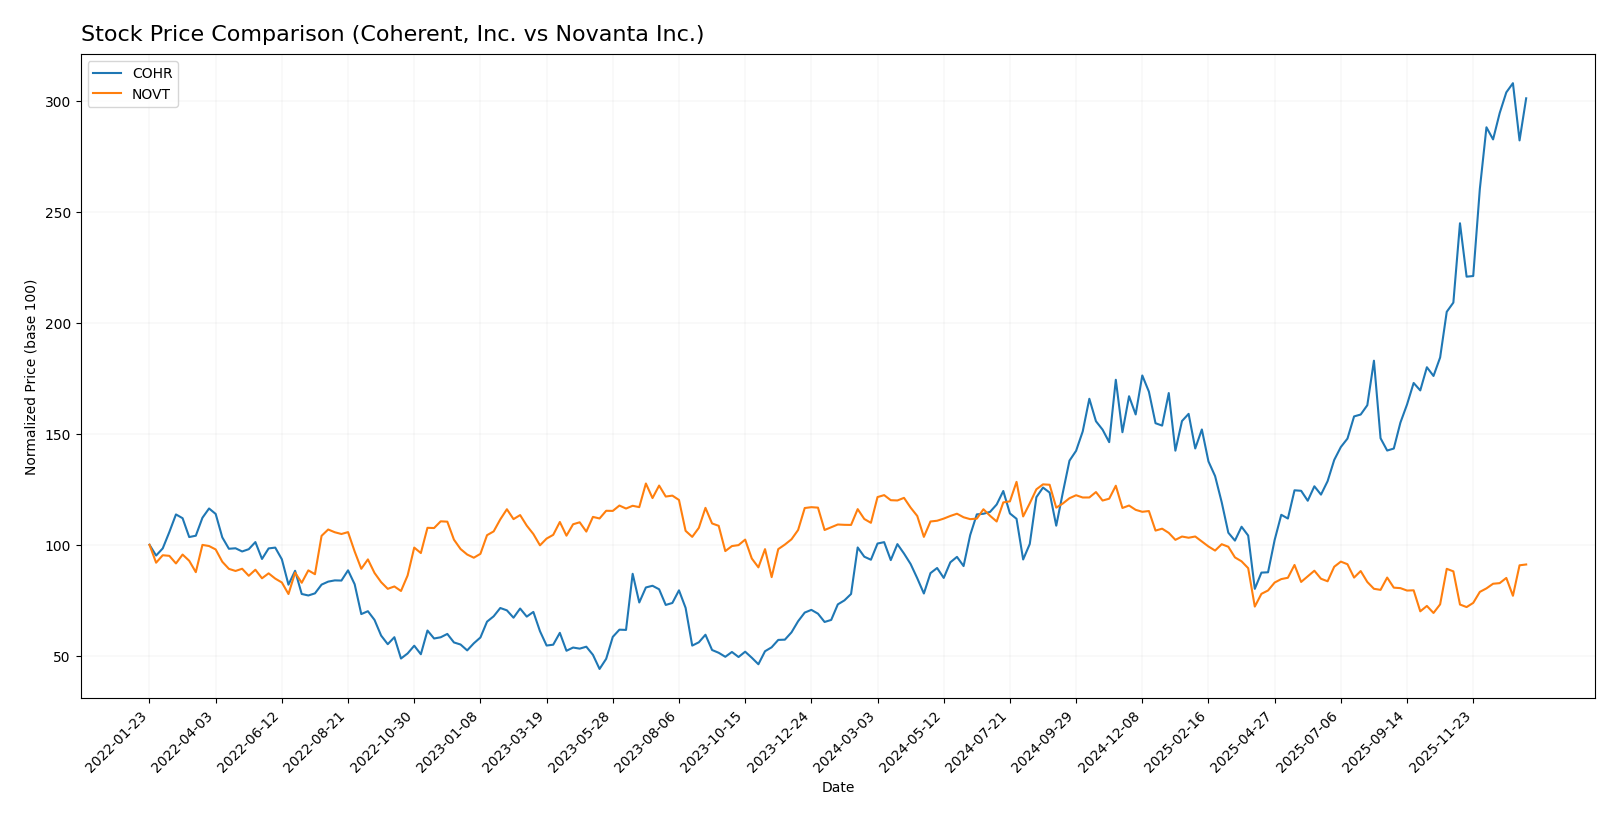
The stock price movements of Coherent, Inc. and Novanta Inc. over the past 12 months reveal contrasting trends, with Coherent showing strong growth and accelerating momentum, while Novanta experiences a declining trajectory despite a recent slight recovery.
Trend Analysis
Coherent, Inc. (COHR) exhibited a robust bullish trend over the past year with a 222.85% price increase, marked by acceleration and a high volatility level (std deviation 34.26). The stock reached a peak of 194.33 and a low of 49.26.
Novanta Inc. (NOVT) showed a bearish trend over the same period, with a 17.07% price decline despite acceleration. The stock’s volatility was moderate (std deviation 25.04), with a highest price of 185.16 and a lowest of 99.96.
Comparing both, Coherent delivered the highest market performance by a wide margin, significantly outperforming Novanta, which faced downward pressure with only a minor recent price recovery.
Target Prices
Analysts provide a clear target price consensus for Coherent, Inc. and Novanta Inc., outlining expected price ranges.
| Company | Target High | Target Low | Consensus |
|---|---|---|---|
| Coherent, Inc. | 210 | 135 | 175 |
| Novanta Inc. | 160 | 160 | 160 |
Coherent’s target consensus at 175 suggests a slight downside compared to its current price of 190.03 USD, while Novanta’s consensus at 160 indicates upside potential from its current 131.47 USD stock price.
Analyst Opinions Comparison
This section compares the analysts’ ratings and financial scores for Coherent, Inc. and Novanta Inc.:
Rating Comparison
COHR Rating
- Rating: B-, classified as very favorable by analysts.
- Discounted Cash Flow Score: Moderate at 3, indicating neutral valuation based on future cash flow.
- ROE Score: Moderate at 2, showing average efficiency in generating profits from equity.
- ROA Score: Moderate at 3, reflecting effective asset utilization.
- Debt To Equity Score: Moderate at 2, indicating balanced financial risk.
- Overall Score: Moderate at 2, summarizing the company’s financial standing.
NOVT Rating
- Rating: C+, also classified as very favorable by analysts.
- Discounted Cash Flow Score: Moderate at 3, indicating neutral valuation based on future cash flow.
- ROE Score: Moderate at 3, showing relatively better efficiency in generating profits from equity.
- ROA Score: Moderate at 3, reflecting effective asset utilization.
- Debt To Equity Score: Very unfavorable at 1, suggesting higher financial risk.
- Overall Score: Moderate at 2, summarizing the company’s financial standing.
Which one is the best rated?
Coherent, Inc. holds a slightly better rating (B-) compared to Novanta’s C+, with both having moderate overall scores. Novanta shows stronger ROE but weaker debt-to-equity, increasing its financial risk relative to Coherent.
Scores Comparison
Here is a comparison of the Altman Z-Score and Piotroski Score for Coherent, Inc. and Novanta Inc.:
Coherent, Inc. Scores
- Altman Z-Score: 3.70, indicating a safe financial zone with low bankruptcy risk.
- Piotroski Score: 7, reflecting strong financial health and good investment potential.
Novanta Inc. Scores
- Altman Z-Score: 5.35, also in a safe zone with very low bankruptcy risk.
- Piotroski Score: 6, showing average financial strength.
Which company has the best scores?
Novanta Inc. has a higher Altman Z-Score than Coherent, indicating slightly better bankruptcy safety. However, Coherent has a stronger Piotroski Score, suggesting better overall financial strength. The scores show strengths for each company in different aspects.
Grades Comparison
Here is a comparison of the recent grades assigned to Coherent, Inc. and Novanta Inc.:
Coherent, Inc. Grades
The table below summarizes recent grades assigned by recognized financial institutions to Coherent, Inc.:
| Grading Company | Action | New Grade | Date |
|---|---|---|---|
| Morgan Stanley | Maintain | Equal Weight | 2025-12-17 |
| JP Morgan | Maintain | Overweight | 2025-12-05 |
| Barclays | Maintain | Overweight | 2025-11-07 |
| Morgan Stanley | Maintain | Equal Weight | 2025-11-06 |
| Stifel | Maintain | Buy | 2025-11-06 |
| Rosenblatt | Maintain | Buy | 2025-11-06 |
| Needham | Maintain | Buy | 2025-11-06 |
| Susquehanna | Maintain | Positive | 2025-10-22 |
| Barclays | Maintain | Overweight | 2025-10-20 |
| Rosenblatt | Maintain | Buy | 2025-10-14 |
Coherent, Inc. shows a consistent pattern of positive ratings with most grades in the Buy or Overweight categories and no downgrades in the latest updates.
Novanta Inc. Grades
The table below summarizes recent grades assigned by recognized financial institutions to Novanta Inc.:
| Grading Company | Action | New Grade | Date |
|---|---|---|---|
| Baird | Maintain | Neutral | 2025-08-11 |
| Baird | Maintain | Neutral | 2025-03-03 |
| Baird | Maintain | Neutral | 2024-11-06 |
| Baird | Maintain | Neutral | 2024-08-07 |
| Baird | Maintain | Neutral | 2023-05-11 |
| Baird | Maintain | Neutral | 2023-05-10 |
| William Blair | Upgrade | Outperform | 2022-05-11 |
| William Blair | Upgrade | Outperform | 2022-05-10 |
| Berenberg | Maintain | Hold | 2020-11-13 |
| Baird | Maintain | Neutral | 2020-05-13 |
Novanta Inc.’s grades have remained mostly Neutral or Hold, with a couple of Outperform upgrades from William Blair in 2022, indicating a stable but more cautious outlook.
Which company has the best grades?
Coherent, Inc. has received consistently higher grades, predominantly Buy and Overweight, compared to Novanta Inc.’s Neutral and Hold ratings. This suggests Coherent is viewed more favorably by analysts, which may influence investor sentiment and portfolio decisions accordingly.
Strengths and Weaknesses
Below is a comparison of key strengths and weaknesses for Coherent, Inc. (COHR) and Novanta Inc. (NOVT), based on their latest financial performance, market position, and operational metrics.
| Criterion | Coherent, Inc. (COHR) | Novanta Inc. (NOVT) |
|---|---|---|
| Diversification | Moderate: Focus on Lasers (1.43B) and Materials (953M) segments | High: Multiple segments including Robotics & Automation (288M), Precision Medicine (250M), and Advanced Surgery (209M) |
| Profitability | Very low net margin (0.85%), ROIC 1.31% — value destroying with declining profitability | Moderate net margin (6.75%), ROIC 7.19% — slightly unfavorable but improving profitability |
| Innovation | Limited recent innovation indicated by declining ROIC and high P/E (280x) | Stronger innovation with growing ROIC trend and diverse high-tech product lines |
| Global presence | Established, but limited global growth signals | Broader global exposure through diversified medical and industrial technology markets |
| Market Share | Significant in lasers and materials, but struggling to create value | Growing presence in precision technologies, robotics, and medical sectors |
In summary, Coherent, Inc. faces challenges with declining profitability and value destruction despite stable segment revenues, while Novanta Inc. shows improving profitability and diversification, positioning it better for future growth despite current slight value erosion.
Risk Analysis
Below is a comparative overview of key risks for Coherent, Inc. (COHR) and Novanta Inc. (NOVT) based on the most recent data available in 2026:
| Metric | Coherent, Inc. (COHR) | Novanta Inc. (NOVT) |
|---|---|---|
| Market Risk | High beta (1.835) indicates elevated volatility and sensitivity to market swings. | Moderately high beta (1.603) suggests notable market sensitivity but less than COHR. |
| Debt Level | Moderate debt-to-equity ratio (0.48) and debt-to-assets (26.11%) with neutral interest coverage (2.27). | Slightly higher leverage, debt/equity at 0.63 and debt-to-assets 33.92%, interest coverage moderate (3.95). |
| Regulatory Risk | Operating globally in tech hardware; potential exposure to export controls and tech regulations. | Similar exposure in photonics and medical tech sectors, subject to medical device and industrial regulations. |
| Operational Risk | Large scale manufacturing and integration risks; complex supply chain with 26K+ employees. | Smaller workforce (~3K) but broad product portfolio increases operational complexity. |
| Environmental Risk | Moderate, with manufacturing footprint and energy use in laser production. | Moderate, with medical and industrial applications requiring compliance with environmental standards. |
| Geopolitical Risk | US-based with international sales; supply chain and sales could be impacted by trade tensions. | Also US-based global operations, similarly exposed to geopolitical tensions affecting supply chains. |
In summary, both companies face significant market risk with above-average volatility. COHR’s lower leverage provides some financial cushioning, while NOVT’s higher debt and interest obligations elevate financial risk. Regulatory and geopolitical factors are impactful for both due to their global footprint and tech focus. I consider market volatility and financial leverage as the most likely and impactful risks to monitor closely.
Which Stock to Choose?
Coherent, Inc. (COHR) shows a favorable income statement with strong recent revenue and profit growth, though its overall profitability and financial ratios remain slightly unfavorable. The company carries manageable debt and holds a very favorable rating despite some operational challenges and a declining return on invested capital indicating value destruction.
Novanta Inc. (NOVT) presents a stable income evolution with mostly favorable margins and moderate growth; its financial ratios are slightly unfavorable overall, reflecting a higher leverage position and valuation concerns. The firm demonstrates a slightly unfavorable moat status but benefits from a very favorable rating and improving profitability trends.
Investors with a preference for growth and recent strong income statement improvements might find Coherent, Inc. more appealing, while those valuing financial stability and improving profitability despite moderate leverage could lean toward Novanta Inc.; the choice may depend on individual risk tolerance and investment strategy.
Disclaimer: Investment carries a risk of loss of initial capital. The past performance is not a reliable indicator of future results. Be sure to understand risks before making an investment decision.
Go Further
I encourage you to read the complete analyses of Coherent, Inc. and Novanta Inc. to enhance your investment decisions: