Coherent, Inc. (COHR) and MKS Inc. (MKSI) are two prominent players in the hardware, equipment, and parts sector, specializing in laser technologies and precision instruments. Both companies serve overlapping markets such as semiconductor manufacturing and industrial applications, leveraging innovation to maintain competitive edges. This article will analyze their strengths and strategies to help you decide which stock might be the most compelling addition to your investment portfolio.
Table of contents
Companies Overview
I will begin the comparison between Coherent, Inc. and MKS Inc. by providing an overview of these two companies and their main differences.
Coherent, Inc. Overview
Coherent, Inc. specializes in lasers, laser-based technologies, and system solutions for commercial, industrial, and scientific applications. Operating through its OEM Laser Sources and Industrial Lasers & Systems segments, it designs and manufactures precision optics, laser tools, and measurement products. Founded in 1966 and headquartered in Santa Clara, California, Coherent serves markets including microelectronics and scientific research.
MKS Inc. Overview
MKS Inc. delivers instruments, systems, and process control solutions for manufacturing processes worldwide. Its offerings include vacuum and pressure control, laser and photonics products, and laser-based systems for PCB manufacturing. Founded in 1961 and based in Andover, Massachusetts, MKS serves semiconductor, industrial, life sciences, research, and defense sectors through diverse sales channels.
Key similarities and differences
Both companies operate in the technology sector within the hardware, equipment, and parts industry, focusing on laser technologies and precision instruments. Coherent emphasizes laser sources and industrial laser systems, while MKS provides a broader range of process control solutions and photonics products. Each targets high-tech manufacturing and research markets but differs in product scope and segment diversification.
Income Statement Comparison
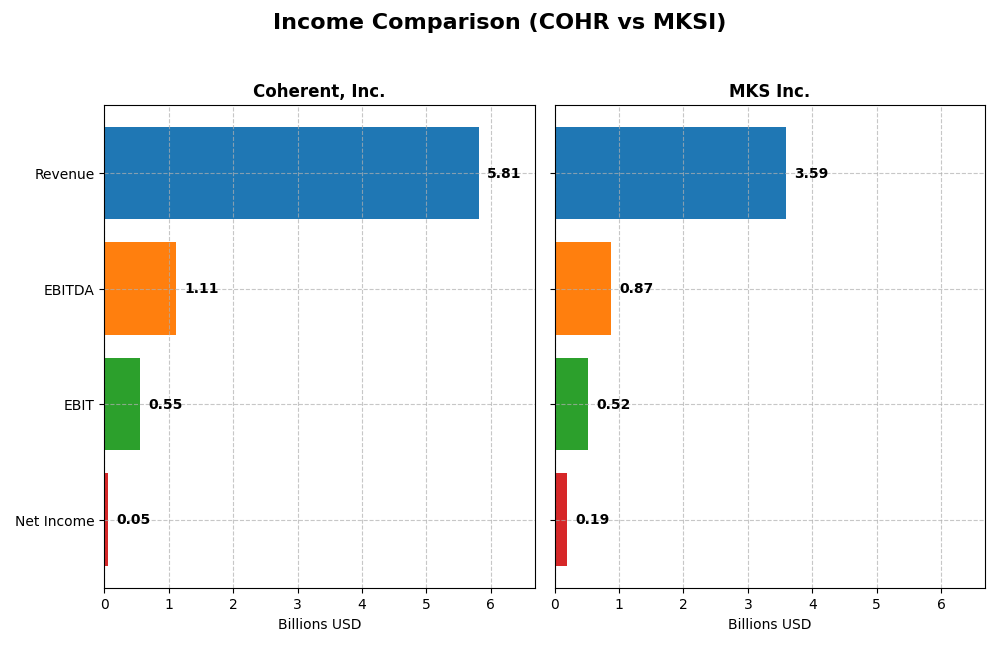
This table presents the most recent fiscal year income statement metrics for Coherent, Inc. and MKS Inc., allowing a direct financial performance comparison.
| Metric | Coherent, Inc. (COHR) | MKS Inc. (MKSI) |
|---|---|---|
| Market Cap | 30.2B | 11.3B |
| Revenue | 5.81B | 3.59B |
| EBITDA | 1.11B | 870M |
| EBIT | 552M | 522M |
| Net Income | 49.4M | 190M |
| EPS | -0.52 | 2.82 |
| Fiscal Year | 2025 | 2024 |
Income Statement Interpretations
Coherent, Inc.
Coherent, Inc. showed a strong revenue increase of 87.07% over 2021-2025, with a significant 23.42% growth in the last year to $5.81B. Gross margin remained favorable at 35.41%, while net income fluctuated, resulting in an overall decline of 83.41% across the period. The latest year saw a sharp EBIT rise of 348.1%, improving operational efficiency despite modest net margin at 0.85%.
MKS Inc.
MKS Inc. reported steady revenue growth of 53.91% from 2020 to 2024, stabilizing near $3.59B in 2024 with a minor 0.99% decrease from the previous year. Gross and EBIT margins are robust at 47.63% and 14.56%, respectively. Net income declined by 45.71% overall, but last year’s net margin and EPS more than doubled, reflecting a strong recovery in profitability despite mixed revenue trends.
Which one has the stronger fundamentals?
Both companies exhibit favorable overall income statement evaluations, with Coherent having a slightly higher percentage of favorable indicators (64.29% vs. 57.14%). Coherent’s rapid revenue and EBIT growth last year contrast with MKS’s more consistent margins and profitability improvements. However, both face net income declines over the full period, indicating challenges in sustaining net earnings despite operational gains.
Financial Ratios Comparison
This table presents the most recent key financial ratios for Coherent, Inc. (COHR) and MKS Inc. (MKSI) based on their fiscal year ending in 2025 and 2024 respectively.
| Ratios | Coherent, Inc. (2025) | MKS Inc. (2024) |
|---|---|---|
| ROE | 0.61% | 8.18% |
| ROIC | 1.28% | 6.31% |
| P/E | 280x | 37x |
| P/B | 1.70x | 3.03x |
| Current Ratio | 2.19 | 3.19 |
| Quick Ratio | 1.39 | 2.04 |
| D/E (Debt to Equity) | 0.48 | 2.06 |
| Debt-to-Assets | 26.1% | 55.6% |
| Interest Coverage | 2.20 | 1.44 |
| Asset Turnover | 0.39 | 0.42 |
| Fixed Asset Turnover | 3.09 | 3.55 |
| Payout Ratio | 23.2% | 31.1% |
| Dividend Yield | 0.08% | 0.84% |
Interpretation of the Ratios
Coherent, Inc.
Coherent, Inc. shows a mixed ratio profile with several unfavorable metrics including a very high P/E of 279.75 and weak profitability indicators such as net margin at 0.85% and ROE at 0.61%. Its liquidity ratios are favorable with a current ratio of 2.19 and debt levels appear manageable. The company does not pay dividends, possibly reflecting reinvestment priorities during a cautious growth phase.
MKS Inc.
MKS Inc. presents predominantly unfavorable ratios, including a high debt-to-equity of 2.06 and debt-to-assets of 55.65%, indicating leveraged financial structure. While showing some neutral metrics like net margin at 5.3% and ROIC at 6.31%, its current ratio is surprisingly unfavorable at 3.19. MKS pays a dividend with a yield of 0.84%, but the payout trend and coverage details require further review for sustainability.
Which one has the best ratios?
Between the two, Coherent, Inc. holds a slightly less unfavorable position overall, with 35.71% favorable ratios compared to MKS’s 14.29%, and a lower leverage profile. However, both companies face significant challenges in profitability and valuation metrics. Investors should weigh these ratio evaluations carefully in context.
Strategic Positioning
This section compares the strategic positioning of Coherent, Inc. and MKS Inc., including their market position, key segments, and exposure to technological disruption:
Coherent, Inc.
- Larger market cap (~30B USD), facing competitive pressure in hardware and laser technologies.
- Focuses on lasers and materials segments, serving industrial, commercial, and scientific markets.
- Exposure to disruption in laser and precision optics technology, with innovation centered on laser applications.
MKS Inc.
- Smaller market cap (~11B USD), competes in hardware, instruments, and process control solutions.
- Diversified segments: vacuum & analysis, light & motion, equipment & solutions across multiple industries.
- Exposure to plasma, photonics, and vacuum technologies, integrating advanced process control systems.
Coherent, Inc. vs MKS Inc. Positioning
Coherent has a concentrated focus on laser and material segments, targeting industrial and scientific fields, while MKS shows a more diversified approach across vacuum, photonics, and equipment solutions. Coherent’s larger scale may offer market influence; MKS’s diversity spans broader manufacturing and research applications.
Which has the best competitive advantage?
Both companies show very unfavorable MOAT evaluations with declining ROIC trends and value destruction. Neither currently demonstrates a sustainable competitive advantage based on capital efficiency and profitability metrics provided.
Stock Comparison
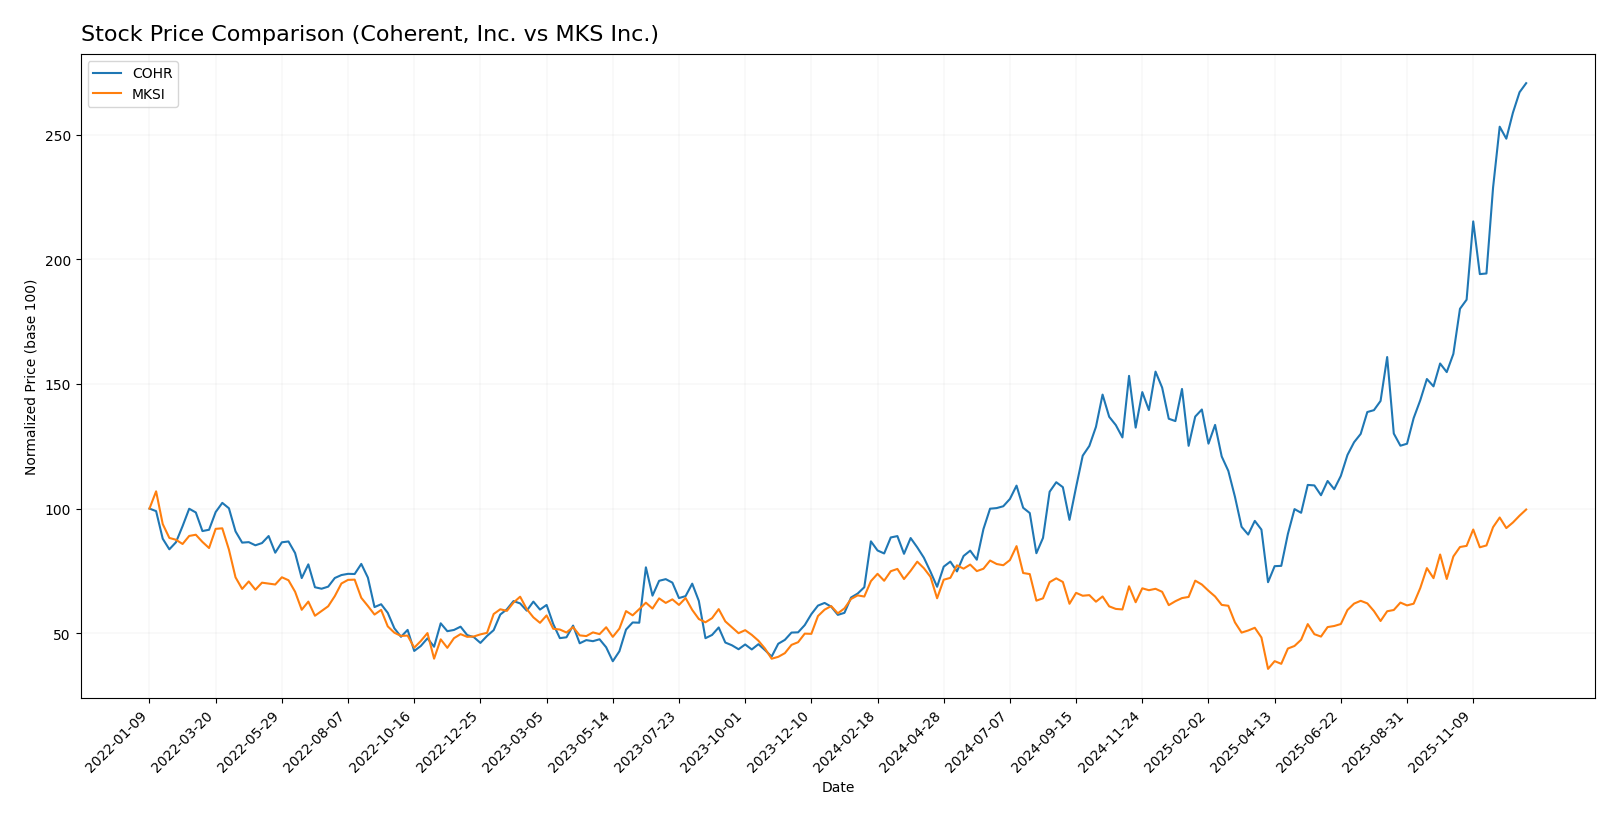
The stock price movements of Coherent, Inc. and MKS Inc. over the past 12 months reveal strong bullish trends with notable acceleration and rising buyer dominance across both companies.
Trend Analysis
Coherent, Inc. (COHR) experienced a 211.68% price increase over the past year, indicating a strong bullish trend with accelerating momentum. The stock showed significant volatility, with a standard deviation of 31.92, peaking at 194.33 and bottoming at 49.26.
MKS Inc. (MKSI) registered a 40.53% price rise during the same period, also reflecting a bullish trend with acceleration. Its volatility was lower, with a standard deviation of 22.02, reaching a high of 168.36 and a low of 60.29.
Comparing the two, Coherent, Inc. delivered the highest market performance, outperforming MKS Inc. by a wide margin in percentage price appreciation over the last year.
Target Prices
The consensus target prices from verified analysts indicate moderate upside potential for both companies.
| Company | Target High | Target Low | Consensus |
|---|---|---|---|
| Coherent, Inc. | 210 | 135 | 175 |
| MKS Inc. | 200 | 136 | 172.83 |
Analysts expect Coherent, Inc. to trade slightly below its current price of $194.33, while MKS Inc.’s consensus target of $172.83 suggests modest growth from its current $168.36. Overall, targets reflect cautious optimism.
Analyst Opinions Comparison
This section compares analysts’ ratings and grades for Coherent, Inc. and MKS Inc.:
Rating Comparison
Coherent, Inc. Rating
- Rating: B-, considered very favorable by analysts.
- Discounted Cash Flow Score: 3, indicating moderate valuation.
- ROE Score: 2, showing moderate efficiency in equity use.
- ROA Score: 3, reflecting moderate asset utilization.
- Debt To Equity Score: 2, moderate financial risk.
- Overall Score: 2, moderate overall financial standing.
MKS Inc. Rating
- Rating: B-, considered very favorable by analysts.
- Discounted Cash Flow Score: 3, indicating moderate valuation.
- ROE Score: 3, showing better efficiency in equity use.
- ROA Score: 3, reflecting moderate asset utilization.
- Debt To Equity Score: 1, indicating higher financial risk.
- Overall Score: 2, moderate overall financial standing.
Which one is the best rated?
Both companies share the same overall rating of B- and a moderate overall score of 2. MKS Inc. scores higher in ROE but has a lower debt-to-equity score, indicating higher financial risk compared to Coherent, Inc.
Scores Comparison
Here is a comparison of the Altman Z-Score and Piotroski Score for both companies:
Coherent, Inc. Scores
- Altman Z-Score: 3.35, in the safe zone indicating low bankruptcy risk.
- Piotroski Score: 7, classified as strong financial health.
MKS Inc. Scores
- Altman Z-Score: 2.02, in the grey zone indicating moderate bankruptcy risk.
- Piotroski Score: 7, classified as strong financial health.
Which company has the best scores?
Coherent, Inc. shows a higher Altman Z-Score in the safe zone, suggesting stronger financial stability compared to MKS Inc., which is in the grey zone. Both companies share the same strong Piotroski Score of 7.
Grades Comparison
Here is a comparison of the recent grades assigned to Coherent, Inc. and MKS Inc. by reputable grading companies:
Coherent, Inc. Grades
The following table summarizes the latest grades from respected financial institutions for Coherent, Inc.:
| Grading Company | Action | New Grade | Date |
|---|---|---|---|
| Morgan Stanley | maintain | Equal Weight | 2025-12-17 |
| JP Morgan | maintain | Overweight | 2025-12-05 |
| Barclays | maintain | Overweight | 2025-11-07 |
| Needham | maintain | Buy | 2025-11-06 |
| Morgan Stanley | maintain | Equal Weight | 2025-11-06 |
| Rosenblatt | maintain | Buy | 2025-11-06 |
| Stifel | maintain | Buy | 2025-11-06 |
| Susquehanna | maintain | Positive | 2025-10-22 |
| Barclays | maintain | Overweight | 2025-10-20 |
| Rosenblatt | maintain | Buy | 2025-10-14 |
Grades for Coherent, Inc. mostly range from Equal Weight to Buy, indicating moderate confidence with some bullish leanings.
MKS Inc. Grades
The following table shows recent grades assigned by leading financial firms to MKS Inc.:
| Grading Company | Action | New Grade | Date |
|---|---|---|---|
| Mizuho | maintain | Outperform | 2025-12-17 |
| Citigroup | maintain | Buy | 2025-11-12 |
| Wells Fargo | maintain | Equal Weight | 2025-11-07 |
| Benchmark | maintain | Buy | 2025-11-07 |
| Keybanc | maintain | Overweight | 2025-11-07 |
| Needham | maintain | Buy | 2025-11-06 |
| Mizuho | maintain | Outperform | 2025-10-16 |
| Needham | maintain | Buy | 2025-10-13 |
| Goldman Sachs | maintain | Sell | 2025-10-09 |
| Wells Fargo | maintain | Equal Weight | 2025-08-08 |
MKS Inc. grades predominantly fall between Equal Weight and Outperform, with a single Sell rating from Goldman Sachs, showing generally positive sentiment with some caution.
Which company has the best grades?
MKS Inc. has received slightly higher grades overall, including multiple Outperform ratings, compared to Coherent, Inc.’s Buy and Overweight assessments. This may suggest stronger analyst conviction for MKS Inc., potentially impacting investor confidence and portfolio positioning.
Strengths and Weaknesses
The table below compares key strengths and weaknesses of Coherent, Inc. (COHR) and MKS Inc. (MKSI) based on recent financial performance, market presence, and innovation indicators.
| Criterion | Coherent, Inc. (COHR) | MKS Inc. (MKSI) |
|---|---|---|
| Diversification | Moderate: Focused on Lasers ($1.43B) and Materials ($954M) segments | High: Diverse product and service lines, $3.12B product and $462M service revenues |
| Profitability | Low: ROIC 1.28% vs WACC 11.65%, declining profitability | Moderate: ROIC 6.31% vs WACC 10.92%, also declining but higher than COHR |
| Innovation | Moderate: Stable fixed asset turnover (3.09), but high P/E (280) suggests market skepticism | Moderate: Higher fixed asset turnover (3.55), but unfavorable P/E (37) and PB (3.03) ratios |
| Global presence | Established with strong current (2.19) and quick (1.39) ratios indicating liquidity | Strong liquidity in quick ratio (2.04) but weaker current ratio (3.19 unfavorable) |
| Market Share | Concentrated in laser and materials markets, challenged by value destruction | Broader market with vacuum, photonics, and equipment solutions, but high debt (D/E 2.06) limits flexibility |
Key takeaways: Both companies are currently experiencing value destruction with declining ROIC compared to their cost of capital. MKS Inc. shows greater diversification and market reach but carries higher financial risk due to leverage. Coherent’s liquidity and asset efficiency are better, yet profitability remains a concern. Investors should weigh growth potential against financial stability and consider risk management carefully.
Risk Analysis
Below is a comparative overview of key risks for Coherent, Inc. (COHR) and MKS Inc. (MKSI) based on the most recent data available:
| Metric | Coherent, Inc. (COHR) | MKS Inc. (MKSI) |
|---|---|---|
| Market Risk | Beta 1.86; sensitive to tech sector volatility | Beta 1.93; slightly higher volatility in tech sector |
| Debt level | Debt-to-Equity 0.48 (favorable) | Debt-to-Equity 2.06 (unfavorable, high leverage) |
| Regulatory Risk | Moderate, US-based tech regulations apply | Moderate, similar tech and manufacturing sector regulations |
| Operational Risk | Large workforce (26K employees) may increase complexity | Smaller workforce (10.2K employees) but diversified segments |
| Environmental Risk | Standard industry risks; no major issues reported | Standard industry risks; no major issues reported |
| Geopolitical Risk | Exposure to international markets but limited direct geopolitical impact | Exposure through global supply chains and markets |
Coherent shows moderate market risk and a manageable debt profile, reflecting relative financial stability with a safe Altman Z-score (3.35). MKS carries higher financial risk due to elevated debt levels and a grey zone Altman Z-score (2.02), indicating moderate bankruptcy risk. Market volatility and leverage remain the most impactful risks for investors in these firms.
Which Stock to Choose?
Coherent, Inc. (COHR) shows a strong revenue growth of 23.4% in 2025 with favorable gross margin and improving net margin, despite a long-term decline in net income and profitability ratios. Its debt levels are moderate, supported by a current ratio of 2.19 and a B- rating indicating moderate overall financial health.
MKS Inc. (MKSI) experienced a slight revenue decline of 1% in 2024 but maintains a favorable gross and EBIT margin. Profitability metrics such as ROE and net margin are moderate but accompanied by high debt levels and a current ratio of 3.19. MKSI also carries a B- rating, reflecting moderate financial strength with some concerns on leverage.
For risk-averse investors prioritizing financial stability, COHR’s stronger liquidity ratios and lower debt-to-assets may appear more favorable, while growth-oriented investors might see MKSI’s stable margins and solid profitability scores as attractive despite its higher leverage. Both companies show value destruction in MOAT analysis, suggesting caution.
Disclaimer: Investment carries a risk of loss of initial capital. The past performance is not a reliable indicator of future results. Be sure to understand risks before making an investment decision.
Go Further
I encourage you to read the complete analyses of Coherent, Inc. and MKS Inc. to enhance your investment decisions: