Coherent, Inc. and MicroVision, Inc. are two innovative players in the hardware and equipment sector, each focusing on advanced laser and optical technologies. Coherent specializes in laser systems for industrial and scientific applications, while MicroVision develops lidar sensors and micro-display solutions for automotive safety and augmented reality. This comparison explores their market positions and innovation strategies to help you identify which company offers the most compelling investment opportunity. Let’s dive in and uncover the best choice for your portfolio.
Table of contents
Companies Overview
I will begin the comparison between Coherent, Inc. and MicroVision, Inc. by providing an overview of these two companies and their main differences.
Coherent, Inc. Overview
Coherent, Inc. specializes in providing lasers and laser-based technologies for commercial, industrial, and scientific research markets. Operating primarily in Original Equipment Manufacturers (OEM) Laser Sources and Industrial Lasers & Systems segments, it offers precision optics, laser tools, and measurement products. Founded in 1966 and based in Santa Clara, California, Coherent serves a broad range of applications including microelectronics and materials processing.
MicroVision, Inc. Overview
MicroVision, Inc. develops lidar sensors and laser beam scanning technology for automotive safety, autonomous driving, and augmented reality (AR) headsets. Its product range includes MEMS-based scanning modules, interactive display modules, and consumer lidar for smart home systems. Founded in 1993 and headquartered in Redmond, Washington, MicroVision primarily sells to original equipment and design manufacturers, focusing on innovation in sensing and display technologies.
Key similarities and differences
Both companies operate in the technology sector, specifically within hardware, equipment, and parts, but serve distinct niche markets. Coherent focuses on laser solutions across multiple industrial and scientific applications, while MicroVision targets lidar and laser scanning for automotive and AR markets. Coherent is a much larger entity with a market cap of about 29.5B USD and over 26K employees, contrasting with MicroVision’s smaller scale at approximately 291M USD market cap and under 200 employees.
Income Statement Comparison
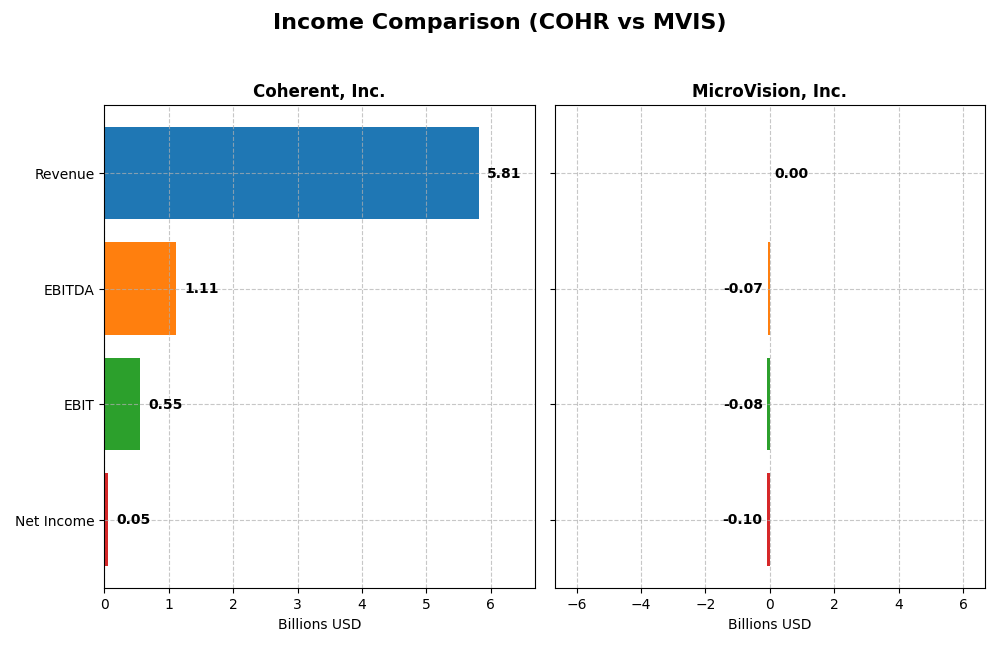
The table below presents a side-by-side comparison of key income statement metrics for Coherent, Inc. and MicroVision, Inc. for their most recent fiscal years.
| Metric | Coherent, Inc. (2025) | MicroVision, Inc. (2024) |
|---|---|---|
| Market Cap | 29.5B | 291M |
| Revenue | 5.81B | 4.70M |
| EBITDA | 1.11B | -71.0M |
| EBIT | 552M | -75.2M |
| Net Income | 49.4M | -96.9M |
| EPS | -0.52 | -0.46 |
| Fiscal Year | 2025 | 2024 |
Income Statement Interpretations
Coherent, Inc.
Coherent, Inc. experienced significant revenue growth of 87% over 2021-2025, with a strong 23% increase in the most recent year. Gross margin remained favorable at 35.4%, while EBIT margin stayed neutral at 9.5%. Despite fluctuating net income and occasional losses, 2025 showed a favorable rebound with improved net margin and EPS growth, highlighting operational resilience.
MicroVision, Inc.
MicroVision, Inc. showed a 52% revenue increase over 2020-2024 but faced persistent net losses, with net margin deeply negative at -2064%. The latest year saw a 35% revenue decline and worsening gross margin at -60.4%. Although EBIT improved slightly by nearly 15%, net margin and EPS deteriorated further, reflecting ongoing profitability challenges and high interest expenses.
Which one has the stronger fundamentals?
Coherent, Inc. demonstrates stronger fundamentals with robust revenue growth, positive margin trends, and improving profitability metrics in the latest year. Conversely, MicroVision struggles with negative margins, shrinking revenue recently, and heavy losses, signaling weaker income statement health. The overall income statement evaluations favor Coherent, indicating a more stable financial foundation.
Financial Ratios Comparison
The table below presents the most recent financial ratios for Coherent, Inc. (COHR) and MicroVision, Inc. (MVIS) based on their fiscal year-end data, providing a snapshot of their financial health and performance.
| Ratios | Coherent, Inc. (2025) | MicroVision, Inc. (2024) |
|---|---|---|
| ROE | 0.61% | -198.72% |
| ROIC | 1.31% | -83.73% |
| P/E | 279.75 | -2.83 |
| P/B | 1.70 | 5.63 |
| Current Ratio | 2.19 | 1.79 |
| Quick Ratio | 1.39 | 1.74 |
| D/E | 0.48 | 1.06 |
| Debt-to-Assets | 26.11% | 42.62% |
| Interest Coverage | 2.26 | -19.19 |
| Asset Turnover | 0.39 | 0.04 |
| Fixed Asset Turnover | 3.09 | 0.20 |
| Payout ratio | 23.17% | 0 |
| Dividend yield | 0.08% | 0 |
Interpretation of the Ratios
Coherent, Inc.
Coherent, Inc. displays a mixed ratio profile with 35.7% favorable and 50% unfavorable ratios, resulting in a slightly unfavorable global opinion. While liquidity ratios such as current (2.19) and quick ratios (1.39) are favorable, profitability indicators like net margin (0.85%) and return on equity (0.61%) remain weak. The company does not pay dividends, suggesting a reinvestment strategy or other priorities.
MicroVision, Inc.
MicroVision, Inc. exhibits predominantly unfavorable ratios, with 64.3% rated as such and only 21.4% favorable, leading to an overall unfavorable assessment. Key concerns include deeply negative profitability metrics like net margin (-2063.8%) and return on equity (-198.7%). Liquidity ratios are favorable, but the company pays no dividends, likely reflecting ongoing investment in R&D and growth initiatives.
Which one has the best ratios?
Comparing the two, Coherent, Inc. shows a relatively stronger financial ratio profile, with better liquidity and some favorable asset turnover measures. MicroVision’s ratios indicate significant operational and profitability challenges, including negative returns and high leverage. Thus, Coherent’s ratios are comparatively more balanced, though both companies face notable financial risks.
Strategic Positioning
This section compares the strategic positioning of Coherent, Inc. and MicroVision, Inc., including market position, key segments, and exposure to technological disruption:
Coherent, Inc.
- Large market cap of 29.5B USD with high competitive pressure in hardware equipment.
- Operates mainly in lasers and materials segments, driving revenues from industrial and scientific applications.
- Moderate exposure to disruption through laser technology innovation and integration in multiple applications.
MicroVision, Inc.
- Small market cap of 291M USD, facing moderate competitive pressure in niche hardware segments.
- Focuses on lidar sensors, micro-displays, and scanning technologies for automotive and AR markets.
- High exposure to disruption with emerging lidar and AR technologies requiring continuous innovation.
Coherent, Inc. vs MicroVision, Inc. Positioning
Coherent holds a diversified portfolio in lasers and materials with broad industrial applications, ensuring multiple revenue drivers. MicroVision is more concentrated on emerging lidar and AR technologies, relying heavily on innovation within niche segments but with smaller scale.
Which has the best competitive advantage?
Both companies are shedding value relative to their cost of capital. Coherent exhibits a very unfavorable moat with declining profitability, while MicroVision shows slightly unfavorable status but with improving profitability trends.
Stock Comparison
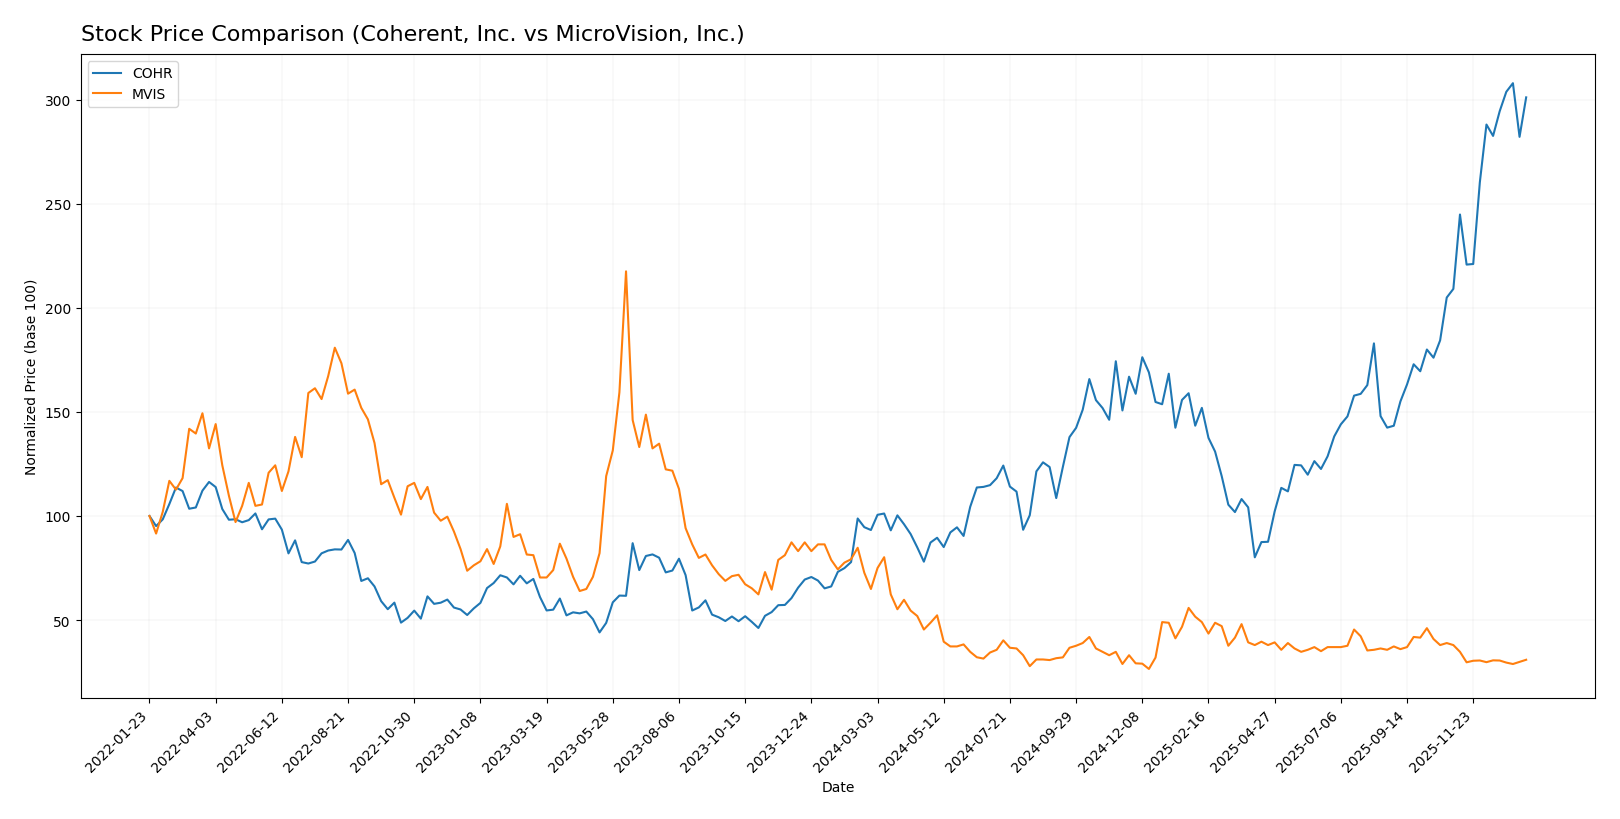
The stock price chart over the past 12 months reveals significant divergence between Coherent, Inc. and MicroVision, Inc., with Coherent displaying strong upward momentum while MicroVision faces persistent declines.
Trend Analysis
Coherent, Inc. shows a bullish trend with a 222.85% price increase over the past year, marked by acceleration and a high volatility of 34.26. The stock reached a peak at 194.33 and a low at 49.26.
MicroVision, Inc. experienced a bearish trend with a 52.36% price drop over the same period, accompanied by deceleration and low volatility of 0.29. The highest price was 2.47, and the lowest was 0.82.
Comparing both, Coherent, Inc. delivered the highest market performance with sustained gains and buyer dominance, whereas MicroVision, Inc. faced continuous selling pressure and declining prices.
Target Prices
The current target price consensus reflects mixed expectations from analysts for these two technology hardware companies.
| Company | Target High | Target Low | Consensus |
|---|---|---|---|
| Coherent, Inc. | 210 | 135 | 175 |
| MicroVision, Inc. | 5 | 5 | 5 |
Analysts see Coherent, Inc.’s stock price slightly undervalued with a consensus target of 175 versus a current price near 190. MicroVision’s consensus target at 5 suggests strong potential upside from its sub-1 current price.
Analyst Opinions Comparison
This section compares analysts’ ratings and grades for Coherent, Inc. and MicroVision, Inc.:
Rating Comparison
Coherent, Inc. Rating
- Rating: B- indicating a very favorable rating.
- Discounted Cash Flow Score: Moderate at 3.
- ROE Score: Moderate at 2, showing average efficiency.
- ROA Score: Moderate at 3, reflecting good asset use.
- Debt To Equity Score: Moderate at 2, moderate risk.
- Overall Score: Moderate at 2, average financial standing.
MicroVision, Inc. Rating
- Rating: C- indicating a very favorable rating.
- Discounted Cash Flow Score: Very unfavorable at 1.
- ROE Score: Very unfavorable at 1, indicating low profitability.
- ROA Score: Very unfavorable at 1, showing poor asset utilization.
- Debt To Equity Score: Moderate at 2, moderate financial risk.
- Overall Score: Very unfavorable at 1, weak financial standing.
Which one is the best rated?
Based strictly on the data, Coherent, Inc. holds a better rating with a B- and generally moderate scores across key metrics. MicroVision, Inc. has a lower C- rating and very unfavorable scores in most categories, except for moderate debt to equity.
Scores Comparison
Here is a comparison of the Altman Z-Score and Piotroski Score for Coherent, Inc. and MicroVision, Inc.:
Coherent, Inc. Scores
- Altman Z-Score: 3.70, indicating a safe zone with low bankruptcy risk.
- Piotroski Score: 7, reflecting strong financial health.
MicroVision, Inc. Scores
- Altman Z-Score: -6.63, indicating distress zone with high bankruptcy risk.
- Piotroski Score: 1, reflecting very weak financial health.
Which company has the best scores?
Coherent, Inc. shows significantly better scores, with a safe zone Altman Z-Score and a strong Piotroski Score, while MicroVision, Inc. is in distress and very weak financially.
Grades Comparison
The following is a comparison of the latest grades issued by recognized financial institutions for the two companies:
Coherent, Inc. Grades
This table summarizes recent analyst grades from major financial firms for Coherent, Inc.:
| Grading Company | Action | New Grade | Date |
|---|---|---|---|
| Morgan Stanley | Maintain | Equal Weight | 2025-12-17 |
| JP Morgan | Maintain | Overweight | 2025-12-05 |
| Barclays | Maintain | Overweight | 2025-11-07 |
| Morgan Stanley | Maintain | Equal Weight | 2025-11-06 |
| Stifel | Maintain | Buy | 2025-11-06 |
| Rosenblatt | Maintain | Buy | 2025-11-06 |
| Needham | Maintain | Buy | 2025-11-06 |
| Susquehanna | Maintain | Positive | 2025-10-22 |
| Barclays | Maintain | Overweight | 2025-10-20 |
| Rosenblatt | Maintain | Buy | 2025-10-14 |
Coherent, Inc. consistently receives Buy and Overweight ratings with no recent downgrades, indicating a generally positive analyst outlook.
MicroVision, Inc. Grades
This table presents recent analyst grades from recognized financial firms for MicroVision, Inc.:
| Grading Company | Action | New Grade | Date |
|---|---|---|---|
| D. Boral Capital | Maintain | Buy | 2025-12-16 |
| D. Boral Capital | Maintain | Buy | 2025-11-12 |
| WestPark Capital | Maintain | Buy | 2025-10-21 |
| WestPark Capital | Maintain | Buy | 2025-09-05 |
| D. Boral Capital | Maintain | Buy | 2025-09-02 |
| WestPark Capital | Maintain | Buy | 2025-08-27 |
| D. Boral Capital | Maintain | Buy | 2025-08-11 |
| D. Boral Capital | Maintain | Buy | 2025-05-21 |
| D. Boral Capital | Maintain | Buy | 2025-05-13 |
| WestPark Capital | Maintain | Buy | 2025-03-27 |
MicroVision, Inc. has a stable Buy rating consensus across all recent reports from these financial firms.
Which company has the best grades?
Both Coherent, Inc. and MicroVision, Inc. have Buy consensus ratings, but Coherent shows a broader range of strong Buy and Overweight ratings from multiple top-tier banks, suggesting a slightly more favorable analyst sentiment. This may impact investor confidence by indicating potentially stronger growth or stability expectations for Coherent.
Strengths and Weaknesses
The table below compares key strengths and weaknesses of Coherent, Inc. (COHR) and MicroVision, Inc. (MVIS) based on their latest financial and operational data.
| Criterion | Coherent, Inc. (COHR) | MicroVision, Inc. (MVIS) |
|---|---|---|
| Diversification | Balanced revenue from Lasers (1.43B) and Materials (954M) segments | Revenue concentrated in Product (4.1M) and License/Royalty (475K); less diversified |
| Profitability | Low net margin (0.85%), ROIC slightly positive (1.31%) but overall value destroying | Negative net margin (-2063%), ROIC deeply negative (-83.7%), yet improving ROIC trend |
| Innovation | Moderate innovation with steady materials and laser technologies | High innovation focus, shifting from licensing to product revenue growth |
| Global presence | Strong global footprint supported by diversified product lines | Smaller scale with niche technology market presence |
| Market Share | Established market share in laser and materials industries | Emerging player with limited share, growing product segment |
Key takeaways: Coherent offers better diversification and stable global presence but struggles with profitability and value creation. MicroVision is less diversified and currently unprofitable, though it shows improving profitability trends and innovation-driven growth potential. Investors should weigh Coherent’s stability against MicroVision’s growth risk.
Risk Analysis
Below is a comparison of key risks for Coherent, Inc. (COHR) and MicroVision, Inc. (MVIS) based on the most recent available data.
| Metric | Coherent, Inc. (COHR) | MicroVision, Inc. (MVIS) |
|---|---|---|
| Market Risk | Beta 1.835, high volatility | Beta 1.274, moderate volatility |
| Debt Level | Debt/Equity 0.48, moderate | Debt/Equity 1.06, high leverage |
| Regulatory Risk | Moderate; operates globally | Moderate; automotive lidar focus |
| Operational Risk | Large scale, 26K employees; stable ops | Small scale, 185 employees; higher operational risk |
| Environmental Risk | Industry-related, moderate | Emerging tech; moderate but evolving |
| Geopolitical Risk | US-based, international sales | US-based, tech sensitive to trade policies |
The most likely and impactful risks come from market volatility for COHR with a high beta of 1.835, signaling sensitivity to market swings. MVIS faces significant financial distress risks, evidenced by a negative Altman Z-score in the distress zone, high debt leverage, and weak profitability, which could impact its ability to sustain operations. Operational risks are also higher for MVIS due to its smaller scale and niche technology focus.
Which Stock to Choose?
Coherent, Inc. (COHR) shows a favorable income evolution with 23.42% revenue growth last year and a positive global income statement opinion. Its financial ratios are slightly unfavorable overall, but liquidity and leverage ratios are favorable. Profitability metrics remain low, and the company carries moderate debt with a very favorable B- rating.
MicroVision, Inc. (MVIS) presents an unfavorable income evolution marked by negative margins and declining profitability, despite some revenue growth over the overall period. Its financial ratios are mostly unfavorable, with significant debt levels and weak profitability. The company’s rating is very unfavorable at C-, reflecting financial distress and weak scores.
Investors focused on stability and liquidity might find COHR’s stronger income growth, better liquidity, and higher rating more appealing. Conversely, risk-tolerant investors seeking turnaround potential could see MVIS’s improving ROIC trend as a positive sign despite current challenges. The choice could depend on individual risk appetite and investment strategy.
Disclaimer: Investment carries a risk of loss of initial capital. The past performance is not a reliable indicator of future results. Be sure to understand risks before making an investment decision.
Go Further
I encourage you to read the complete analyses of Coherent, Inc. and MicroVision, Inc. to enhance your investment decisions: