Keysight Technologies, Inc. and Coherent, Inc. are two prominent players in the hardware and equipment sector, specializing in advanced technology solutions for diverse industrial and scientific needs. While Keysight focuses on electronic design and test systems, Coherent leads in laser technologies and precision optics. Their overlapping markets and innovation-driven strategies make this comparison essential. Join me as we explore which company offers a more compelling opportunity for investors.
Table of contents
Companies Overview
I will begin the comparison between Keysight Technologies and Coherent by providing an overview of these two companies and their main differences.
Keysight Technologies Overview
Keysight Technologies, Inc. specializes in electronic design and test solutions across multiple industries including communications, aerospace, defense, and semiconductor sectors. The company offers a broad portfolio of hardware, software, and services focused on electronic measurement and testing, supporting customers in the Americas, Europe, and Asia Pacific. Founded in 1939 and headquartered in Santa Rosa, CA, Keysight is a well-established player with a market cap of approximately 36B USD.
Coherent Overview
Coherent, Inc. provides lasers, laser-based technologies, and system solutions for commercial, industrial, and scientific research applications. Operating through OEM Laser Sources and Industrial Lasers & Systems segments, it designs and manufactures precision optics, laser tools, and measurement products. Founded in 1966 and headquartered in Santa Clara, CA, Coherent had a market cap near 29.5B USD before becoming a subsidiary of II-VI Incorporated in 2022.
Key similarities and differences
Both Keysight and Coherent operate in the technology sector, specifically within hardware, equipment, and parts industries, serving specialized markets with advanced technological products. While Keysight focuses on electronic design automation and test solutions, Coherent concentrates on laser technologies and precision optics. Keysight’s business emphasizes electronic measurement instruments, whereas Coherent centers on laser manufacturing and system integration for industrial and research applications.
Income Statement Comparison
This table compares key income statement metrics for Keysight Technologies, Inc. and Coherent, Inc. for their most recent fiscal years, providing a snapshot of their financial performance.

| Metric | Keysight Technologies, Inc. | Coherent, Inc. |
|---|---|---|
| Market Cap | 36B | 29.5B |
| Revenue | 5.38B | 5.81B |
| EBITDA | 1.43B | 1.11B |
| EBIT | 1.15B | 552M |
| Net Income | 846M | -81M |
| EPS | 4.9 | -0.52 |
| Fiscal Year | 2025 | 2025 |
Income Statement Interpretations
Keysight Technologies, Inc.
Keysight’s revenue showed a generally positive trend with a 7.95% growth in the latest year and an 8.78% increase over five years, despite a net income decline of 5.37% in the same period. Margins remain strong, with a gross margin above 62% and net margin near 16%, both favorable. The 2025 performance demonstrated improved EBIT and net margin growth, indicating enhanced profitability.
Coherent, Inc.
Coherent posted substantial revenue growth of 23.42% in 2025 and an 87.07% increase overall since 2021, yet net income fell sharply by 83.41% over five years, reflecting margin pressures. The gross margin is moderate at 35.41%, with a neutral net margin near 0.85%. The recent year showed marked improvements in EBIT and net margin, though profitability remains slim.
Which one has the stronger fundamentals?
Keysight exhibits higher and more stable margins, with consistent profitability and favorable trends in earnings growth, suggesting resilient fundamentals. Coherent’s strong revenue growth contrasts with significant net income volatility and thin margins, posing higher risk. Overall, Keysight’s income statement reflects a steadier financial foundation compared to Coherent’s more variable earnings profile.
Financial Ratios Comparison
The table below presents the most recent key financial ratios for Keysight Technologies, Inc. and Coherent, Inc., enabling a straightforward comparison of their financial performance and stability.
| Ratios | Keysight Technologies, Inc. (2025) | Coherent, Inc. (2025) |
|---|---|---|
| ROE | 14.40% | 0.61% |
| ROIC | 7.98% | 1.31% |
| P/E | 37.41 | 279.75 |
| P/B | 5.39 | 1.70 |
| Current Ratio | 2.35 | 2.19 |
| Quick Ratio | 1.78 | 1.39 |
| D/E | 0.51 | 0.48 |
| Debt-to-Assets | 26.31% | 26.11% |
| Interest Coverage | 9.88 | 2.26 |
| Asset Turnover | 0.48 | 0.39 |
| Fixed Asset Turnover | 5.21 | 3.09 |
| Payout ratio | 0% | 23.17% |
| Dividend yield | 0% | 0.08% |
Interpretation of the Ratios
Keysight Technologies, Inc.
Keysight shows a mix of strong and weak ratios, with favorable profitability (net margin 15.74%) and liquidity (current ratio 2.35), but less attractive valuation metrics (PE 37.41, PB 5.39) and weak asset turnover. Debt levels are manageable, and interest coverage is solid. Keysight does not pay dividends, likely reflecting a focus on reinvestment in R&D and growth initiatives.
Coherent, Inc.
Coherent’s ratios reveal several weaknesses, including very low profitability (net margin 0.85%) and returns (ROE 0.61%, ROIC 1.31%), alongside a high PE ratio of 279.75. Liquidity and leverage appear sound, but interest coverage is only moderate. The company pays no dividends, possibly due to low earnings and prioritization of operational or strategic investments.
Which one has the best ratios?
Comparing the two, Keysight presents a more favorable overall ratio profile, with higher profitability, liquidity, and coverage ratios, despite some valuation concerns. Coherent’s ratios indicate significant profitability and efficiency challenges, making its overall financial health appear weaker in contrast.
Strategic Positioning
This section compares the strategic positioning of Keysight Technologies, Inc. and Coherent, Inc., focusing on market position, key segments, and exposure to technological disruption:
Keysight Technologies, Inc.
- Strong market position in electronic test solutions facing moderate competitive pressure.
- Diversified segments: Communications Solutions and Electronic Industrial Solutions drive revenue.
- Moderate exposure to technological disruption through evolving electronic design and test innovations.
Coherent, Inc.
- Significant presence in laser technologies with intense industry competition.
- Concentrated segments: Lasers and Materials primarily fuel business growth.
- High exposure to disruption in laser and precision optics technologies.
Keysight Technologies, Inc. vs Coherent, Inc. Positioning
Keysight exhibits a diversified business model across multiple technology segments, providing broader revenue streams but facing varied competitive forces. Coherent concentrates on laser-based technologies, offering focused expertise but potentially higher vulnerability to market shifts within its niche.
Which has the best competitive advantage?
Both companies show very unfavorable MOAT evaluations with declining ROIC trends, indicating value destruction and weakening competitive advantages. Keysight’s smaller negative gap suggests slightly better capital efficiency compared to Coherent’s more pronounced decline.
Stock Comparison
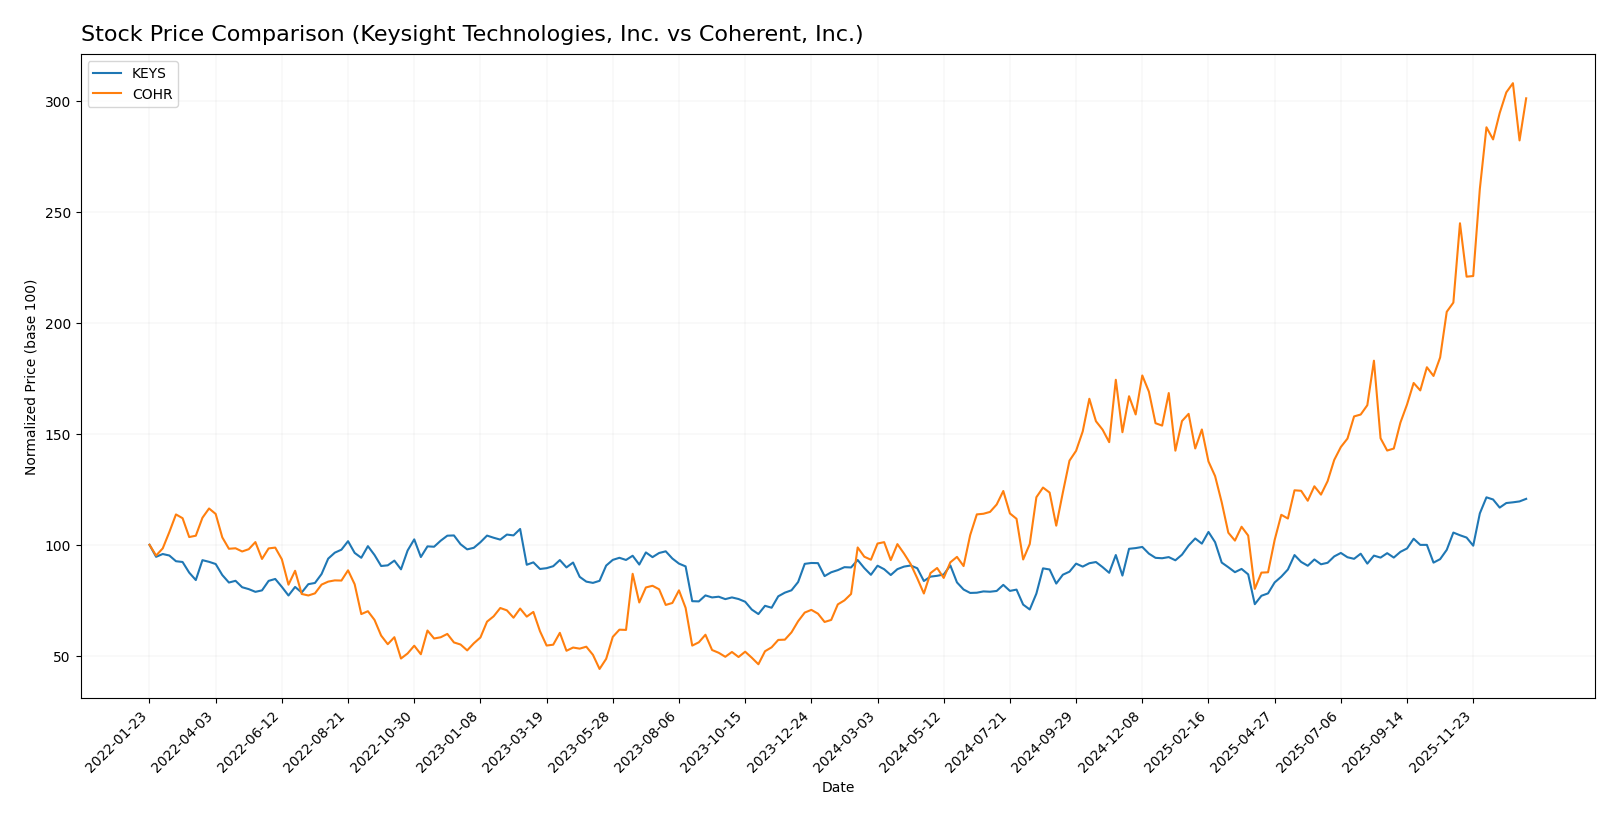
The stock price chart highlights significant bullish momentum for both Keysight Technologies, Inc. and Coherent, Inc. over the past year, with Coherent showing notably stronger gains and trading activity.
Trend Analysis
Keysight Technologies, Inc. experienced a 39.56% price increase over the past 12 months, indicating a bullish trend with accelerating momentum. The stock showed moderate volatility, with a price range from 122.87 to 210.49.
Coherent, Inc. recorded a substantial 222.85% price increase over the same period, reflecting a strong bullish trend with acceleration. Volatility was higher, with prices fluctuating between 49.26 and 194.33.
Comparing the two, Coherent, Inc. delivered the highest market performance with a significantly larger price increase and stronger volume trends than Keysight Technologies, Inc.
Target Prices
The current target price consensus for Keysight Technologies, Inc. and Coherent, Inc. reflects moderate upside potential.
| Company | Target High | Target Low | Consensus |
|---|---|---|---|
| Keysight Technologies, Inc. | 232 | 210 | 225.13 |
| Coherent, Inc. | 210 | 135 | 175 |
Analysts expect Keysight’s stock to trade slightly above its current price of 209.3 USD, indicating modest growth potential. Coherent’s consensus target of 175 USD suggests a slight downside compared to its current price near 190 USD.
Analyst Opinions Comparison
This section compares analysts’ ratings and grades for Keysight Technologies, Inc. (KEYS) and Coherent, Inc. (COHR):
Rating Comparison
KEYS Rating
- Rating: B, considered very favorable overall.
- Discounted Cash Flow Score: 3, moderate level.
- ROE Score: 4, favorable, strong profit generation.
- ROA Score: 4, favorable, effective asset use.
- Debt To Equity Score: 2, moderate financial risk.
- Overall Score: 3, moderate overall financial health.
COHR Rating
- Rating: B-, also very favorable overall.
- Discounted Cash Flow Score: 3, moderate level.
- ROE Score: 2, moderate, less efficient profitability.
- ROA Score: 3, moderate, reasonable asset use.
- Debt To Equity Score: 2, moderate financial risk.
- Overall Score: 2, moderate overall financial health.
Which one is the best rated?
Based strictly on the data, KEYS holds a higher rating (B) with stronger ROE and ROA scores and a higher overall score (3) compared to COHR’s B- rating and lower scores, indicating KEYS is the better rated company by analysts.
Scores Comparison
The comparison of financial strength scores for Keysight Technologies and Coherent, Inc. shows the following:
Keysight Technologies Scores
- Altman Z-Score: 5.94, indicating a safe zone status
- Piotroski Score: 4, classified as average financial strength
Coherent, Inc. Scores
- Altman Z-Score: 3.70, indicating a safe zone status
- Piotroski Score: 7, classified as strong financial strength
Which company has the best scores?
Coherent, Inc. has a lower Altman Z-Score but both are in the safe zone. Coherent’s Piotroski Score is higher, indicating stronger financial health compared to Keysight Technologies based on the provided data.
Grades Comparison
Here is a comparison of the recent grades assigned to Keysight Technologies, Inc. and Coherent, Inc.:
Keysight Technologies, Inc. Grades
The table below summarizes recent grades from recognized grading companies for Keysight Technologies, Inc.:
| Grading Company | Action | New Grade | Date |
|---|---|---|---|
| Morgan Stanley | Maintain | Equal Weight | 2025-12-17 |
| Jefferies | Maintain | Hold | 2025-12-10 |
| Baird | Maintain | Outperform | 2025-11-26 |
| Barclays | Maintain | Overweight | 2025-11-25 |
| JP Morgan | Maintain | Overweight | 2025-11-25 |
| Jefferies | Maintain | Hold | 2025-11-25 |
| Citigroup | Maintain | Buy | 2025-11-25 |
| UBS | Maintain | Buy | 2025-11-25 |
| Wells Fargo | Maintain | Overweight | 2025-11-25 |
| Susquehanna | Maintain | Positive | 2025-11-25 |
Overall, the grades for Keysight Technologies show a positive trend with multiple buy and overweight ratings supporting a generally favorable outlook.
Coherent, Inc. Grades
The table below summarizes recent grades from recognized grading companies for Coherent, Inc.:
| Grading Company | Action | New Grade | Date |
|---|---|---|---|
| Morgan Stanley | Maintain | Equal Weight | 2025-12-17 |
| JP Morgan | Maintain | Overweight | 2025-12-05 |
| Barclays | Maintain | Overweight | 2025-11-07 |
| Morgan Stanley | Maintain | Equal Weight | 2025-11-06 |
| Stifel | Maintain | Buy | 2025-11-06 |
| Rosenblatt | Maintain | Buy | 2025-11-06 |
| Needham | Maintain | Buy | 2025-11-06 |
| Susquehanna | Maintain | Positive | 2025-10-22 |
| Barclays | Maintain | Overweight | 2025-10-20 |
| Rosenblatt | Maintain | Buy | 2025-10-14 |
Grades for Coherent, Inc. also indicate a favorable consensus, with multiple buy and overweight ratings suggesting sustained positive sentiment.
Which company has the best grades?
Both Keysight Technologies, Inc. and Coherent, Inc. have received predominantly buy and overweight grades, reflecting a generally positive consensus. Coherent, Inc. has a slightly higher number of buy ratings, which could indicate stronger confidence from analysts, potentially impacting investor sentiment and portfolio decisions.
Strengths and Weaknesses
The table below compares key strengths and weaknesses of Keysight Technologies, Inc. and Coherent, Inc. based on their latest financial and operational data.
| Criterion | Keysight Technologies, Inc. (KEYS) | Coherent, Inc. (COHR) |
|---|---|---|
| Diversification | Strong diversification with Communications Solutions (3.42B) and Electronic Industrial Solutions (1.56B) segments | Moderate diversification between Lasers (1.43B) and Materials (0.95B) segments |
| Profitability | Favorable net margin (15.7%), neutral ROIC (7.98%) and ROE (14.4%) | Low profitability with net margin 0.85%, ROIC 1.31%, ROE 0.61% (all unfavorable) |
| Innovation | Consistent investment in technology reflected in high fixed asset turnover (5.21) | Moderate asset turnover (3.09) indicates ongoing innovation but less efficient |
| Global presence | Established global footprint with solid current (2.35) and quick ratios (1.78) | Good liquidity (current ratio 2.19), but weaker interest coverage (2.27) |
| Market Share | Higher overall revenue scale with 5B+ in key segments | Smaller revenue base around 2.4B, indicating smaller market share |
In summary, Keysight demonstrates stronger diversification, profitability, and operational efficiency, though its valuation metrics appear stretched. Coherent faces profitability challenges and shrinking returns but maintains decent liquidity. Both companies show declining ROIC trends, signaling caution for investors focused on value creation.
Risk Analysis
Below is a comparison of key risks for Keysight Technologies, Inc. (KEYS) and Coherent, Inc. (COHR) based on the most recent data from 2025:
| Metric | Keysight Technologies, Inc. (KEYS) | Coherent, Inc. (COHR) |
|---|---|---|
| Market Risk | Moderate beta of 1.18 indicates moderate volatility relative to market | Higher beta of 1.84 suggests higher market volatility risk |
| Debt level | Debt-to-equity ratio of 0.51 (neutral), interest coverage strong at 11.98 | Debt-to-equity 0.48 (favorable), but lower interest coverage at 2.27 (neutral) |
| Regulatory Risk | Moderate, given diverse global operations in defense & aerospace sectors | Moderate, with exposure to industrial and scientific sectors globally |
| Operational Risk | Moderate due to complex product lines and reliance on technology innovation | Moderate, with dependency on laser tech and integration in manufacturing |
| Environmental Risk | Low to moderate; technology sector with some exposure to energy consumption | Moderate, due to manufacturing processes involving lasers and precision optics |
| Geopolitical Risk | Moderate, with significant sales in Americas, Europe, Asia-Pacific | Moderate, with global sales and supply chain exposure |
In synthesis, Coherent faces higher market risk due to greater volatility and somewhat weaker interest coverage, which may impact its financial resilience. Keysight shows more balanced financial health but must manage operational complexities and moderate geopolitical risks. Both companies operate in sectors sensitive to regulatory changes and global supply chain disruptions. Investors should weigh these risks carefully alongside growth prospects.
Which Stock to Choose?
Keysight Technologies, Inc. (KEYS) shows steady income growth with a 7.95% revenue increase in 2025 and favorable profitability margins, including a 15.74% net margin. Its financial ratios are slightly favorable, reflecting solid liquidity and moderate debt, supported by a very favorable “B” rating. However, its economic moat appears very unfavorable due to declining ROIC versus WACC.
Coherent, Inc. (COHR) reports a stronger recent revenue growth of 23.42% in 2025 but suffers from low profitability with a 0.85% net margin and weaker returns on equity and assets. Its financial ratios are slightly unfavorable overall, despite favorable liquidity and manageable debt levels, and it holds a very favorable “B-” rating. Like KEYS, COHR’s moat is very unfavorable with declining profitability.
For investors, KEYS might appear more suitable for those prioritizing steady income and solid financial health, given its favorable income statement and rating despite a weakening moat. Conversely, COHR’s rapid revenue growth might appeal to risk-tolerant investors focused on growth potential, though its weaker profitability and financial ratios suggest caution. The choice could depend on whether stability or aggressive growth aligns with the investor’s profile.
Disclaimer: Investment carries a risk of loss of initial capital. The past performance is not a reliable indicator of future results. Be sure to understand risks before making an investment decision.
Go Further
I encourage you to read the complete analyses of Keysight Technologies, Inc. and Coherent, Inc. to enhance your investment decisions: