In the fast-evolving technology sector, Coherent, Inc. and Jabil Inc. stand out as leaders in hardware and manufacturing solutions. Coherent focuses on advanced laser technologies, while Jabil excels in comprehensive electronics manufacturing services. Their market overlap and innovation strategies make them compelling candidates for comparison. In this article, I will analyze both companies to help you decide which is the more promising investment opportunity today.
Table of contents
Companies Overview
I will begin the comparison between Coherent, Inc. and Jabil Inc. by providing an overview of these two companies and their main differences.
Coherent, Inc. Overview
Coherent, Inc. specializes in lasers, laser-based technologies, and system solutions for commercial, industrial, and scientific research applications. It operates primarily in Original Equipment Manufacturers (OEM) Laser Sources and Industrial Lasers & Systems segments. Headquartered in Santa Clara, California, Coherent serves markets including microelectronics and materials processing, emphasizing precision optics and measurement products.
Jabil Inc. Overview
Jabil Inc. offers comprehensive manufacturing services and solutions worldwide, focusing on Electronics Manufacturing Services and Diversified Manufacturing Services. The company provides design, production, and product management services for electronics, including integrated circuit design, rapid prototyping, and mechanical design. Based in Saint Petersburg, Florida, Jabil serves industries such as 5G, automotive, healthcare, and digital print.
Key similarities and differences
Both companies operate in the technology sector within hardware, equipment, and parts industries, listed on the NYSE. Coherent emphasizes laser technology and precision optics, targeting scientific and OEM applications, while Jabil focuses on electronics manufacturing services and diversified production solutions across multiple industries. Coherent employs about 26K staff, whereas Jabil’s workforce exceeds 138K, reflecting distinct scale and business model complexity.
Income Statement Comparison
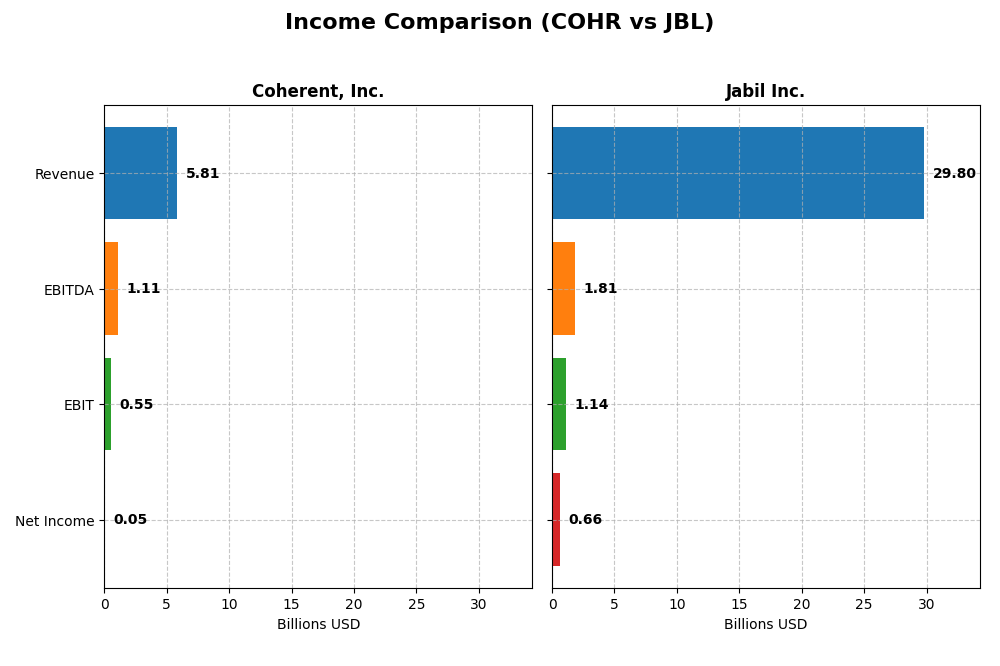
The following table compares key income statement metrics for Coherent, Inc. and Jabil Inc. for the most recent fiscal year 2025.
| Metric | Coherent, Inc. (COHR) | Jabil Inc. (JBL) |
|---|---|---|
| Market Cap | 29.5B | 25.5B |
| Revenue | 5.81B | 29.8B |
| EBITDA | 1.11B | 1.81B |
| EBIT | 552M | 1.14B |
| Net Income | 49.4M | 657M |
| EPS | -0.52 | 6.00 |
| Fiscal Year | 2025 | 2025 |
Income Statement Interpretations
Coherent, Inc.
Coherent, Inc. showed strong revenue growth of 87.07% from 2021 to 2025, with a notable 23.42% increase in the latest year. Gross margin remains favorable at 35.41%, while net margin is stable but low at 0.85%. The 2025 fiscal year displayed significant improvements in EBIT and net margin growth, indicating operational efficiency gains despite an overall net income decline over the period.
Jabil Inc.
Jabil Inc. experienced modest revenue growth of 1.77% over five years, with a slight 3.18% rise in 2025. Margins remain generally neutral; gross margin is 8.88% and net margin at 2.2%. However, the latest year showed unfavorable trends in gross profit and EBIT growth, reflecting margin pressure. EPS increased favorably over the whole period, contrasting with recent operational earnings declines.
Which one has the stronger fundamentals?
Coherent, Inc. demonstrates stronger fundamentals with favorable revenue growth, improving margins, and operational income gains in the latest year. Conversely, Jabil exhibits weaker revenue growth and several unfavorable margin and income trends recently, despite a positive EPS trajectory overall. Coherent’s higher gross margin and significant EBIT improvement contribute to its comparatively stronger income statement profile.
Financial Ratios Comparison
The table below compares the most recent financial ratios for Coherent, Inc. (COHR) and Jabil Inc. (JBL) based on their fiscal year 2025 data.
| Ratios | Coherent, Inc. (COHR) | Jabil Inc. (JBL) |
|---|---|---|
| ROE | 0.61% | 43.42% |
| ROIC | 1.31% | 16.06% |
| P/E | 279.75 | 34.14 |
| P/B | 1.70 | 14.82 |
| Current Ratio | 2.19 | 1.00 |
| Quick Ratio | 1.39 | 0.66 |
| D/E (Debt-to-Equity) | 0.48 | 2.22 |
| Debt-to-Assets | 26.11% | 18.15% |
| Interest Coverage | 2.26 | 4.84 |
| Asset Turnover | 0.39 | 1.61 |
| Fixed Asset Turnover | 3.09 | 9.01 |
| Payout Ratio | 23.17% | 5.48% |
| Dividend Yield | 0.08% | 0.16% |
Interpretation of the Ratios
Coherent, Inc.
Coherent, Inc. shows a mixed ratio profile with several unfavorable indicators including a low net margin of 0.85% and modest returns on equity (0.61%) and invested capital (1.31%). The company benefits from a strong liquidity position, evidenced by a current ratio of 2.19 and debt levels that are manageable. It does not pay dividends, likely reflecting reinvestment priorities and a challenging profitability environment.
Jabil Inc.
Jabil Inc. displays stronger profitability ratios, including a favorable 43.42% return on equity and 16.06% return on invested capital, but has concerns such as a low quick ratio of 0.66 and elevated debt-to-equity at 2.22. The company pays a modest dividend with a 0.16% yield, indicating some shareholder return despite mixed liquidity and valuation metrics.
Which one has the best ratios?
Both companies have a similar proportion of favorable ratios at 35.7%, but Jabil’s significantly higher profitability metrics offset its liquidity and leverage weaknesses. Coherent’s stronger liquidity and lower leverage contrast with weaker profitability. Overall, both present slightly unfavorable profiles, but the nature of their financial strengths and risks differ markedly.
Strategic Positioning
This section compares the strategic positioning of Coherent, Inc. and Jabil Inc., including market position, key segments, and exposure to technological disruption:
Coherent, Inc.
- Operates in laser technology with competitive pressure from specialized equipment providers.
- Focuses on lasers and materials segments serving microelectronics and scientific research.
- Moderate exposure as laser tech requires continuous innovation but less broad tech disruption.
Jabil Inc.
- Manufactures electronics and diversified products with competition in global manufacturing services.
- Diverse segments including connected living, intelligent infrastructure, and regulated industries.
- Faces high exposure due to electronics design, production, and rapid tech evolution.
Coherent, Inc. vs Jabil Inc. Positioning
Coherent, Inc. pursues a concentrated strategy focused on laser technology and precision optics, which may limit market breadth but targets niche applications. Jabil Inc. adopts a diversified manufacturing approach across multiple industries, offering broader revenue streams but facing complex operational demands.
Which has the best competitive advantage?
Jabil Inc. demonstrates a very favorable moat with growing ROIC and value creation, indicating a durable competitive advantage. Coherent, Inc. shows a very unfavorable moat with declining ROIC, reflecting value destruction and weaker competitive positioning.
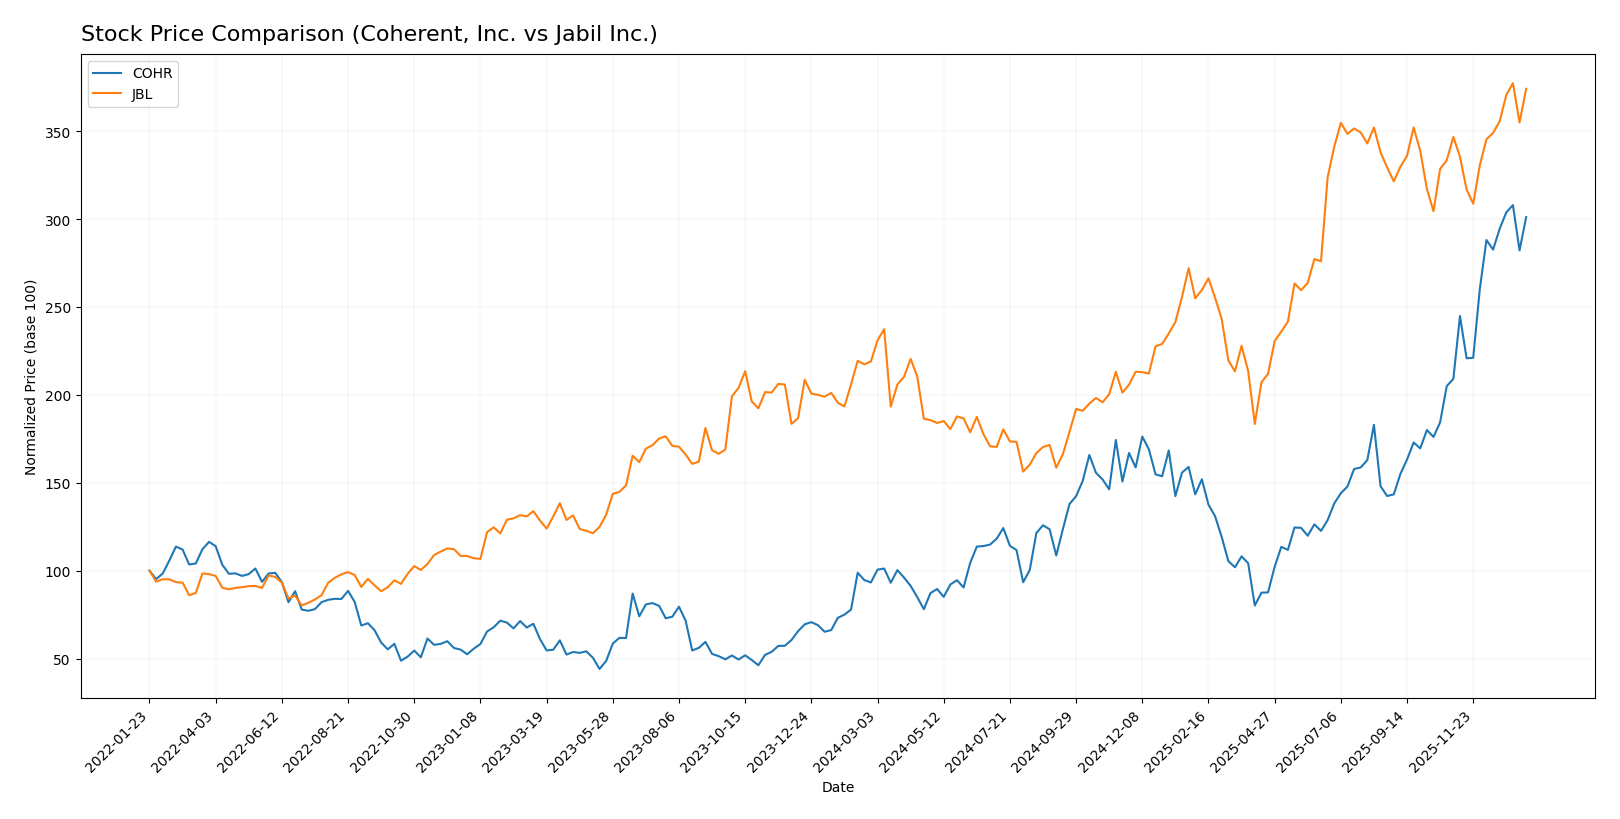
Stock Comparison
The stock price chart highlights significant bullish momentum for both Coherent, Inc. (COHR) and Jabil Inc. (JBL) over the past 12 months, with COHR showing stronger acceleration and higher volatility.
Trend Analysis
Coherent, Inc. (COHR) experienced a robust bullish trend over the past year, with a 222.85% price increase and accelerating momentum, reaching a high of 194.33 and a low of 49.26, amid notable volatility (std deviation 34.26).
Jabil Inc. (JBL) also showed a bullish trend with a 70.84% price increase and acceleration, hitting a high of 240.39 and a low of 99.62, but with higher volatility (std deviation 42.66) compared to COHR.
Comparing the two, COHR delivered the highest market performance with a substantially greater percentage gain and accelerating trend relative to JBL over the analyzed 12-month period.
Target Prices
The current analyst consensus provides clear target price ranges for both Coherent, Inc. and Jabil Inc.
| Company | Target High | Target Low | Consensus |
|---|---|---|---|
| Coherent, Inc. | 210 | 135 | 175 |
| Jabil Inc. | 283 | 244 | 260.5 |
Analysts expect Coherent, Inc.’s stock to trade near 175, slightly below its current price of 190.03. Jabil Inc.’s consensus target of 260.5 suggests potential upside from the current 238.35 price level.
Analyst Opinions Comparison
This section compares analysts’ ratings and financial scores for Coherent, Inc. and Jabil Inc.:
Rating Comparison
Coherent, Inc. Rating
- Rating: B- with a very favorable overall status.
- Discounted Cash Flow Score: 3, indicating moderate valuation based on future cash flows.
- ROE Score: 2, a moderate indicator of profit generation from shareholders’ equity.
- ROA Score: 3, reflecting moderate asset utilization efficiency.
- Debt To Equity Score: 2, indicating moderate financial risk from debt levels.
- Overall Score: 2, considered moderate overall financial standing.
Jabil Inc. Rating
- Rating: B- with a very favorable overall status.
- Discounted Cash Flow Score: 3, showing moderate valuation based on future cash flows.
- ROE Score: 5, a very favorable measure of efficient profit generation.
- ROA Score: 3, reflecting moderate asset utilization efficiency.
- Debt To Equity Score: 1, indicating very unfavorable financial risk due to high debt.
- Overall Score: 3, considered moderate overall financial standing.
Which one is the best rated?
Based strictly on the provided data, Jabil Inc. is better rated than Coherent, Inc. due to a higher overall score and a significantly stronger ROE score, despite a weaker debt-to-equity standing.
Scores Comparison
Here is a comparison of the financial scores for Coherent, Inc. and Jabil Inc.:
Coherent, Inc. Scores
- Altman Z-Score: 3.70, placing it in the safe zone, indicating low bankruptcy risk.
- Piotroski Score: 7, categorized as strong financial health.
Jabil Inc. Scores
- Altman Z-Score: 3.09, also in the safe zone, indicating low bankruptcy risk.
- Piotroski Score: 8, categorized as very strong financial health.
Which company has the best scores?
Both companies fall in the safe zone for Altman Z-Score, indicating financial stability. However, Jabil Inc. has a higher Piotroski Score of 8 compared to Coherent’s 7, suggesting slightly stronger financial health based on this metric.
Grades Comparison
Here is a comparison of the latest reliable grades for Coherent, Inc. and Jabil Inc.:
Coherent, Inc. Grades
The following table summarizes recent grades from established financial institutions for Coherent, Inc.:
| Grading Company | Action | New Grade | Date |
|---|---|---|---|
| Morgan Stanley | Maintain | Equal Weight | 2025-12-17 |
| JP Morgan | Maintain | Overweight | 2025-12-05 |
| Barclays | Maintain | Overweight | 2025-11-07 |
| Morgan Stanley | Maintain | Equal Weight | 2025-11-06 |
| Stifel | Maintain | Buy | 2025-11-06 |
| Rosenblatt | Maintain | Buy | 2025-11-06 |
| Needham | Maintain | Buy | 2025-11-06 |
| Susquehanna | Maintain | Positive | 2025-10-22 |
| Barclays | Maintain | Overweight | 2025-10-20 |
| Rosenblatt | Maintain | Buy | 2025-10-14 |
The overall trend for Coherent, Inc. shows a strong inclination toward Buy and Overweight ratings, with several firms maintaining these positive stances consistently.
Jabil Inc. Grades
This table presents recent grades from reputable financial institutions for Jabil Inc.:
| Grading Company | Action | New Grade | Date |
|---|---|---|---|
| JP Morgan | Maintain | Overweight | 2025-12-18 |
| UBS | Maintain | Neutral | 2025-12-18 |
| Barclays | Maintain | Overweight | 2025-12-18 |
| B of A Securities | Maintain | Buy | 2025-12-10 |
| Barclays | Maintain | Overweight | 2025-09-26 |
| B of A Securities | Maintain | Buy | 2025-09-26 |
| JP Morgan | Maintain | Overweight | 2025-07-17 |
| B of A Securities | Maintain | Buy | 2025-06-20 |
| UBS | Maintain | Neutral | 2025-06-18 |
| JP Morgan | Maintain | Overweight | 2025-06-18 |
Grades for Jabil Inc. mostly range from Buy to Overweight, with some Neutral ratings, reflecting a generally positive but slightly more mixed analyst sentiment.
Which company has the best grades?
Coherent, Inc. has received a higher proportion of Buy and Overweight grades compared to Jabil Inc., which has a notable number of Neutral ratings. This difference may suggest stronger analyst confidence in Coherent, Inc., potentially influencing investors seeking greater growth optimism.
Strengths and Weaknesses
Below is a comparison table highlighting the key strengths and weaknesses of Coherent, Inc. (COHR) and Jabil Inc. (JBL) based on their latest financial and strategic data.
| Criterion | Coherent, Inc. (COHR) | Jabil Inc. (JBL) |
|---|---|---|
| Diversification | Moderate: Focus on Lasers and Materials segments with revenues of 1.43B and 954M respectively in 2025. | High: Diverse segments including Connected Living, Intelligent Infrastructure, and Regulated Industries with total revenues exceeding 29B in 2025. |
| Profitability | Low profitability: ROIC at 1.31%, net margin 0.85%, and declining ROIC trend; company is shedding value. | Strong profitability: ROIC at 16.06%, ROE 43.42%, growing ROIC trend; company creating value. |
| Innovation | Moderate: Stable presence in laser technologies, but declining profitability suggests innovation challenges. | High: Broad digital commerce and smart infrastructure focus, supporting growth and competitive advantage. |
| Global presence | Moderate: Niche laser and materials markets with some global exposure. | Extensive: Global footprint serving multiple industries worldwide. |
| Market Share | Specialized market segments with moderate share; facing competitive pressures. | Large market share in EMS and digital commerce sectors, supported by broad client base. |
Key takeaway: Jabil demonstrates a clear competitive advantage with diversified operations, strong profitability, and growing returns, making it a more attractive investment. Coherent’s declining profitability and limited diversification highlight potential risks that require careful consideration.
Risk Analysis
Below is a comparative table of key risks for Coherent, Inc. (COHR) and Jabil Inc. (JBL) based on the most recent 2025 data:
| Metric | Coherent, Inc. (COHR) | Jabil Inc. (JBL) |
|---|---|---|
| Market Risk | High beta at 1.835, indicating higher volatility | Moderate beta at 1.246, less volatile |
| Debt level | Moderate debt-to-equity ratio of 0.48, favorable leverage | High debt-to-equity ratio of 2.22, riskier leverage |
| Regulatory Risk | Moderate, typical for technology hardware sector | Moderate, with global manufacturing exposure |
| Operational Risk | Moderate, complexity in laser tech production | Higher, due to diverse and global manufacturing operations |
| Environmental Risk | Moderate, some exposure to industrial emissions | Moderate, with manufacturing footprint globally |
| Geopolitical Risk | Moderate, international sales presence | Elevated, due to extensive global supply chains |
In 2025, Coherent’s most impactful risks stem from market volatility and modest operational complexity, but it maintains favorable debt levels and strong liquidity. Jabil faces higher financial risk due to heavier debt and complex global operations, increasing exposure to geopolitical tensions. Both companies remain in the safe zone for bankruptcy risk, but Jabil’s leverage and operational scale warrant cautious monitoring.
Which Stock to Choose?
Coherent, Inc. (COHR) shows strong recent income growth with a 23.42% revenue increase and favorable gross margin at 35.41%. However, profitability ratios like net margin (0.85%) and ROE (0.61%) remain unfavorable, while debt metrics appear favorable. Its rating is very favorable overall despite mixed financial ratios.
Jabil Inc. (JBL) exhibits moderate income growth and a lower gross margin of 8.88%. It has favorable profitability ratios, including a high ROE of 43.42%, but carries higher debt levels. JBL’s overall rating is also very favorable, with financial ratios slightly better balanced than COHR’s.
Investors with a risk-tolerant profile seeking growth might find COHR attractive due to its strong recent income growth and favorable income statement, while those prioritizing durable value creation and consistent profitability may lean towards JBL, given its favorable moat, higher ROE, and stable financial ratios.
Disclaimer: Investment carries a risk of loss of initial capital. The past performance is not a reliable indicator of future results. Be sure to understand risks before making an investment decision.
Go Further
I encourage you to read the complete analyses of Coherent, Inc. and Jabil Inc. to enhance your investment decisions: