Garmin Ltd. and Coherent, Inc. stand out as key players in the hardware and equipment industry, each pushing innovation in distinct yet overlapping technology markets. Garmin excels in consumer and professional navigation and wearable devices, while Coherent leads in laser technologies for industrial and scientific use. Comparing these companies offers valuable insight into their growth and innovation strategies. This analysis will help you decide which is the more compelling investment opportunity.
Table of contents
Companies Overview
I will begin the comparison between Garmin Ltd. and Coherent, Inc. by providing an overview of these two companies and their main differences.
Garmin Ltd. Overview
Garmin Ltd. designs, develops, manufactures, and markets wireless devices across several segments including fitness, outdoor, aviation, marine, and automotive. The company serves global markets such as the Americas, Asia Pacific, Europe, and more. Founded in 1989 and based in Switzerland, Garmin holds a strong position in hardware, equipment, and parts, with a market cap of $41B and a focus on innovation in GPS and wearable technologies.
Coherent, Inc. Overview
Coherent, Inc. provides lasers, laser-based technologies, and system solutions for commercial, industrial, and scientific research applications. Operating through OEM Laser Sources and Industrial Lasers & Systems segments, Coherent develops precision optics and laser measurement products. Headquartered in California since 1966, the company has a market cap of $29.5B and sells primarily through direct and independent sales channels, now operating as a subsidiary of II-VI Incorporated.
Key similarities and differences
Both Garmin and Coherent operate in the technology sector under hardware, equipment, and parts industries, focusing on specialized hardware solutions. Garmin emphasizes wireless devices across diverse consumer and professional markets, while Coherent concentrates on laser technologies for industrial and scientific uses. Garmin’s product range is broader geographically and in application areas, whereas Coherent’s business is more niche, with a stronger focus on OEM and industrial laser systems.
Income Statement Comparison
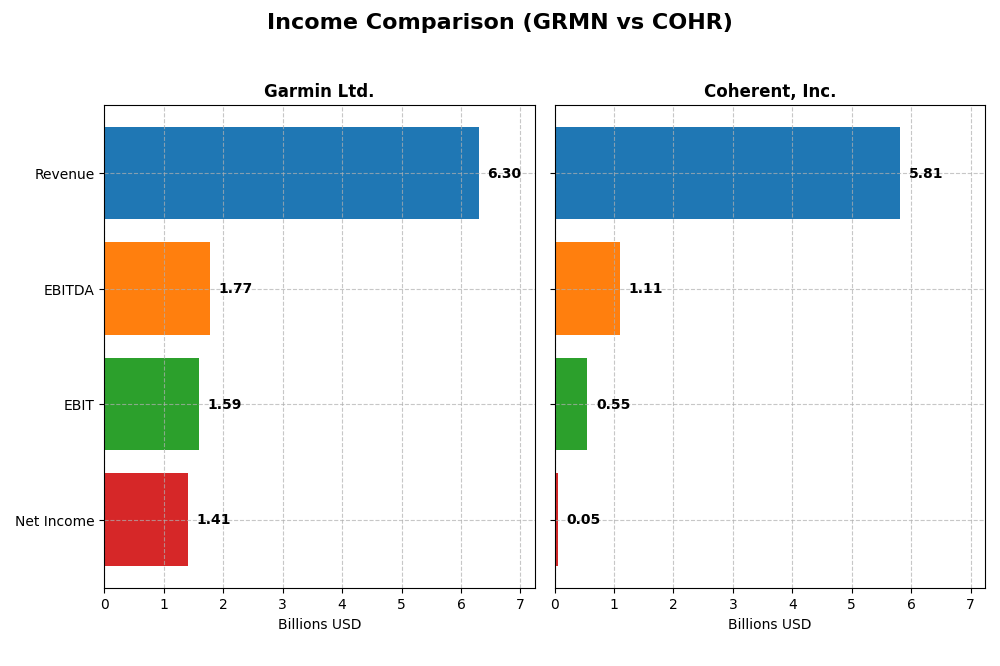
The table below presents a side-by-side comparison of the most recent fiscal year income statement metrics for Garmin Ltd. and Coherent, Inc., highlighting key financial figures.
| Metric | Garmin Ltd. (GRMN) | Coherent, Inc. (COHR) |
|---|---|---|
| Market Cap | 41.2B | 29.5B |
| Revenue | 6.30B | 5.81B |
| EBITDA | 1.77B | 1.11B |
| EBIT | 1.59B | 552M |
| Net Income | 1.41B | -81M |
| EPS | 7.35 | -0.52 |
| Fiscal Year | 2024 | 2025 |
Income Statement Interpretations
Garmin Ltd.
Garmin Ltd. has demonstrated consistent revenue growth, increasing from $4.19B in 2020 to $6.3B in 2024, with net income rising steadily from $992M to $1.41B. Margins remain strong, with a gross margin of 58.7% and EBIT margin of 25.31% in 2024. The latest year shows accelerated revenue growth of 20.44%, but a slight net margin decline of 9.13%.
Coherent, Inc.
Coherent, Inc. reported revenue growth from $3.11B in 2021 to $5.81B in 2025, yet net income has been volatile, turning negative and only recovering to a modest $49M loss in 2025. Gross margin improved to 35.41%, but EBIT margin remains low at 9.5%. The most recent year saw a strong 23.42% revenue increase and sharp EBIT growth of 348%, offset by overall net income pressure over the period.
Which one has the stronger fundamentals?
Garmin exhibits more stable and favorable fundamentals with strong margin profiles and consistent net income growth over five years. Coherent, despite recent improvements in revenue and EBIT, shows significant net income volatility and weaker margins. Garmin’s lower interest expense and higher profitability ratios further underscore its comparatively stronger income statement performance.
Financial Ratios Comparison
Below is a comparison of key financial ratios for Garmin Ltd. and Coherent, Inc. based on the most recent fiscal year data available.
| Ratios | Garmin Ltd. (2024) | Coherent, Inc. (2025) |
|---|---|---|
| ROE | 18.0% | 0.6% |
| ROIC | 16.3% | 1.3% |
| P/E | 28.5 | 280 |
| P/B | 5.13 | 1.70 |
| Current Ratio | 3.54 | 2.19 |
| Quick Ratio | 2.56 | 1.39 |
| D/E (Debt to Equity) | 0.021 | 0.48 |
| Debt-to-Assets | 1.7% | 26.1% |
| Interest Coverage | 0 | 2.26 |
| Asset Turnover | 0.65 | 0.39 |
| Fixed Asset Turnover | 4.49 | 3.09 |
| Payout Ratio | 40.6% | 23.2% |
| Dividend Yield | 1.42% | 0.08% |
Interpretation of the Ratios
Garmin Ltd.
Garmin exhibits generally strong financial ratios with favorable net margin at 22.41%, ROE of 17.98%, and ROIC at 16.28%, indicating effective profitability and capital use. Some concerns arise from its high P/E at 28.5 and P/B ratio at 5.13, which may imply overvaluation risks. Its dividend yield is stable at 1.42%, supported by solid free cash flow coverage and modest payout.
Coherent, Inc.
Coherent’s ratios reveal weaknesses, with very low net margin of 0.85%, ROE at 0.61%, and ROIC at 1.31%, reflecting limited profitability and capital efficiency. The P/E ratio is extremely high at 279.75, signaling possible market skepticism or growth expectations. It does not pay a dividend, likely due to negative net income or reinvestment priorities, and has moderate leverage with a debt-to-equity ratio of 0.48.
Which one has the best ratios?
Garmin’s ratios are predominantly favorable, especially in profitability and capital management, despite some valuation concerns. Coherent’s metrics are less convincing, showing significant profitability challenges and high valuation multiples. Overall, Garmin demonstrates stronger financial health and stability based on the provided ratio evaluations.
Strategic Positioning
This section compares the strategic positioning of Garmin Ltd. and Coherent, Inc. regarding market position, key segments, and exposure to technological disruption:
Garmin Ltd.
- Established global hardware provider with diversified product lines facing moderate competition.
- Diverse segments including Fitness, Outdoor, Marine, Aviation, and Automotive Mobile driving growth.
- Moderate exposure to disruption with evolving wearable tech and avionics; stable innovation needed.
Coherent, Inc.
- Specialist in lasers and optics with high beta, indicating significant market volatility.
- Focused on two segments: Lasers and Materials, targeting commercial, industrial, and research.
- High exposure due to reliance on advanced laser technologies subject to rapid scientific change.
Garmin Ltd. vs Coherent, Inc. Positioning
Garmin exhibits a diversified business model across several hardware segments, reducing reliance on any single market. Coherent concentrates on laser technologies, which may increase risk but allows focus on specialized industrial and scientific applications.
Which has the best competitive advantage?
Garmin shows a favorable MOAT with value creation and stable profitability, while Coherent’s very unfavorable MOAT indicates declining returns and value destruction, suggesting Garmin currently holds a stronger competitive advantage.
Stock Comparison
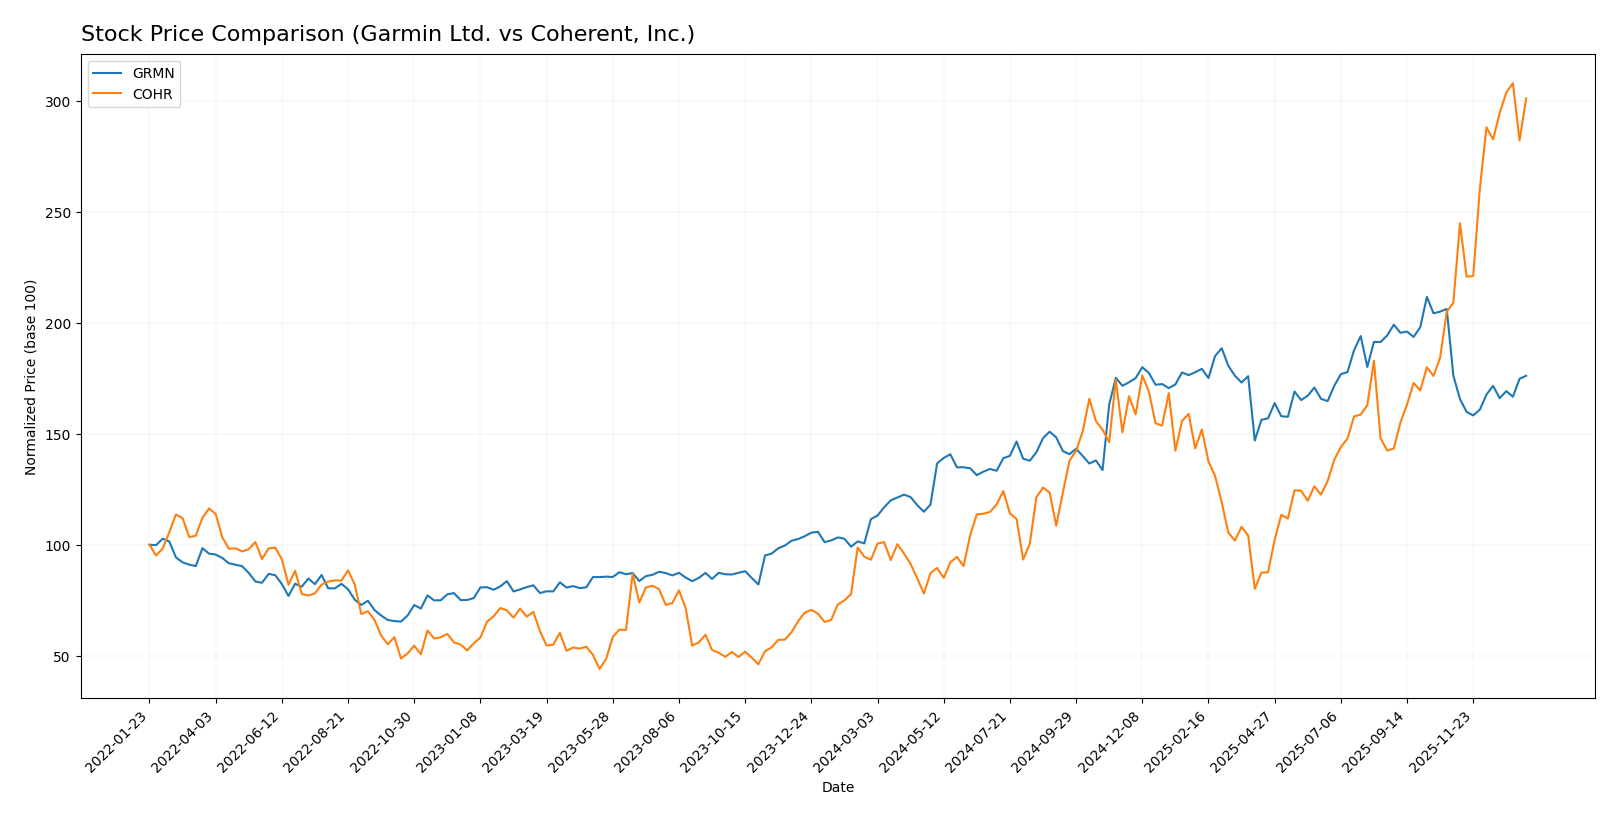
The past year showed significant bullish momentum for both Garmin Ltd. and Coherent, Inc., with Coherent exhibiting stronger price gains and more pronounced trading activity, while Garmin’s recent price trend has stabilized.
Trend Analysis
Garmin Ltd. experienced a 57.86% price increase over the past 12 months, indicating a bullish trend with acceleration. The stock ranged between 135.51 and 257.06, showing high volatility with a 29.55 std deviation.
Coherent, Inc. showed a 222.85% price increase over the same period, also bullish with acceleration. It recorded a high volatility of 34.26 std deviation, with prices between 49.26 and 194.33. Recent months show a strong 44.01% rise.
Comparing both, Coherent delivered the highest market performance with a 222.85% increase, outperforming Garmin’s 57.86%, supported by stronger recent price gains and buyer dominance.
Target Prices
Here is the current consensus on target prices from verified analysts for Garmin Ltd. and Coherent, Inc.:
| Company | Target High | Target Low | Consensus |
|---|---|---|---|
| Garmin Ltd. | 310 | 193 | 237 |
| Coherent, Inc. | 210 | 135 | 175 |
Analysts expect Garmin’s stock to have upside potential above its current price of 214 USD, while Coherent’s consensus target price suggests moderate growth potential compared to its current price of 190 USD.
Analyst Opinions Comparison
This section compares analysts’ ratings and grades for Garmin Ltd. and Coherent, Inc.:
Rating Comparison
Garmin Ltd. Rating
- Rating: A- indicating a very favorable overall evaluation.
- Discounted Cash Flow Score: Moderate, with a score of 3.
- ROE Score: Favorable at 4, showing efficient profit generation.
- ROA Score: Very favorable at 5, strong asset utilization.
- Debt To Equity Score: Favorable at 4, reflecting financial stability.
- Overall Score: Favorable with a 4 out of 5 rating.
Coherent, Inc. Rating
- Rating: B- with a moderate overall evaluation.
- Discounted Cash Flow Score: Moderate, also scored 3.
- ROE Score: Moderate at 2, indicating less efficient profitability.
- ROA Score: Moderate at 3, moderate effectiveness in asset use.
- Debt To Equity Score: Moderate at 2, indicating higher financial risk.
- Overall Score: Moderate with a 2 out of 5 rating.
Which one is the best rated?
Garmin Ltd. holds a stronger position with higher ratings across ROE, ROA, debt-to-equity, and overall score compared to Coherent, Inc., whose scores are moderate in all categories.
Scores Comparison
Here is a comparison of the Altman Z-Score and Piotroski Score for Garmin Ltd. and Coherent, Inc.:
Garmin Ltd. Scores
- Altman Z-Score: 14.62, indicating a safe zone with very low bankruptcy risk.
- Piotroski Score: 5, reflecting average financial strength.
Coherent, Inc. Scores
- Altman Z-Score: 3.70, also in the safe zone, indicating low bankruptcy risk.
- Piotroski Score: 7, indicating strong financial health.
Which company has the best scores?
Coherent, Inc. has a lower but still safe Altman Z-Score and a stronger Piotroski Score than Garmin Ltd., which shows better overall financial strength based strictly on these scores.
Grades Comparison
Here is a comparison of the latest reliable grades assigned to Garmin Ltd. and Coherent, Inc.:
Garmin Ltd. Grades
The table below summarizes recent grades from recognized financial institutions for Garmin Ltd.:
| Grading Company | Action | New Grade | Date |
|---|---|---|---|
| Tigress Financial | Maintain | Strong Buy | 2025-12-19 |
| Longbow Research | Upgrade | Buy | 2025-12-03 |
| Barclays | Maintain | Underweight | 2025-10-30 |
| Morgan Stanley | Maintain | Underweight | 2025-10-30 |
| Tigress Financial | Maintain | Strong Buy | 2025-09-30 |
| Morgan Stanley | Maintain | Underweight | 2025-09-19 |
| Morgan Stanley | Maintain | Underweight | 2025-07-31 |
| Barclays | Maintain | Underweight | 2025-07-31 |
| JP Morgan | Maintain | Neutral | 2025-07-17 |
| JP Morgan | Maintain | Neutral | 2025-05-01 |
Garmin Ltd. shows a mixed trend with strong buy ratings from Tigress Financial, a recent upgrade to buy by Longbow Research, but persistent underweight ratings from Barclays and Morgan Stanley.
Coherent, Inc. Grades
The following table presents recent grades from reputable grading companies for Coherent, Inc.:
| Grading Company | Action | New Grade | Date |
|---|---|---|---|
| Morgan Stanley | Maintain | Equal Weight | 2025-12-17 |
| JP Morgan | Maintain | Overweight | 2025-12-05 |
| Barclays | Maintain | Overweight | 2025-11-07 |
| Morgan Stanley | Maintain | Equal Weight | 2025-11-06 |
| Stifel | Maintain | Buy | 2025-11-06 |
| Rosenblatt | Maintain | Buy | 2025-11-06 |
| Needham | Maintain | Buy | 2025-11-06 |
| Susquehanna | Maintain | Positive | 2025-10-22 |
| Barclays | Maintain | Overweight | 2025-10-20 |
| Rosenblatt | Maintain | Buy | 2025-10-14 |
Coherent, Inc. has predominantly positive grades, with multiple buy and overweight ratings and no sell recommendations.
Which company has the best grades?
Coherent, Inc. has received overall more favorable grades, including numerous buy and overweight ratings, while Garmin Ltd. has a more mixed profile with strong buys but also underweight ratings. This divergence may influence investor sentiment and portfolio decisions differently for each company.
Strengths and Weaknesses
The table below summarizes the key strengths and weaknesses of Garmin Ltd. (GRMN) and Coherent, Inc. (COHR) based on recent financial performance, innovation capacity, diversification, global reach, and market position.
| Criterion | Garmin Ltd. (GRMN) | Coherent, Inc. (COHR) |
|---|---|---|
| Diversification | Highly diversified across Automotive, Fitness, Outdoor, Marine, and Aviation segments with steady revenue growth | Moderate diversification focused on Lasers and Materials segments, with uneven revenue trends |
| Profitability | Strong profitability: ROIC 16.28%, Net Margin 22.41%, ROE 17.98% | Weak profitability: ROIC 1.31%, Net Margin 0.85%, ROE 0.61%, negative value creation |
| Innovation | Consistent investment in product innovation in multiple specialized markets | Innovation challenged by declining ROIC and high P/E ratio, indicating market skepticism |
| Global presence | Well-established global footprint with stable market position | Global presence exists but profitability and competitive advantage are weak |
| Market Share | Solid market share in niche segments with favorable economic moat | Losing market share, economic moat very unfavorable due to declining returns |
Key takeaways: Garmin demonstrates a favorable investment profile with strong profitability, diversification, and a stable competitive moat. Conversely, Coherent shows significant challenges including declining profitability and value destruction, warranting caution for investors.
Risk Analysis
Below is a comparative table of key risks for Garmin Ltd. (GRMN) and Coherent, Inc. (COHR) based on the most recent data available in 2026:
| Metric | Garmin Ltd. (GRMN) | Coherent, Inc. (COHR) |
|---|---|---|
| Market Risk | Moderate (Beta 1.01, stable market cap ~$41B) | High (Beta 1.84, volatile stock price range) |
| Debt level | Very low (Debt/Equity 0.02, Debt-to-assets 1.69%) | Moderate (Debt/Equity 0.48, Debt-to-assets 26.11%) |
| Regulatory Risk | Moderate (Global operations, diverse regulatory environments) | Moderate (US-based, subject to export controls on tech) |
| Operational Risk | Low (Well-diversified product lines, strong supply chain) | Moderate (Integration risks post II-VI acquisition) |
| Environmental Risk | Low (Consumer electronics focus, manageable footprint) | Moderate (Industrial laser manufacturing, energy consumption) |
| Geopolitical Risk | Moderate (Exposure to global markets including Asia, Europe) | Moderate to High (High-tech sector sensitive to US-China tensions) |
Garmin’s risks are generally moderate with strengths in low debt and operational stability, while Coherent faces higher market volatility and debt levels. The most impactful risks include Coherent’s elevated market beta and debt, and Garmin’s exposure to diverse regulatory environments globally. Investors should weigh these factors carefully for portfolio risk management.
Which Stock to Choose?
Garmin Ltd. (GRMN) shows a favorable income evolution with strong revenue and net income growth over 2020–2024, robust profitability, low debt levels, and a very favorable rating of A-. Its financial ratios mostly indicate strength, including a high ROE of 17.98% and low debt-to-equity of 0.02, despite some moderate concerns on valuation multiples.
Coherent, Inc. (COHR) has a favorable recent income growth but negative net income growth over the overall period 2021–2025. Profitability ratios remain weak, with ROE at 0.61%, and moderate debt levels (debt-to-equity 0.48). Its rating is B-, reflecting mixed financial health with some strengths but also significant challenges.
For investors, Garmin’s very favorable rating and consistent value creation as indicated by a ROIC well above WACC suggest it might appeal to those seeking quality and stable profitability. Coherent’s profile with accelerating stock price but weaker profitability and value destruction could be of interest to risk-tolerant investors focused on growth potential despite higher financial risk.
Disclaimer: Investment carries a risk of loss of initial capital. The past performance is not a reliable indicator of future results. Be sure to understand risks before making an investment decision.
Go Further
I encourage you to read the complete analyses of Garmin Ltd. and Coherent, Inc. to enhance your investment decisions: