Home > Comparison > Technology > COHR vs FTV
The strategic rivalry between Coherent, Inc. and Fortive Corporation shapes the competitive landscape of the Technology sector’s Hardware, Equipment & Parts industry. Coherent excels as a laser technology specialist with precision optics, while Fortive operates as a diversified industrial technology provider with software and measurement tools. This analysis pits focused innovation against broad-based engineering, aiming to identify which path delivers superior risk-adjusted returns for a diversified portfolio.
Table of contents
Companies Overview
Coherent, Inc. and Fortive Corporation stand as pivotal players within the hardware and equipment sector, shaping industrial technology markets.
Coherent, Inc.: Laser Technology Pioneer
Coherent, Inc. leads as a laser technology provider, generating revenue primarily through manufacturing and servicing laser systems for commercial, industrial, and scientific uses. Its strategic focus centers on advancing OEM laser sources and industrial laser systems to support microelectronics and materials processing, reinforcing its competitive edge in precision optics and laser measurement.
Fortive Corporation: Diversified Industrial Innovator
Fortive Corporation operates as a multi-segment industrial technology firm, earning revenue from professional tools, software, and precision measurement instruments. Its 2026 strategy emphasizes connected reliability tools and healthcare solutions, driving growth across manufacturing, aerospace, and healthcare verticals through a broad brand portfolio spanning from FLUKE to TEKTRONIX.
Strategic Collision: Similarities & Divergences
Both companies compete in industrial hardware yet diverge in scope; Coherent focuses narrowly on laser precision technologies, while Fortive pursues a diversified, software-integrated approach. Their primary battleground lies in delivering advanced instrumentation for industrial and healthcare markets. Coherent offers a specialized investment profile, contrasting with Fortive’s broader, multi-industry exposure.
Income Statement Comparison
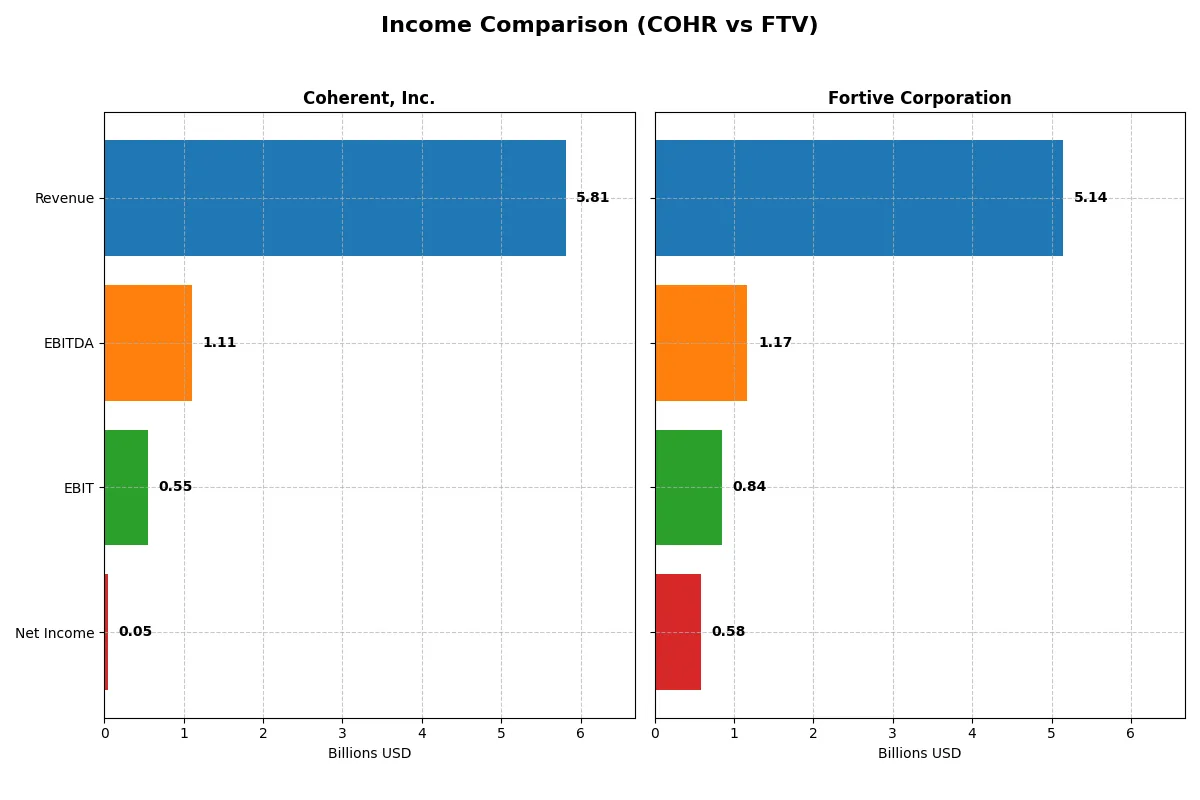
This data dissects the core profitability and scalability of both corporate engines to reveal who dominates the bottom line:
| Metric | Coherent, Inc. (COHR) | Fortive Corporation (FTV) |
|---|---|---|
| Revenue | 5.81B | 5.14B |
| Cost of Revenue | 3.75B | 2.01B |
| Operating Expenses | 1.51B | 2.23B |
| Gross Profit | 2.06B | 3.13B |
| EBITDA | 1.11B | 1.17B |
| EBIT | 552M | 843M |
| Interest Expense | 243M | 121M |
| Net Income | 49M | 579M |
| EPS | -0.52 | 1.75 |
| Fiscal Year | 2025 | 2025 |
Income Statement Analysis: The Bottom-Line Duel
This income statement comparison reveals which company optimizes its financial engine for growth, efficiency, and profitability.
Coherent, Inc. Analysis
Coherent’s revenue climbed sharply from 3.3B in 2022 to 5.8B in 2025, with gross margins steady around 35%. Despite this growth, net income turned negative in recent years, reflecting pressure on net margins and profitability. The 2025 year showed improved EBIT margin at 9.5%, signaling operational momentum despite a thin 0.85% net margin.
Fortive Corporation Analysis
Fortive posted robust revenues consistently above 5B, peaking near 6.2B in 2024 before a 17% dip in 2025. Its gross margin remains strong at nearly 61%, with a solid 16.4% EBIT margin and double-digit net margin of 11.3%. Though 2025 saw declines across profitability metrics, Fortive sustains higher operational efficiency and net income strength than Coherent.
Margin Power vs. Revenue Scale
Coherent drives top-line growth with improving operating efficiency but struggles with net profitability and earnings consistency. Fortive offers superior margins and stable net income, albeit with recent revenue contractions. For investors prioritizing margin resilience and steady profits, Fortive’s profile appears more attractive amid current market conditions.
Financial Ratios Comparison
These vital ratios act as a diagnostic tool to expose the underlying fiscal health, valuation premiums, and capital efficiency of the companies compared:
| Ratios | Coherent, Inc. (COHR) | Fortive Corporation (FTV) |
|---|---|---|
| ROE | 0.6% | 9.0% |
| ROIC | 1.3% | 7.4% |
| P/E | 280x | 30x |
| P/B | 1.70x | 2.71x |
| Current Ratio | 2.19 | 0.71 |
| Quick Ratio | 1.39 | 0.58 |
| D/E | 0.48 | 0.50 |
| Debt-to-Assets | 26.1% | 27.3% |
| Interest Coverage | 2.26x | 7.54x |
| Asset Turnover | 0.39 | 0.44 |
| Fixed Asset Turnover | 3.09 | 19.06 |
| Payout ratio | 23.2% | 15.9% |
| Dividend yield | 0.08% | 0.53% |
| Fiscal Year | 2025 | 2025 |
Efficiency & Valuation Duel: The Vital Signs
Financial ratios serve as a company’s DNA, revealing hidden risks and operational excellence crucial for investment decisions.
Coherent, Inc.
Coherent shows weak core profitability with a ROE of 0.61% and a net margin below 1%, signaling operational struggles. The stock trades at an extreme P/E of 280, indicating it is highly stretched. Dividend yield is minimal at 0.08%, reflecting limited shareholder returns and a focus on reinvestment through R&D (10% of revenue).
Fortive Corporation
Fortive demonstrates solid profitability with an 11.3% net margin and an ROE near 9%, highlighting efficient operations. Its P/E of 30.2 suggests a premium but more reasonable valuation than Coherent. The dividend yield of 0.53% offers modest returns, while strong free cash flow supports ongoing growth investments and moderate shareholder payouts.
Premium Valuation vs. Operational Safety
Fortive balances risk and reward better with healthier margins, a sustainable ROE, and a moderate valuation. Coherent’s stretched valuation and weak profitability raise red flags. Investors seeking operational stability and value alignment may prefer Fortive’s profile.
Which one offers the Superior Shareholder Reward?
I see Fortive (FTV) delivers a more balanced and sustainable shareholder reward than Coherent (COHR) in 2026. Fortive pays a steady 0.53% dividend yield with a modest 13–16% payout ratio, backed by strong free cash flow coverage (~90%). Fortive’s disciplined buybacks complement dividends, enhancing total returns. In contrast, Coherent’s dividend yield is negligible (~0.08%) with a low payout ratio (~23%), and its free cash flow barely covers dividends. Coherent relies heavily on reinvestment amid volatile margins and weak profitability, limiting immediate shareholder rewards. Fortive’s consistent cash returns and buybacks offer superior long-term value and total return potential.
Comparative Score Analysis: The Strategic Profile
The radar chart reveals the fundamental DNA and trade-offs of Coherent, Inc. and Fortive Corporation, outlining their financial strengths and vulnerabilities:
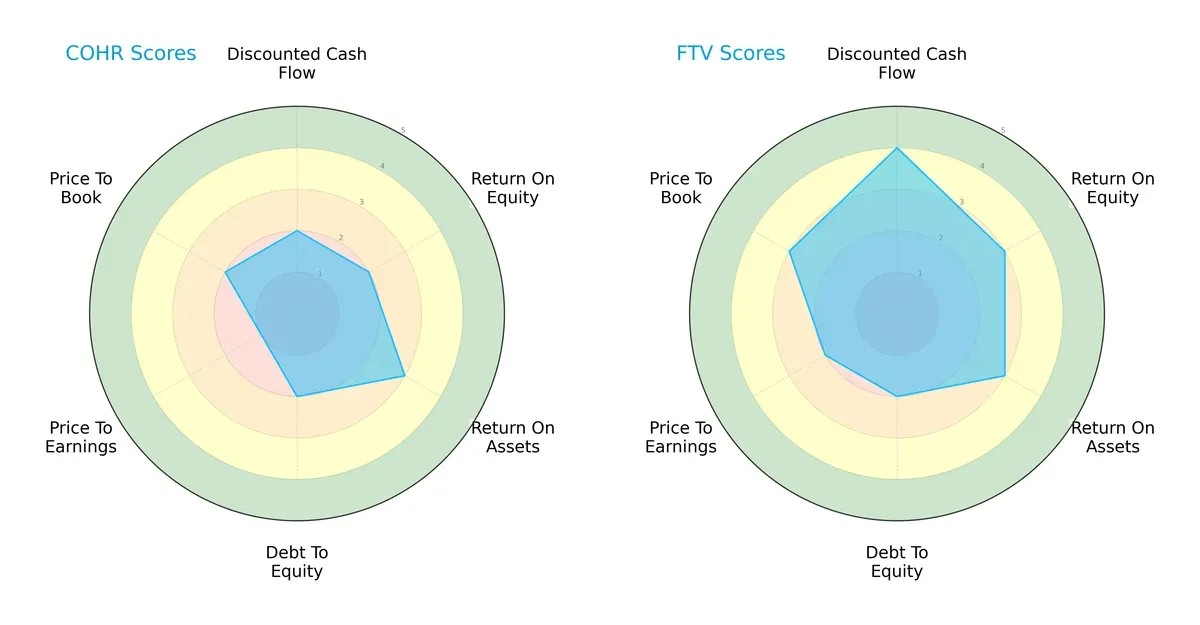
Fortive outperforms Coherent with a higher overall score (3 vs. 2), driven by a strong Discounted Cash Flow score (4 vs. 2) and better Return on Equity (3 vs. 2). Both firms share moderate Return on Assets (3) and identical Debt-to-Equity scores (2), signaling similar leverage risk. Coherent’s valuation metrics lag significantly, with a very unfavorable Price-to-Earnings score (1 vs. 2) and a weaker Price-to-Book (2 vs. 3). Fortive presents a more balanced financial profile, while Coherent depends on a limited asset efficiency edge.
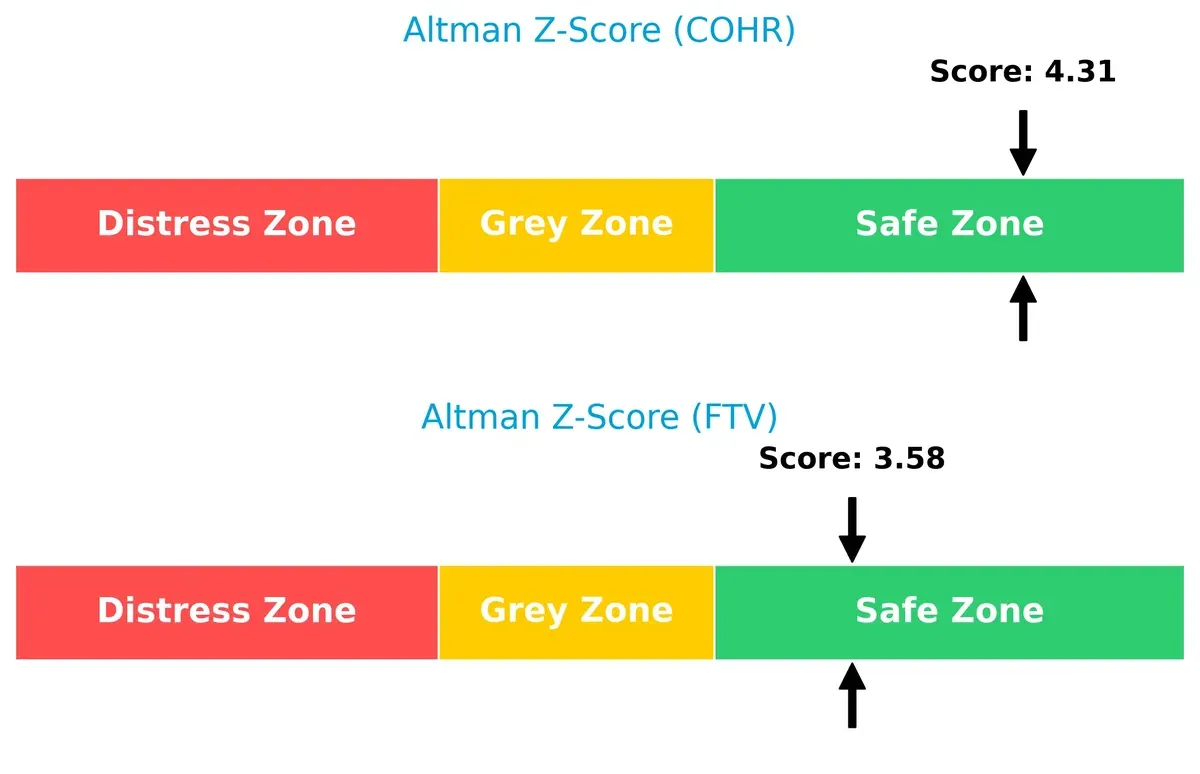
Bankruptcy Risk: Solvency Showdown
The Altman Z-Scores place both companies firmly in the safe zone, with Coherent scoring 4.31 and Fortive 3.58, indicating solid long-term survival prospects in this cycle:
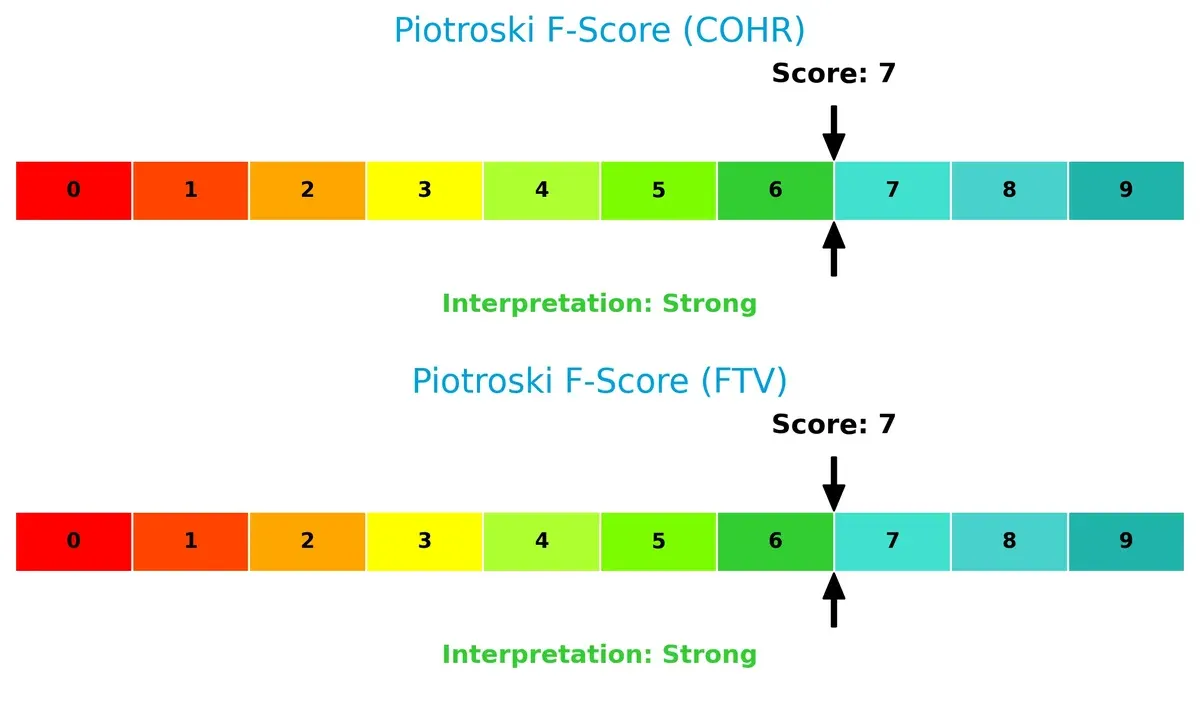
Financial Health: Quality of Operations
Both firms share strong Piotroski F-Scores of 7, reflecting robust internal financial health with no immediate red flags in profitability, leverage, or liquidity metrics:
How are the two companies positioned?
This section dissects the operational DNA of Coherent and Fortive by comparing their revenue distribution by segment and internal dynamics. The goal is to confront their economic moats and identify which business model offers the most resilient, sustainable competitive advantage today.
Revenue Segmentation: The Strategic Mix
This visual comparison dissects how Coherent, Inc. and Fortive Corporation diversify their income streams and where their primary sector bets lie:
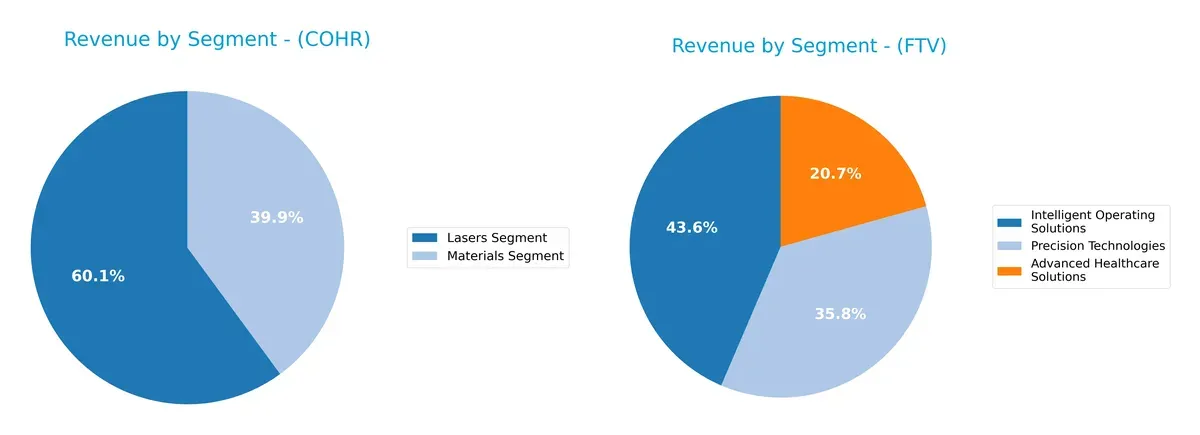
Coherent anchors its revenue in two segments: Lasers at $1.43B and Materials at $954M in 2025, showing moderate diversification. Fortive dwarfs this with a broader mix: Intelligent Operating Solutions leads at $2.71B, followed by Precision Technologies at $2.23B, and Advanced Healthcare Solutions at $1.29B in 2024. Fortive’s tri-segment spread reduces concentration risk, while Coherent’s reliance on lasers signals exposure to tech cycle swings but also potential for niche dominance.
Strengths and Weaknesses Comparison
This table compares the strengths and weaknesses of Coherent, Inc. and Fortive Corporation:
Coherent, Inc. Strengths
- Strong liquidity with current ratio of 2.19
- Low debt-to-assets at 26.11%
- Favorable fixed asset turnover of 3.09
- Balanced revenue from lasers and materials segments
- Diverse global sales across North America, Europe, and Asia
Fortive Corporation Strengths
- Favorable net margin of 11.26%
- Low WACC at 7.86% indicating efficient capital costs
- Strong interest coverage ratio of 7.0
- High fixed asset turnover of 19.06
- Broad product diversification across three segments
- Extensive global presence with large US and international sales
Coherent, Inc. Weaknesses
- Very low profitability metrics: net margin 0.85%, ROE 0.61%, ROIC 1.31% below WACC 11.81%
- High P/E of 279.75 signals overvaluation or low earnings
- Low asset turnover of 0.39 limits operational efficiency
- Dividend yield only 0.08%
- Less diversified product base with two main segments
Fortive Corporation Weaknesses
- Current and quick ratios below 1 indicate liquidity risk
- ROE at 8.98% is unfavorable relative to peers
- P/E of 30.16 is on the higher side
- Dividend yield moderate at 0.53%
- Asset turnover low at 0.44 despite high fixed asset efficiency
Coherent, Inc. shows strengths in liquidity and asset management but suffers from poor profitability and valuation concerns. Fortive displays better profitability and capital efficiency but faces liquidity constraints and modest returns on equity. These factors shape each company’s strategic focus on operational improvement and financial stability.
The Moat Duel: Analyzing Competitive Defensibility
A structural moat alone shields long-term profits from relentless competitive erosion. Let’s dissect how Coherent and Fortive defend their turf:
Coherent, Inc.: Intangible Assets Powering Precision Lasers
Coherent leverages proprietary laser technologies and precision optics, reflected in solid gross margin (35%) but declining ROIC signals weakening capital efficiency. New industrial laser markets in 2026 may pressure its moat further.
Fortive Corporation: Diversified Portfolio with Operational Excellence
Fortive’s moat stems from a broad brand portfolio and recurring software services, driving strong margins (61%) and improving ROIC trends despite recent revenue dips. Expansion into connected reliability tools could deepen its competitive edge.
Verdict: Precision Tech Intangibles vs. Diversified Operational Strength
Fortive holds a wider moat with improving ROIC and robust margins, while Coherent’s shrinking capital returns signal a narrowing moat. Fortive is better positioned to defend and grow market share in 2026.
Which stock offers better returns?
Both Coherent, Inc. and Fortive Corporation exhibit distinct price movements and trading dynamics over the past year, reflecting divergent market performances and investor sentiment.
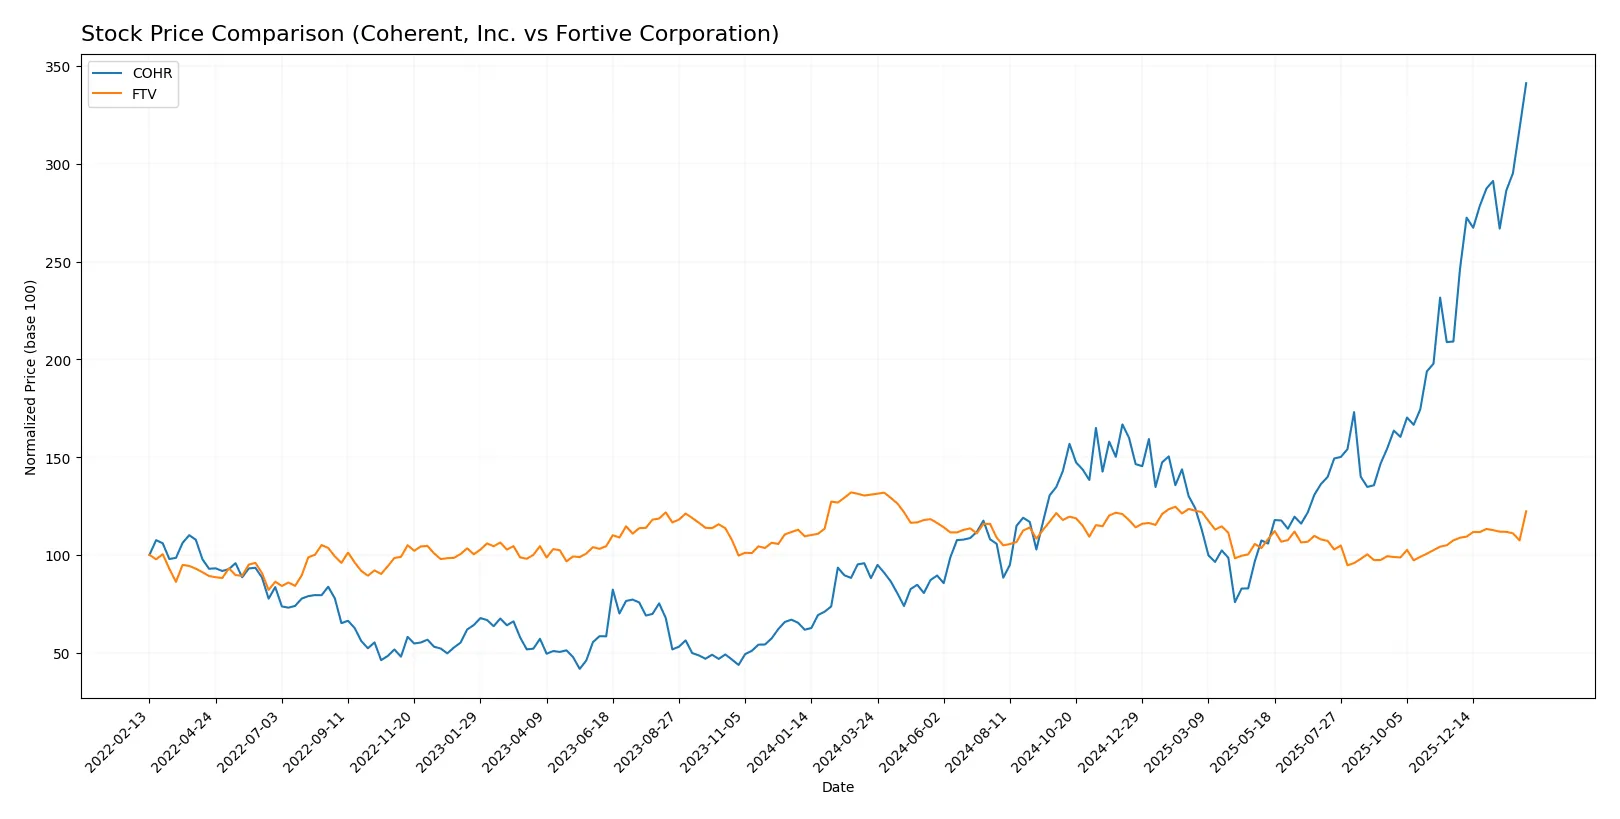
Trend Comparison
Coherent, Inc. shows a strong bullish trend with a 287.47% price increase over the past 12 months, marked by accelerating gains and high volatility (std dev 39.53). The stock reached a high of 227.68 and a low of 49.26.
Fortive Corporation presents a bearish trend, losing 6.53% over the last year despite accelerating momentum. Its price fluctuated between 46.55 and 64.82, with lower volatility (std dev 4.16).
Coherent, Inc. outperformed Fortive in market returns, delivering a robust 287.47% gain versus Fortive’s 6.53% decline over the same period.
Target Prices
Analysts present a moderate upside potential on Coherent, Inc. and Fortive Corporation with balanced target ranges.
| Company | Target Low | Target High | Consensus |
|---|---|---|---|
| Coherent, Inc. | 170 | 235 | 209.29 |
| Fortive Corporation | 51 | 70 | 59.83 |
Coherent’s consensus target of 209.29 sits slightly below its current 227.68 price, suggesting limited upside. Fortive’s consensus target of 59.83 closely aligns with its 60.12 market price, indicating a fairly valued stock.

Don’t Let Luck Decide Your Entry Point
Optimize your entry points with our advanced ProRealTime indicators. You’ll get efficient buy signals with precise price targets for maximum performance. Start outperforming now!
How do institutions grade them?
The following tables summarize recent grades assigned by reputable financial institutions for both companies:
Coherent, Inc. Grades
This table shows the latest grades from established financial analysts for Coherent, Inc.
| Grading Company | Action | New Grade | Date |
|---|---|---|---|
| Barclays | maintain | Overweight | 2026-02-05 |
| Rosenblatt | maintain | Buy | 2026-02-05 |
| Morgan Stanley | maintain | Equal Weight | 2026-02-05 |
| Needham | maintain | Buy | 2026-02-05 |
| Stifel | maintain | Buy | 2026-02-05 |
| JP Morgan | maintain | Overweight | 2026-02-05 |
| Morgan Stanley | maintain | Equal Weight | 2026-01-30 |
| Citigroup | maintain | Buy | 2026-01-26 |
| Stifel | maintain | Buy | 2026-01-22 |
| Susquehanna | maintain | Positive | 2026-01-22 |
Fortive Corporation Grades
This table shows the latest grades from established financial analysts for Fortive Corporation.
| Grading Company | Action | New Grade | Date |
|---|---|---|---|
| Wells Fargo | maintain | Equal Weight | 2026-02-05 |
| RBC Capital | maintain | Sector Perform | 2026-02-05 |
| Citigroup | maintain | Neutral | 2026-02-05 |
| JP Morgan | downgrade | Underweight | 2026-01-16 |
| Mizuho | downgrade | Underperform | 2026-01-05 |
| Wells Fargo | maintain | Equal Weight | 2025-12-22 |
| Citigroup | maintain | Neutral | 2025-12-08 |
| Morgan Stanley | maintain | Equal Weight | 2025-11-05 |
| Baird | maintain | Outperform | 2025-11-04 |
| JP Morgan | maintain | Neutral | 2025-10-30 |
Which company has the best grades?
Coherent, Inc. consistently receives Buy and Overweight ratings, signaling stronger analyst confidence. Fortive Corporation’s grades skew Neutral or lower, with recent downgrades. This divergence may influence investor sentiment and portfolio positioning.
Risks specific to each company
The following categories identify critical pressure points and systemic threats facing Coherent, Inc. and Fortive Corporation in the 2026 market environment:
1. Market & Competition
Coherent, Inc.
- Faces intense competition in laser technology with high valuation pressure (P/E 279.75).
Fortive Corporation
- Operates in diversified industrial tech markets with more stable valuation (P/E 30.16).
2. Capital Structure & Debt
Coherent, Inc.
- Maintains moderate leverage (D/E 0.48) with neutral interest coverage (2.27x).
Fortive Corporation
- Similar leverage (D/E 0.5) but stronger interest coverage (7.0x) reducing refinancing risk.
3. Stock Volatility
Coherent, Inc.
- High beta (1.87) indicates significant stock price volatility and market sensitivity.
Fortive Corporation
- Lower beta (1.03) suggests more stable stock performance amid market fluctuations.
4. Regulatory & Legal
Coherent, Inc.
- Subject to technology export controls and IP litigation risks in laser sector.
Fortive Corporation
- Faces regulatory scrutiny in healthcare and industrial software compliance.
5. Supply Chain & Operations
Coherent, Inc.
- Dependent on specialized materials and components for laser manufacturing.
Fortive Corporation
- More diversified supply chain with broad industrial and healthcare product lines.
6. ESG & Climate Transition
Coherent, Inc.
- Moderate ESG exposure; laser tech has energy efficiency advantages but carbon footprint concerns.
Fortive Corporation
- Increasing focus on sustainability in healthcare and industrial safety products.
7. Geopolitical Exposure
Coherent, Inc.
- Exposure to US-China trade tensions impacting semiconductor and laser markets.
Fortive Corporation
- Global footprint with risk mitigated by diversified end markets and geographies.
Which company shows a better risk-adjusted profile?
Coherent’s biggest risk lies in its extreme valuation and high stock volatility, exposing investors to sharp price swings and potential market corrections. Fortive’s greatest risk is its weaker liquidity ratios (current ratio 0.71), which could strain short-term financial flexibility. Overall, Fortive offers a better risk-adjusted profile with more stable earnings, stronger interest coverage, and balanced market exposure. Its Altman Z-score (3.58) and Piotroski score (7) reflect solid financial health, while Coherent’s sky-high P/E and beta caution me despite a safe-zone Altman Z-score.
Final Verdict: Which stock to choose?
Coherent, Inc. (COHR) impresses with its rapid revenue and earnings growth, demonstrating a clear talent for scaling efficiently. Its strength lies in operational agility and a solid liquidity cushion. The main point of vigilance is its declining profitability and value destruction, which could challenge long-term sustainability. COHR suits portfolios seeking aggressive growth with a tolerance for volatility.
Fortive Corporation (FTV) offers a strategic moat through steady operating returns and a disciplined capital allocation approach. Its consistent cash flow and improving profitability provide a layer of safety absent in COHR. While revenue growth has slowed, FTV fits well in Growth at a Reasonable Price (GARP) portfolios focused on stability and moderate expansion.
If you prioritize rapid expansion and can weather swings in profitability, Coherent outshines with its operational momentum and liquidity strength. However, if you seek better stability and a more predictable income profile, Fortive offers superior cash flow resilience and a more favorable risk-return balance. Each stock appeals to distinct investor profiles navigating different market cycles.
Disclaimer: Investment carries a risk of loss of initial capital. The past performance is not a reliable indicator of future results. Be sure to understand risks before making an investment decision.
Go Further
I encourage you to read the complete analyses of Coherent, Inc. and Fortive Corporation to enhance your investment decisions: