Coherent, Inc. (COHR) and Fabrinet (FN) are two key players in the hardware, equipment, and parts industry, specializing in advanced optical and laser technologies. Both companies serve overlapping markets with innovative manufacturing and precision solutions, making them natural competitors in technology-driven sectors. In this article, I will analyze their strengths and strategies to help you decide which company presents the most promising investment opportunity in 2026.
Table of contents
Companies Overview
I will begin the comparison between Coherent, Inc. and Fabrinet by providing an overview of these two companies and their main differences.
Coherent, Inc. Overview
Coherent, Inc. specializes in lasers and laser-based technologies, serving commercial, industrial, and scientific research markets. It operates through two segments: OEM Laser Sources and Industrial Lasers & Systems. Coherent designs and manufactures precision optics, laser tools, and measurement products used in microelectronics, materials processing, and scientific research. Founded in 1966, it is headquartered in Santa Clara, California, and operates as a subsidiary of II-VI Incorporated.
Fabrinet Overview
Fabrinet offers optical packaging and precision manufacturing services globally, including North America, Asia-Pacific, and Europe. Its capabilities span process design, supply chain management, PCB assembly, and testing, supporting optical communication, industrial lasers, automotive components, and medical devices. Incorporated in 1999 and based in the Cayman Islands, Fabrinet serves original equipment manufacturers with advanced optical and electro-mechanical products.
Key similarities and differences
Both companies operate in the hardware, equipment, and parts industry within the technology sector, focusing on advanced optical and laser technologies. Coherent emphasizes laser systems and precision optics primarily for industrial and scientific applications, while Fabrinet provides broader manufacturing services, including optical packaging and electro-mechanical assembly. Coherent is a U.S.-based subsidiary, whereas Fabrinet is incorporated in the Cayman Islands with a global manufacturing footprint.
Income Statement Comparison
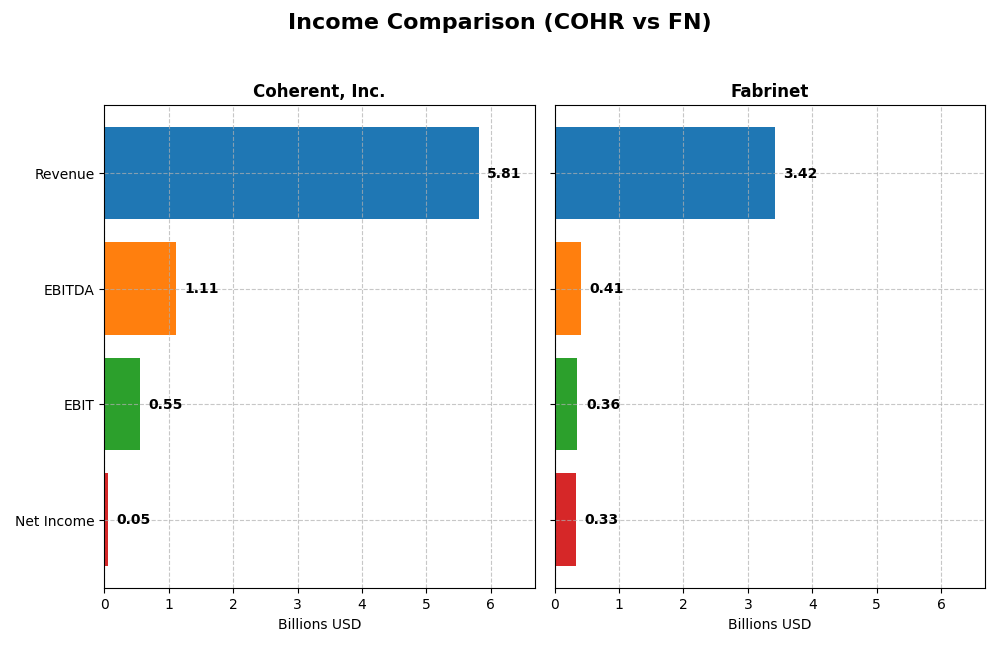
The table below compares the key income statement metrics for Coherent, Inc. and Fabrinet for the fiscal year 2025, highlighting their recent financial performance.
| Metric | Coherent, Inc. | Fabrinet |
|---|---|---|
| Market Cap | 29.5B | 17.5B |
| Revenue | 5.81B | 3.42B |
| EBITDA | 1.11B | 409M |
| EBIT | 552M | 355M |
| Net Income | 49M | 333M |
| EPS | -0.52 | 9.23 |
| Fiscal Year | 2025 | 2025 |
Income Statement Interpretations
Coherent, Inc.
Coherent, Inc. experienced a strong revenue growth of 87.07% over 2021-2025, with a notable 23.42% increase in the most recent year. Gross margin improved favorably to 35.41%, while net margin remained neutral at 0.85%. Despite impressive EBIT growth of 348.1% last year, net income declined overall, reflecting challenges in profitability despite operational gains.
Fabrinet
Fabrinet showed consistent revenue growth of 81.94% from 2021 to 2025, with an 18.6% rise in the latest year. Gross margin remained stable at 12.09%, while EBIT and net margins were favorable at 10.39% and 9.72%, respectively. Net income and EPS grew strongly over the period, though net margin slightly declined by 5.34% last year, indicating some margin pressure.
Which one has the stronger fundamentals?
Fabrinet demonstrates stronger fundamentals with higher and more stable net and EBIT margins, alongside favorable growth in net income and EPS. Coherent, Inc. benefits from higher gross margins and significant recent EBIT growth but faces unfavorable trends in net income and margin over the full period. Overall, Fabrinet’s income statement shows more consistent profitability and margin stability.
Financial Ratios Comparison
The table below presents a side-by-side comparison of key financial ratios for Coherent, Inc. and Fabrinet based on their most recent fiscal year data, highlighting their profitability, liquidity, leverage, and operational efficiency.
| Ratios | Coherent, Inc. (COHR, 2025) | Fabrinet (FN, 2025) |
|---|---|---|
| ROE | 0.61% | 16.78% |
| ROIC | 1.31% | 15.01% |
| P/E | 280 | 32.02 |
| P/B | 1.70 | 5.37 |
| Current Ratio | 2.19 | 3.00 |
| Quick Ratio | 1.39 | 2.28 |
| D/E | 0.48 | 0.003 |
| Debt-to-Assets | 26.1% | 0.19% |
| Interest Coverage | 2.26 | 0 |
| Asset Turnover | 0.39 | 1.21 |
| Fixed Asset Turnover | 3.09 | 8.85 |
| Payout Ratio | 23.2% | 0% |
| Dividend Yield | 0.08% | 0% |
Interpretation of the Ratios
Coherent, Inc.
Coherent, Inc. shows a mixed ratio profile with a majority of unfavorable metrics, including low net margin (0.85%) and poor returns on equity (0.61%) and invested capital (1.31%), reflecting operational challenges. Liquidity and leverage ratios appear favorable, with a current ratio of 2.19 and debt-to-assets at 26.11%. The company does not pay dividends, consistent with negative free cash flow to equity, suggesting reinvestment or restructuring focus.
Fabrinet
Fabrinet presents a generally favorable ratio set, including strong returns on equity (16.78%) and invested capital (15.01%), alongside solid liquidity with a current ratio of 3.0 and zero debt-to-equity, indicating conservative leverage. The price multiples are less attractive, with a PE of 32.02 and PB of 5.37. Fabrinet does not pay dividends, likely reflecting a reinvestment strategy amid stable cash flow generation.
Which one has the best ratios?
Fabrinet’s ratios are predominantly favorable, demonstrating stronger profitability, liquidity, and capital efficiency compared to Coherent, Inc., whose metrics reflect operational weaknesses and high valuation multiples. Fabrinet’s prudent leverage and cash flow profile contribute to a more robust financial standing, while Coherent’s unfavorable returns and high PE ratio suggest higher risks.
Strategic Positioning
This section compares the strategic positioning of Coherent, Inc. and Fabrinet, focusing on market position, key segments, and exposure to technological disruption:
Coherent, Inc.
- Operates in laser technologies with strong industry presence; faces competitive pressure in hardware parts.
- Key segments are Lasers and Materials, driving industrial, commercial, and scientific applications.
- Exposed to disruption through laser and precision optics innovation impacting microelectronics and materials.
Fabrinet
- Serves optical packaging and manufacturing with a broad geographic reach and steady competition.
- Focuses on Optical Communications primarily, with additional lasers, sensors, and other products.
- Faces disruption risk from advancements in optical components and high-speed data interconnects.
Coherent, Inc. vs Fabrinet Positioning
Coherent, Inc. has a diversified business model split between lasers and materials, offering exposure to multiple industrial segments. Fabrinet concentrates on optical communications and precision manufacturing, leveraging specialized technologies but with narrower focus. These approaches reflect different strategic risk and opportunity profiles.
Which has the best competitive advantage?
Fabrinet demonstrates a very favorable competitive advantage with growing ROIC above WACC, indicating efficient capital use and increasing profitability. Coherent, Inc. shows a very unfavorable moat, with declining ROIC and value destruction over recent years.
Stock Comparison
The stock price movements of Coherent, Inc. and Fabrinet over the past 12 months reveal significant bullish trends with notable acceleration phases, highlighting strong upward momentum and trading activity differences.
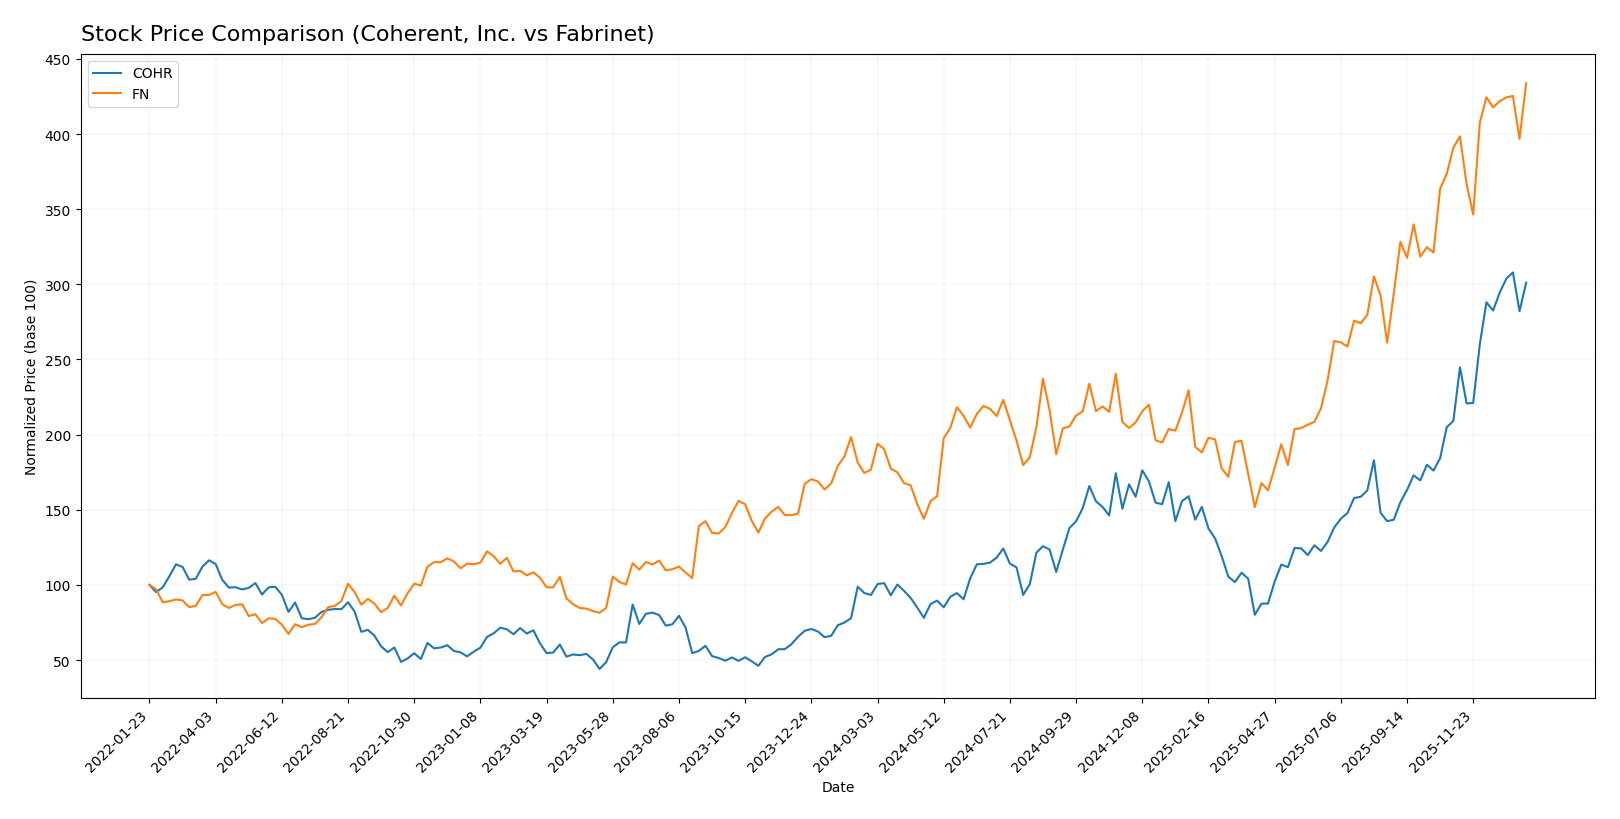
Trend Analysis
Coherent, Inc. (COHR) showed a robust bullish trend with a 222.85% price increase over the past year, accompanied by acceleration and moderate volatility (std deviation 34.26). The stock reached a high of 194.33 and a low of 49.26.
Fabrinet (FN) experienced a bullish trend with a 145.58% price increase over the same period, also accelerating but with higher volatility (std deviation 85.95). The stock’s price ranged from 162.32 to 489.0.
Comparing both, Coherent, Inc. delivered the highest market performance with a more pronounced price gain and sustained acceleration over the year.
Target Prices
The consensus target prices from recognized analysts indicate potential value ranges for Coherent, Inc. and Fabrinet.
| Company | Target High | Target Low | Consensus |
|---|---|---|---|
| Coherent, Inc. | 210 | 135 | 175 |
| Fabrinet | 600 | 537 | 568.5 |
Analysts expect Coherent, Inc. to trade slightly below its current price of 190.03 USD, suggesting moderate downside risk. Fabrinet’s consensus target of 568.5 USD is significantly above its current price of 489 USD, indicating strong upside potential.
Analyst Opinions Comparison
This section compares analysts’ ratings and grades for Coherent, Inc. and Fabrinet:
Rating Comparison
Coherent, Inc. Rating
- Rating: B-, classified as Very Favorable overall.
- Discounted Cash Flow Score: Moderate at 3, indicating balanced valuation.
- ROE Score: Moderate at 2, reflecting average efficiency in profit generation.
- ROA Score: Moderate at 3, indicating average asset utilization.
- Debt To Equity Score: Moderate at 2, suggesting moderate financial risk.
- Overall Score: Moderate at 2, summarizing moderate financial standing.
Fabrinet Rating
- Rating: A-, classified as Very Favorable overall.
- Discounted Cash Flow Score: Moderate at 3, indicating balanced valuation.
- ROE Score: Favorable at 4, showing strong profit generation efficiency.
- ROA Score: Very Favorable at 5, demonstrating excellent asset utilization.
- Debt To Equity Score: Very Favorable at 5, indicating low financial risk.
- Overall Score: Favorable at 4, summarizing strong financial standing.
Which one is the best rated?
Based strictly on the provided data, Fabrinet holds stronger ratings and scores across most financial metrics, including ROE, ROA, debt to equity, and overall score, compared to Coherent, which shows mostly moderate evaluations.
Scores Comparison
Here is a comparison of the Altman Z-Score and Piotroski Score for Coherent, Inc. and Fabrinet:
Coherent, Inc. Scores
- Altman Z-Score: 3.70, indicating financial safety in safe zone
- Piotroski Score: 7, reflecting strong financial health
Fabrinet Scores
- Altman Z-Score: 13.79, indicating strong financial safety in safe zone
- Piotroski Score: 4, reflecting average financial health
Which company has the best scores?
Fabrinet shows a much higher Altman Z-Score, indicating stronger bankruptcy safety, while Coherent has a notably higher Piotroski Score, suggesting stronger overall financial health. This highlights differing strengths in their financial profiles.
Grades Comparison
Here is the comparison of recent grades and ratings for Coherent, Inc. and Fabrinet:
Coherent, Inc. Grades
The following table summarizes recent grades from reputable grading companies for Coherent, Inc.:
| Grading Company | Action | New Grade | Date |
|---|---|---|---|
| Morgan Stanley | Maintain | Equal Weight | 2025-12-17 |
| JP Morgan | Maintain | Overweight | 2025-12-05 |
| Barclays | Maintain | Overweight | 2025-11-07 |
| Morgan Stanley | Maintain | Equal Weight | 2025-11-06 |
| Stifel | Maintain | Buy | 2025-11-06 |
| Rosenblatt | Maintain | Buy | 2025-11-06 |
| Needham | Maintain | Buy | 2025-11-06 |
| Susquehanna | Maintain | Positive | 2025-10-22 |
| Barclays | Maintain | Overweight | 2025-10-20 |
| Rosenblatt | Maintain | Buy | 2025-10-14 |
Coherent, Inc. maintains mostly buy and overweight ratings, with several firms keeping their previous positive views stable.
Fabrinet Grades
The following table summarizes recent grades from reputable grading companies for Fabrinet:
| Grading Company | Action | New Grade | Date |
|---|---|---|---|
| Barclays | Maintain | Equal Weight | 2025-11-05 |
| Needham | Maintain | Buy | 2025-11-04 |
| JP Morgan | Maintain | Overweight | 2025-11-04 |
| Rosenblatt | Maintain | Buy | 2025-11-04 |
| JP Morgan | Maintain | Overweight | 2025-10-16 |
| Rosenblatt | Maintain | Buy | 2025-10-02 |
| JP Morgan | Upgrade | Overweight | 2025-08-25 |
| B. Riley Securities | Maintain | Neutral | 2025-08-19 |
| Needham | Maintain | Buy | 2025-08-19 |
| Rosenblatt | Maintain | Buy | 2025-08-19 |
Fabrinet’s grades are generally positive, with multiple buy and overweight ratings and one recent upgrade noted by JP Morgan.
Which company has the best grades?
Both Coherent, Inc. and Fabrinet have received predominantly buy and overweight grades from respected firms, with no sell ratings reported. Coherent, Inc. shows a slightly stronger consensus with 23 buy ratings versus Fabrinet’s 17, suggesting a marginally more favorable analyst sentiment that could influence investor confidence and potential portfolio positioning.
Strengths and Weaknesses
Below is a comparison table highlighting the key strengths and weaknesses of Coherent, Inc. (COHR) and Fabrinet (FN) based on their recent financial and operational data.
| Criterion | Coherent, Inc. (COHR) | Fabrinet (FN) |
|---|---|---|
| Diversification | Moderate: Focus on Lasers (1.43B) and Materials (954M) segments | Moderate: Primarily Optical Communications (2.62B) with growing Lasers & Sensors segment |
| Profitability | Weak: ROIC 1.31%, Net Margin 0.85%, ROE 0.61% (all unfavorable) | Strong: ROIC 15.01%, Net Margin 9.72%, ROE 16.78% (mostly favorable) |
| Innovation | Declining profitability indicates challenges in maintaining innovation | Growing ROIC trend suggests effective innovation and competitive advantage |
| Global presence | Established but value destroying with declining returns on capital | Durable competitive advantage with increasing profitability and strong global operations |
| Market Share | Facing pressure as indicated by unfavorable asset turnover and high P/E (279.75) | Healthy asset turnover (1.21) and reasonable growth prospects despite high P/B (5.37) |
Key takeaways: Fabrinet demonstrates a robust financial profile with growing profitability and a durable competitive moat, making it a more favorable investment candidate. Coherent, Inc. struggles with declining returns and weak profitability, signaling caution for investors.
Risk Analysis
Below is a comparison table highlighting key risk factors for Coherent, Inc. (COHR) and Fabrinet (FN) based on the latest 2025 financial data and market conditions.
| Metric | Coherent, Inc. (COHR) | Fabrinet (FN) |
|---|---|---|
| Market Risk | High beta 1.835 indicates higher volatility sensitivity | Moderate beta 1.035 indicates moderate volatility |
| Debt Level | Moderate leverage, Debt-to-Equity 0.48, Debt-to-Assets 26.11% | Very low leverage, Debt-to-Equity 0.0, Debt-to-Assets 0.19% |
| Regulatory Risk | Moderate, operates globally with US base; subsidiary of II-VI | Moderate, Cayman Islands-based with global operations |
| Operational Risk | Exposure to complex laser tech manufacturing, supply chain dependence | Exposure to precision optical manufacturing and multi-region supply chains |
| Environmental Risk | Moderate, industrial lasers and manufacturing impact | Moderate, optical and electronic manufacturing impact |
| Geopolitical Risk | Moderate, US-China trade tensions may affect supply chain | Moderate to high, Cayman Islands base and Asia-Pacific exposure |
Coherent faces higher market volatility and moderate debt risks, while Fabrinet benefits from low leverage but has notable geopolitical exposure. Market risk and geopolitical tensions are the most impactful risks for investors to monitor closely in 2026.
Which Stock to Choose?
Coherent, Inc. (COHR) shows a favorable income statement with strong recent revenue and profit growth but has unfavorable profitability ratios and a declining return on invested capital indicating value destruction. Its debt levels are moderate, and its rating is very favorable despite mixed financial ratios.
Fabrinet (FN) demonstrates consistent favorable income growth and profitability metrics, a very favorable moat with increasing ROIC above WACC, and low debt levels. Its financial ratios and ratings are generally favorable, although valuation ratios such as P/E and P/B appear elevated.
For investors prioritizing stable profitability and value creation, Fabrinet may appear more favorable given its durable competitive advantage and solid financial ratios. Conversely, those focusing on recent income momentum but accepting higher risk might find Coherent’s profile worth considering. Ultimately, the choice could depend on the investor’s risk tolerance and investment strategy.
Disclaimer: Investment carries a risk of loss of initial capital. The past performance is not a reliable indicator of future results. Be sure to understand risks before making an investment decision.
Go Further
I encourage you to read the complete analyses of Coherent, Inc. and Fabrinet to enhance your investment decisions: