Home > Comparison > Technology > GLW vs COHR
The strategic rivalry between Corning Incorporated and Coherent, Inc. shapes the Technology sector’s hardware landscape. Corning operates as a diversified materials and display technology leader with a broad industrial footprint. In contrast, Coherent specializes in high-precision laser systems targeting niche industrial and scientific applications. This analysis compares their capital allocation and growth trajectories to identify which company offers superior risk-adjusted returns for a diversified portfolio in 2026.
Table of contents
Companies Overview
Corning Incorporated and Coherent, Inc. are pivotal players in the technology hardware sector, each commanding strong market positions.
Corning Incorporated: Innovation in Specialty Glass and Optical Solutions
Corning is a global leader in display technologies and optical communications, generating revenue through glass substrates for LCDs and OLEDs, plus optical fibers and components. In 2026, its strategic focus remains on expanding specialty materials and environmental technologies to support mobile electronics and telecommunications infrastructure.
Coherent, Inc.: Precision in Laser Systems and Optics
Coherent dominates the laser-based technology market, earning primarily from OEM laser sources and industrial laser systems for microelectronics and scientific research. Its 2026 strategy centers on advancing laser tools and precision optics to serve industrial and government applications worldwide.
Strategic Collision: Similarities & Divergences
Both firms specialize in high-tech hardware components but diverge in focus—Corning emphasizes glass and optical fibers, while Coherent specializes in laser systems. Their competition concentrates on supplying advanced materials and precision instruments to industrial and tech sectors. Investors face distinct profiles: Corning offers diversified product lines with steady dividends; Coherent bets on innovation-driven growth with higher volatility.
Income Statement Comparison
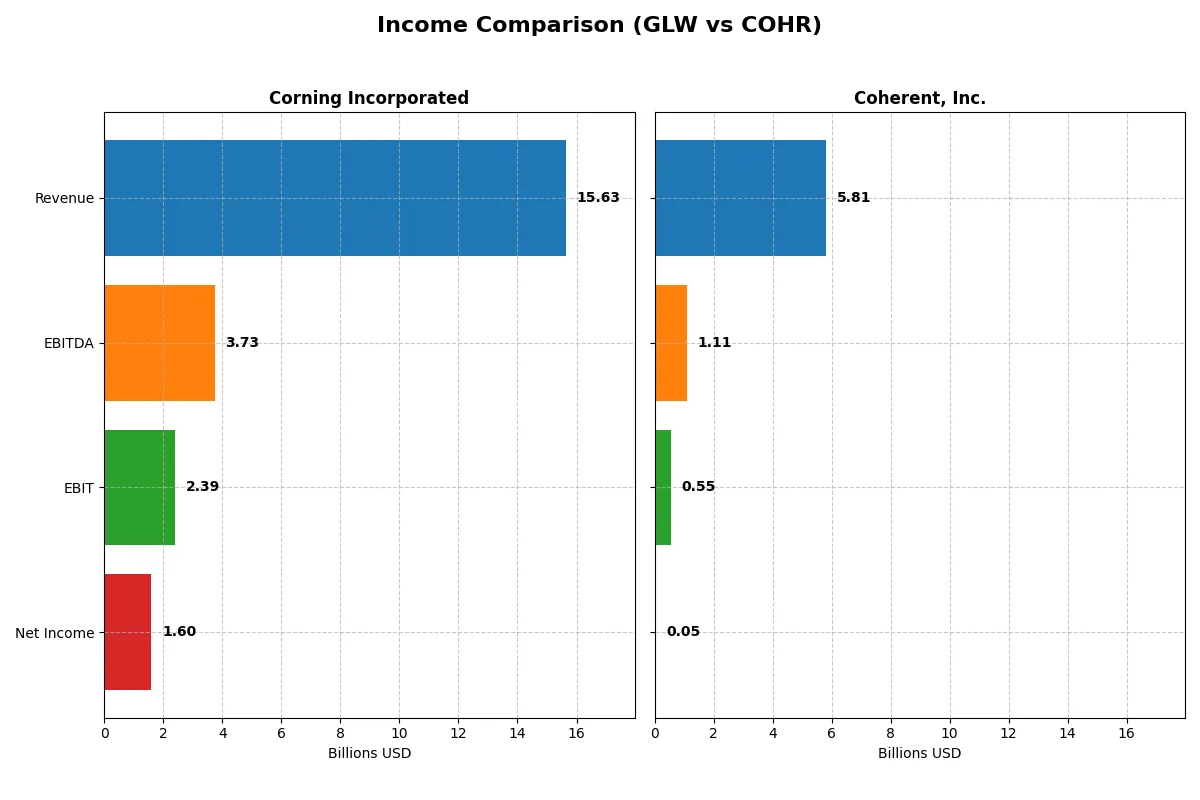
The following data dissects the core profitability and scalability of both corporate engines to reveal who dominates the bottom line:
| Metric | Corning Incorporated (GLW) | Coherent, Inc. (COHR) |
|---|---|---|
| Revenue | 15.6B | 5.8B |
| Cost of Revenue | 10.1B | 3.8B |
| Operating Expenses | 3.2B | 1.5B |
| Gross Profit | 5.5B | 2.1B |
| EBITDA | 3.7B | 1.1B |
| EBIT | 2.4B | 552M |
| Interest Expense | 336M | 243M |
| Net Income | 1.6B | -81M |
| EPS | 1.86 | -0.52 |
| Fiscal Year | 2025 | 2025 |
Income Statement Analysis: The Bottom-Line Duel
This income statement comparison reveals how efficiently each company converts sales into profit and manages operational costs.
Corning Incorporated Analysis
Corning’s revenue increased steadily from 12.6B in 2023 to 15.6B in 2025, showing robust top-line growth. Net income surged from 581M in 2023 to 1.6B in 2025, reflecting sharp margin improvement. Its gross margin remains strong at 35.3%, and net margin climbed to 10.2%, signaling improved operational efficiency and solid momentum in the latest year.
Coherent, Inc. Analysis
Coherent grew revenue from 3.3B in 2022 to 5.8B in mid-2025, demonstrating impressive sales expansion. However, net income remains volatile, swinging from a 259M loss in 2023 to a modest 49M profit in 2025. Gross margin holds steady near 35.4%, but net margin stays thin at 0.85%, indicating ongoing challenges in converting revenue growth into sustainable profits.
Margin Strength vs. Revenue Expansion
Corning leads with superior net margins and consistent profit growth, while Coherent shows rapid revenue gains but struggles with profitability. Corning’s efficient cost management and margin leverage make it the clear winner in fundamental profitability. For investors, a company demonstrating reliable margin strength often offers a more attractive risk-return profile than one relying solely on top-line momentum.
Financial Ratios Comparison
These vital ratios act as a diagnostic tool to expose the underlying fiscal health, valuation premiums, and capital efficiency of the companies compared below:
| Ratios | Corning Incorporated (GLW) | Coherent, Inc. (COHR) |
|---|---|---|
| ROE | 13.5% | 0.6% |
| ROIC | 7.4% | 1.3% |
| P/E | 47.2 | 279.8 |
| P/B | 6.38 | 1.70 |
| Current Ratio | 1.59 | 2.19 |
| Quick Ratio | 1.04 | 1.39 |
| D/E | 0.71 | 0.48 |
| Debt-to-Assets | 27.2% | 26.1% |
| Interest Coverage | 6.78 | 2.26 |
| Asset Turnover | 0.50 | 0.39 |
| Fixed Asset Turnover | 1.05 | 3.09 |
| Payout ratio | 62.6% | 23.2% |
| Dividend yield | 1.33% | 0.08% |
| Fiscal Year | 2025 | 2025 (6 months ended) |
Efficiency & Valuation Duel: The Vital Signs
Financial ratios act as the company’s DNA, uncovering hidden risks and operational strengths that shape investment decisions with clarity.
Corning Incorporated
Corning posts a solid 13.5% ROE and a strong 10.2% net margin, indicating operational efficiency. However, its P/E of 47.2 signals a stretched valuation. The company balances this by returning value via a 1.33% dividend yield, complemented by steady R&D investment, reflecting a blend of income and growth focus.
Coherent, Inc.
Coherent’s profitability lags with a 0.6% ROE and slim 0.85% net margin, showing operational challenges. Its valuation is highly stretched, with a P/E near 280. Dividend yield is negligible at 0.08%, as the firm prioritizes reinvestment into R&D to drive future expansion amid current profitability weakness.
Premium Valuation vs. Operational Safety
Corning offers a better balance of profitability and valuation discipline despite a high P/E. Coherent’s lofty valuation and weak returns increase risk. Investors seeking operational safety might prefer Corning’s profile, while those betting on turnaround growth might consider Coherent’s riskier, innovation-driven path.
Which one offers the Superior Shareholder Reward?
I compare Corning Incorporated (GLW) and Coherent, Inc. (COHR) by their shareholder distribution approaches. GLW delivers a 1.33% dividend yield with a 63% payout ratio, supported by steady free cash flow covering dividends and capex at 1.18x. Its buyback program is consistent, enhancing shareholder value sustainably. COHR yields a negligible 0.08%, with a low payout ratio of 23%, reflecting cautious dividends amid volatile profits. COHR favors reinvestment in growth, but its free cash flow coverage is weaker at 1.40x, and buybacks are limited. Historically, GLW’s balanced mix of dividends and buybacks aligns better with industry norms and offers a more reliable total return in 2026. I judge GLW superior for sustainable, rewarding shareholder returns.
Comparative Score Analysis: The Strategic Profile
The radar chart reveals the fundamental DNA and trade-offs of Corning Incorporated and Coherent, Inc.:
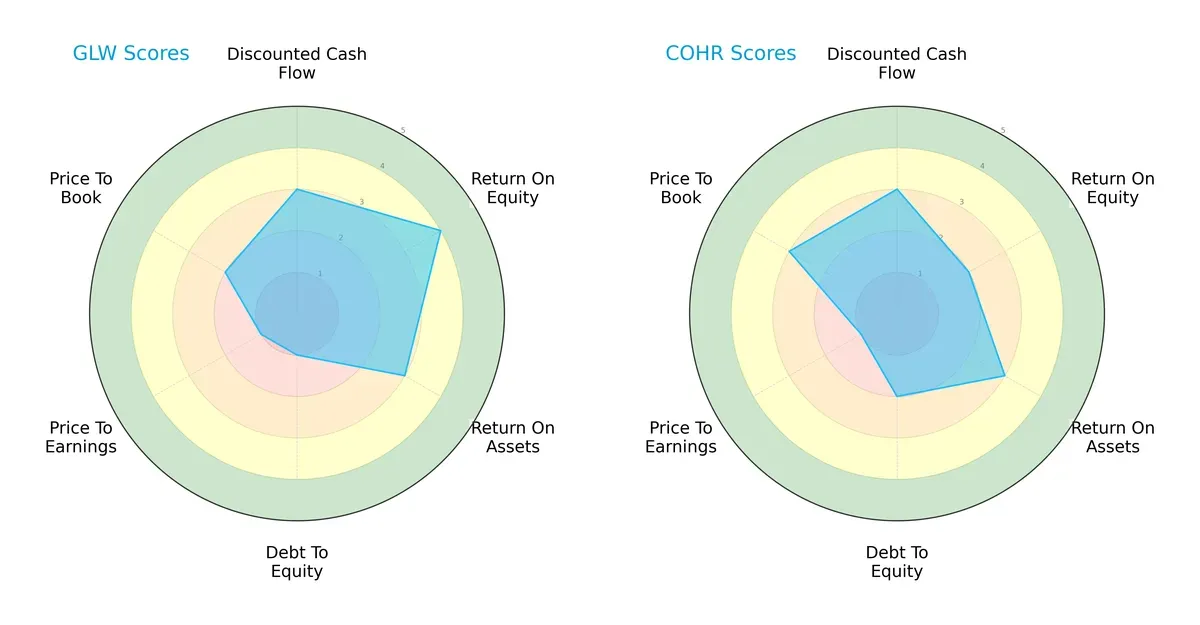
Corning exhibits a stronger return on equity (4 vs. 2) and a slightly better discounted cash flow score (3 vs. 3 equal). However, it carries higher financial risk with a very unfavorable debt-to-equity score (1 vs. 2). Coherent shows a more balanced valuation profile, with a higher price-to-book score (3 vs. 2). Corning leans on operational efficiency, while Coherent maintains steadier leverage and valuation metrics.
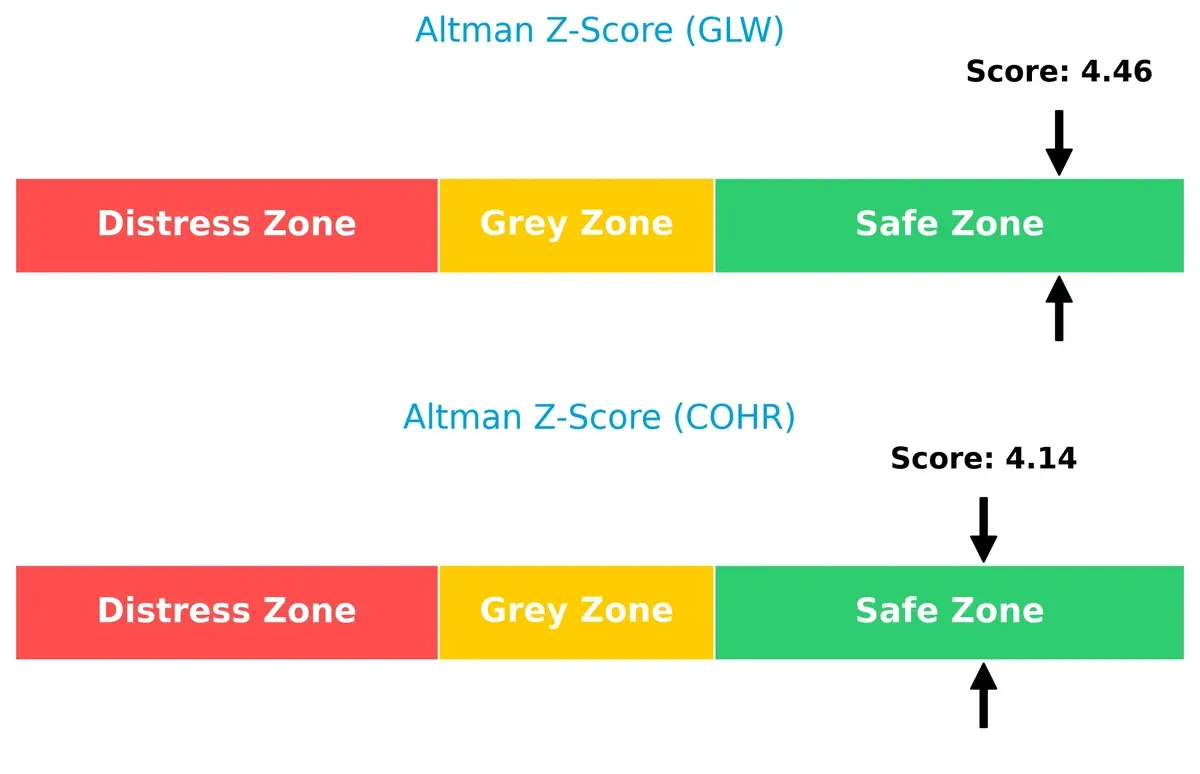
Bankruptcy Risk: Solvency Showdown
Corning’s Altman Z-Score edges out Coherent’s (4.46 vs. 4.14), indicating a marginally stronger solvency position in this late-cycle environment:
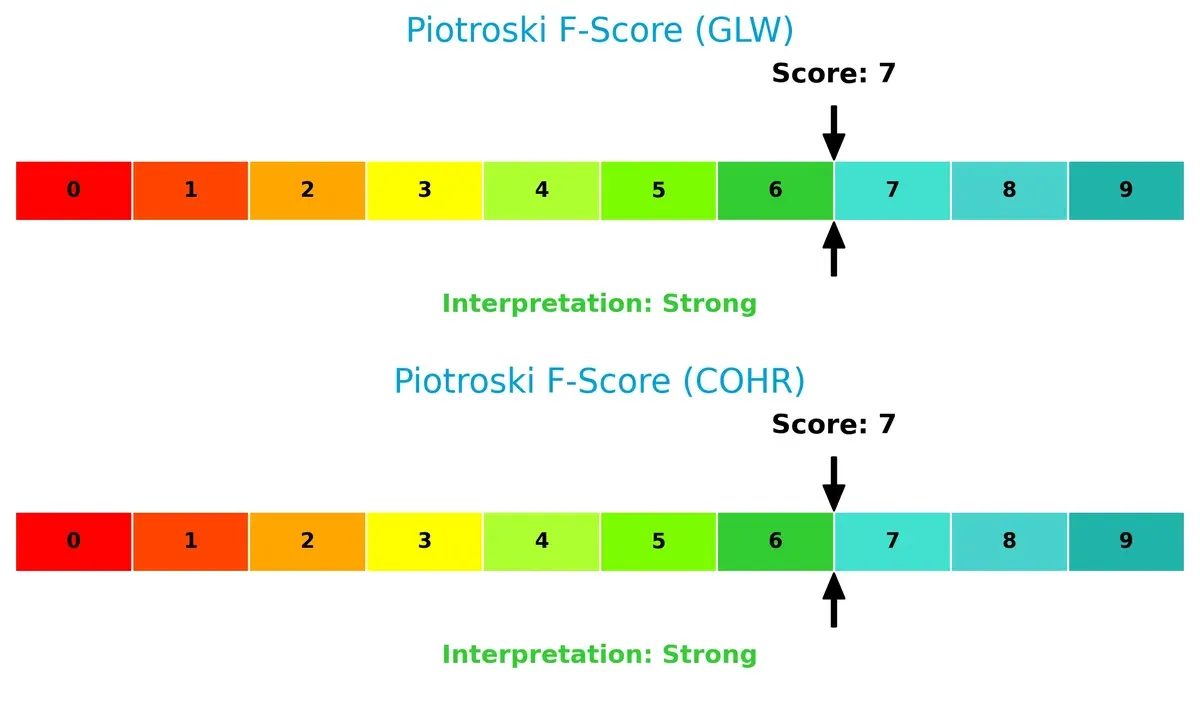
Financial Health: Quality of Operations
Both companies score 7 on the Piotroski F-Score, signaling strong financial health and operational quality. Neither shows immediate red flags compared to the other:
How are the two companies positioned?
This section dissects Corning and Coherent’s operational DNA by comparing revenue distribution and internal strengths and weaknesses. The goal is to confront their economic moats and identify which business model delivers the most durable competitive edge today.
Revenue Segmentation: The Strategic Mix
The following visual comparison dissects how Corning Incorporated and Coherent, Inc. diversify their income streams and where their primary sector bets lie:
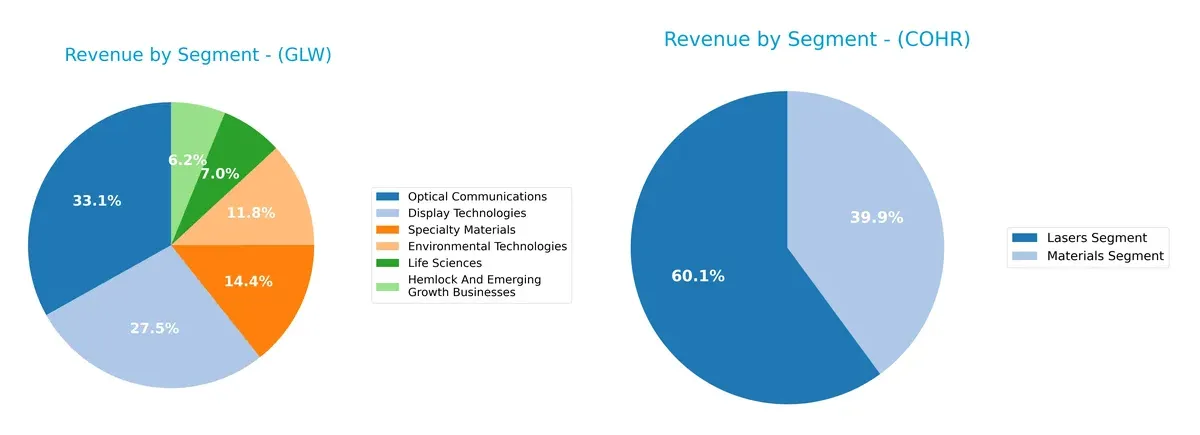
Corning exhibits a broad revenue base, with Optical Communications ($4.66B) and Display Technologies ($3.87B) anchoring its portfolio, alongside Specialty Materials and Environmental Technologies. This mix signals strong ecosystem lock-in across high-tech industries. Coherent, by contrast, pivots mainly on two segments: Lasers ($1.43B) and Materials ($954M). Its narrower focus suggests higher concentration risk but potential for specialized market dominance.
Strengths and Weaknesses Comparison
This table compares the Strengths and Weaknesses of Corning Incorporated and Coherent, Inc.:
Corning Incorporated Strengths
- Diversified revenue streams across multiple segments in optical, display, and specialty materials
- Favorable net margin of 10.21% indicates solid profitability
- Strong current and quick ratios show good short-term liquidity
- Low debt-to-assets ratio of 27.23% reflects prudent leverage management
- Significant global presence with large Asia Pacific and North America sales
Coherent, Inc. Strengths
- Favorable current and quick ratios indicate strong liquidity
- Low debt-to-equity ratio of 0.48 implies conservative leverage
- High fixed asset turnover at 3.09 suggests efficient use of fixed assets
- Moderate global diversification with sizable North America and China sales
Corning Incorporated Weaknesses
- High price-to-earnings (PE) ratio at 47.18 suggests overvaluation risk
- Price-to-book (PB) ratio of 6.38 may indicate expensive stock price
- Neutral return on invested capital (ROIC) below weighted average cost of capital (WACC)
- Moderate return on equity (ROE) at 13.52% not outstanding
- Asset turnover ratio of 0.5 signals moderate operational efficiency
Coherent, Inc. Weaknesses
- Unfavorable net margin at 0.85% reflects weak profitability
- Very low return on equity (0.61%) and ROIC (1.31%) raise efficiency concerns
- High weighted average cost of capital (11.65%) pressures returns
- Extremely high PE ratio at 279.75 signals possible overvaluation
- Low dividend yield of 0.08% offers minimal income to shareholders
- Unfavorable asset turnover at 0.39 indicates inefficiency
Corning’s strength lies in diversified revenue and solid liquidity, though valuation multiples appear stretched. Coherent shows liquidity and asset efficiency but struggles with profitability and valuation concerns. These contrasts highlight distinct strategic challenges and financial profiles.
The Moat Duel: Analyzing Competitive Defensibility
A structural moat is the sole shield protecting long-term profits from relentless competitive erosion. Let’s dissect the competitive moats of two industry players:
Corning Incorporated: Intangible Assets and Scale Economies
Corning leverages decades of proprietary glass technology and vast scale to sustain high gross margins near 35%. Its steady margin stability signals a durable moat. Expansion in specialty materials and life sciences may deepen this edge in 2026.
Coherent, Inc.: Technological Innovation and OEM Customer Lock-in
Coherent’s moat centers on laser technology innovation combined with OEM customer relationships. While its margins trail Corning’s, Coherent’s rapid revenue growth reflects expanding market penetration. However, softer EBIT margins and declining ROIC trend raise concerns for moat durability.
Verdict: Proprietary Scale vs. Innovation Vulnerability
Corning’s intangible assets and scale create a wider, more stable moat than Coherent’s innovation-dependent model. Corning’s rising ROIC contrasts with Coherent’s steep decline, indicating Corning is better positioned to defend market share.
Which stock offers better returns?
The past year showed strong bullish trends for both stocks, with notable price acceleration and rising buyer dominance shaping trading dynamics.
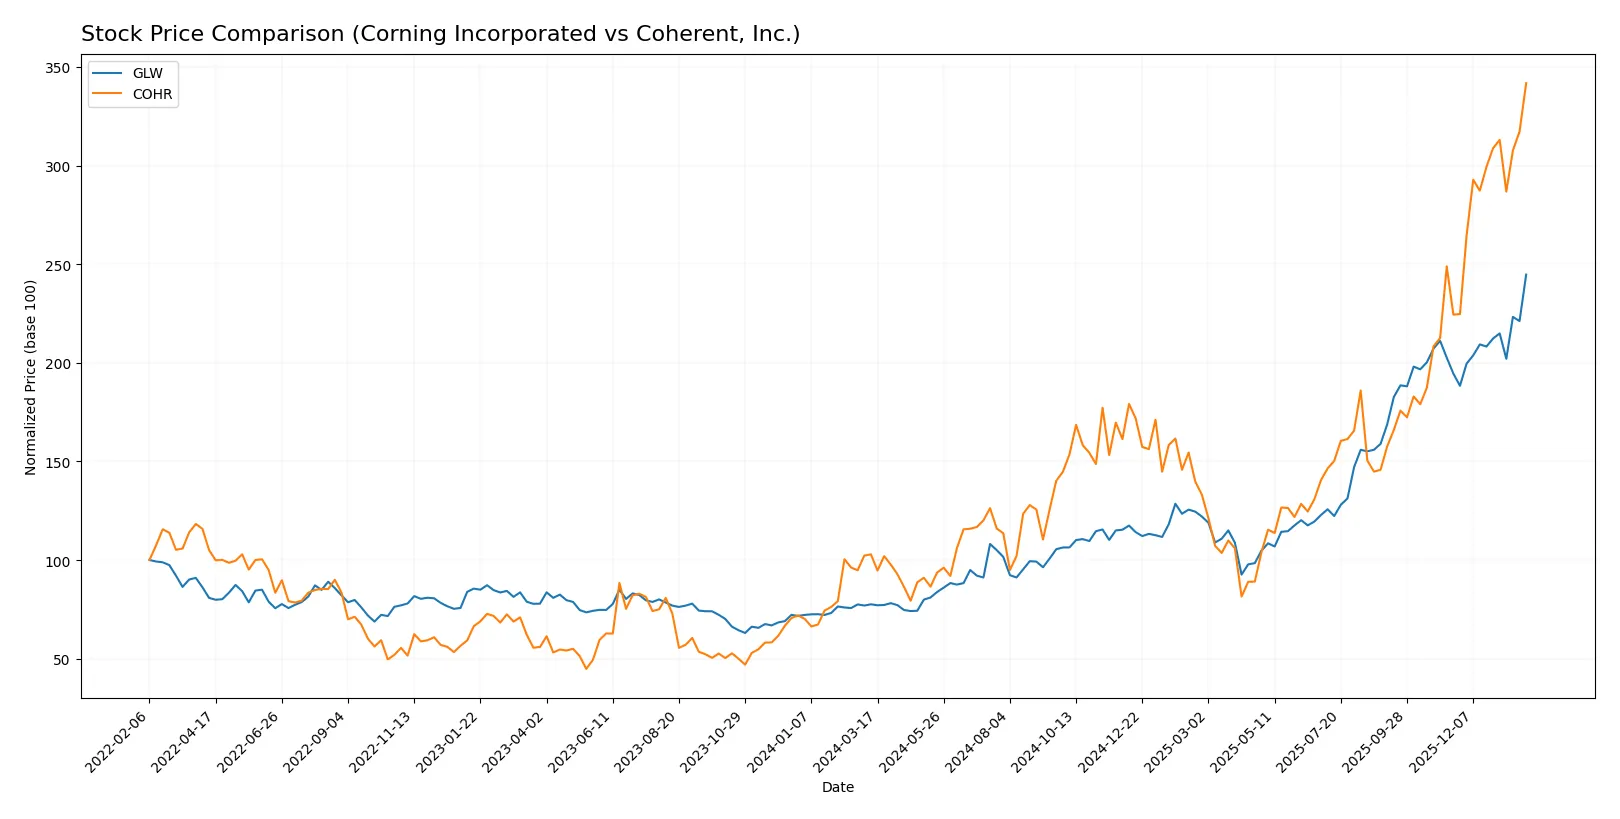
Trend Comparison
Corning Incorporated’s stock rose 215.65% over 12 months, reflecting a bullish trend with accelerating momentum and moderate volatility (18.43 std deviation). The price ranged from 31.27 to 103.25.
Coherent, Inc. gained 232.26% during the same period, also bullish with acceleration but higher volatility (37.42 std deviation). Its price fluctuated between 49.26 and 212.18.
Coherent’s trend outperformed Corning’s by a wider margin, delivering stronger returns and higher recent price acceleration.
Target Prices
Analysts show a bullish outlook with solid upside potential for both Corning Incorporated and Coherent, Inc.
| Company | Target Low | Target High | Consensus |
|---|---|---|---|
| Corning Incorporated | 100 | 130 | 116.63 |
| Coherent, Inc. | 190 | 235 | 210 |
Corning’s consensus target is about 13% above its current 103.25 price, signaling moderate upside. Coherent’s 210 target aligns closely with its 212.18 price, suggesting a balanced risk-reward profile.

Don’t Let Luck Decide Your Entry Point
Optimize your entry points with our advanced ProRealTime indicators. You’ll get efficient buy signals with precise price targets for maximum performance. Start outperforming now!
How do institutions grade them?
Both Corning Incorporated and Coherent, Inc. have received recent grades from well-known financial institutions:
Corning Incorporated Grades
The table below lists recent analyst grades for Corning Incorporated from major firms.
| Grading Company | Action | New Grade | Date |
|---|---|---|---|
| Morgan Stanley | Maintain | Equal Weight | 2026-01-29 |
| Mizuho | Maintain | Outperform | 2026-01-29 |
| Citigroup | Maintain | Buy | 2026-01-29 |
| Susquehanna | Maintain | Positive | 2026-01-29 |
| JP Morgan | Maintain | Overweight | 2026-01-28 |
| Citigroup | Maintain | Buy | 2026-01-12 |
| Morgan Stanley | Maintain | Equal Weight | 2025-12-17 |
| UBS | Maintain | Buy | 2025-11-21 |
| Citigroup | Maintain | Buy | 2025-10-29 |
| JP Morgan | Maintain | Overweight | 2025-10-29 |
Coherent, Inc. Grades
Recent analyst grades for Coherent, Inc. from established firms are shown below.
| Grading Company | Action | New Grade | Date |
|---|---|---|---|
| Morgan Stanley | Maintain | Equal Weight | 2026-01-30 |
| Citigroup | Maintain | Buy | 2026-01-26 |
| Susquehanna | Maintain | Positive | 2026-01-22 |
| Stifel | Maintain | Buy | 2026-01-22 |
| Barclays | Maintain | Overweight | 2026-01-15 |
| Morgan Stanley | Maintain | Equal Weight | 2025-12-17 |
| JP Morgan | Maintain | Overweight | 2025-12-05 |
| Barclays | Maintain | Overweight | 2025-11-07 |
| Needham | Maintain | Buy | 2025-11-06 |
| Morgan Stanley | Maintain | Equal Weight | 2025-11-06 |
Which company has the best grades?
Coherent, Inc. and Corning Incorporated both receive mostly positive ratings, including multiple Buy and Overweight grades. Coherent shows a slightly higher frequency of Overweight ratings, which may signal stronger institutional conviction. Investors might view Coherent as having marginally more favorable analyst sentiment.
Risks specific to each company
The categories below identify the critical pressure points and systemic threats facing both firms in the 2026 market environment:
1. Market & Competition
Corning Incorporated
- Faces intense competition in display and optical technologies with pressure on margins despite solid market share.
Coherent, Inc.
- Operates in highly specialized laser markets but struggles with lower profitability and high valuation multiples.
2. Capital Structure & Debt
Corning Incorporated
- Maintains moderate debt levels with favorable interest coverage, signaling manageable leverage risk.
Coherent, Inc.
- Lower debt-to-equity ratio and favorable current ratios, but interest coverage is weaker, indicating tighter debt servicing capacity.
3. Stock Volatility
Corning Incorporated
- Beta of 1.125 suggests moderate volatility, in line with technology sector norms.
Coherent, Inc.
- Higher beta at 1.835 points to elevated stock volatility and greater market sensitivity.
4. Regulatory & Legal
Corning Incorporated
- Exposure to environmental regulations in emissions control segment could increase compliance costs.
Coherent, Inc.
- Faces regulatory scrutiny over laser safety standards and export controls in global markets.
5. Supply Chain & Operations
Corning Incorporated
- Diverse supply chain with some vulnerability in specialty materials sourcing but generally stable.
Coherent, Inc.
- Supply chain risks heightened by reliance on precision components and potential geopolitical trade disruptions.
6. ESG & Climate Transition
Corning Incorporated
- Positioned to benefit from environmental tech demand but must manage emissions control product lifecycle impacts.
Coherent, Inc.
- ESG risks include energy-intensive manufacturing processes and pressure to improve sustainability metrics.
7. Geopolitical Exposure
Corning Incorporated
- Global footprint exposes it to US-China trade tensions affecting supply and sales.
Coherent, Inc.
- Significant international sales and operations increase exposure to geopolitical volatility and trade barriers.
Which company shows a better risk-adjusted profile?
Corning’s strongest risk is market competition but its conservative leverage and stable liquidity offer resilience. Coherent’s greatest risk lies in stock volatility combined with stretched valuation and weaker profitability. Corning’s moderate beta and favorable debt metrics suggest a superior risk-adjusted profile. Recent data highlights Coherent’s very high P/E ratio and lower interest coverage as red flags. Thus, Corning presents a more balanced risk-reward outlook in 2026’s challenging tech environment.
Final Verdict: Which stock to choose?
Corning Incorporated’s superpower lies in its steady operational efficiency and improving profitability amid a challenging sector. Its ability to grow returns, despite currently shedding value against its cost of capital, signals resilience. A point of vigilance is its stretched valuation, which demands cautious entry. It suits an aggressive growth portfolio willing to navigate cyclical risks.
Coherent, Inc. benefits from a strategic moat rooted in specialized technology and recurring revenue streams, providing a cushion against volatility. It presents a safer liquidity profile and lower leverage than Corning but struggles with declining profitability and value destruction. This stock fits a GARP (Growth at a Reasonable Price) portfolio seeking potential turnaround opportunities with moderate risk tolerance.
If you prioritize operational consistency and improving profitability, Corning Incorporated outshines due to its robust income growth and market traction. However, if you seek exposure to niche innovation with better liquidity safety, Coherent offers a more stable balance sheet despite its profitability challenges. Each choice reflects distinct investor risk appetites amid sector headwinds.
Disclaimer: Investment carries a risk of loss of initial capital. The past performance is not a reliable indicator of future results. Be sure to understand risks before making an investment decision.
Go Further
I encourage you to read the complete analyses of Corning Incorporated and Coherent, Inc. to enhance your investment decisions: