Home > Comparison > Technology > CTSH vs ZS
The strategic rivalry between Cognizant Technology Solutions Corporation and Zscaler, Inc. shapes the evolving landscape of the technology sector. Cognizant operates as a capital-intensive information technology services giant, delivering broad consulting and outsourcing solutions. In contrast, Zscaler excels as a high-margin software infrastructure provider specializing in cloud security. This analysis pits traditional scale against innovative specialization to identify which trajectory offers superior risk-adjusted returns for a diversified portfolio.
Table of contents
Companies Overview
Cognizant and Zscaler each hold critical roles in the evolving technology services and software infrastructure markets.
Cognizant Technology Solutions Corporation: Global IT Services Powerhouse
Cognizant dominates as a professional services company delivering consulting, technology, and outsourcing services across North America, Europe, and beyond. Its revenue stems from diverse sectors like financial services, healthcare, and communications. In 2026, Cognizant focuses strategically on integrating AI, robotic process automation, and digital health to enhance operational efficiencies and customer experience.
Zscaler, Inc.: Cloud Security Innovator
Zscaler leads in cloud security, offering solutions that secure user access to SaaS applications and private cloud environments. Its core revenue comes from platform modules like Zscaler Internet Access and Private Access. In 2026, Zscaler prioritizes expanding workload segmentation and digital experience analytics to mitigate risks and improve enterprise security posture.
Strategic Collision: Similarities & Divergences
Cognizant emphasizes a broad outsourcing and consulting model while Zscaler delivers a focused cloud-native security platform. Their battleground centers on digital transformation—Cognizant on operational workflows, Zscaler on securing cloud architectures. Investors face distinct profiles: Cognizant’s scale and sector breadth versus Zscaler’s innovation in a niche but rapidly growing cybersecurity market.
Income Statement Comparison
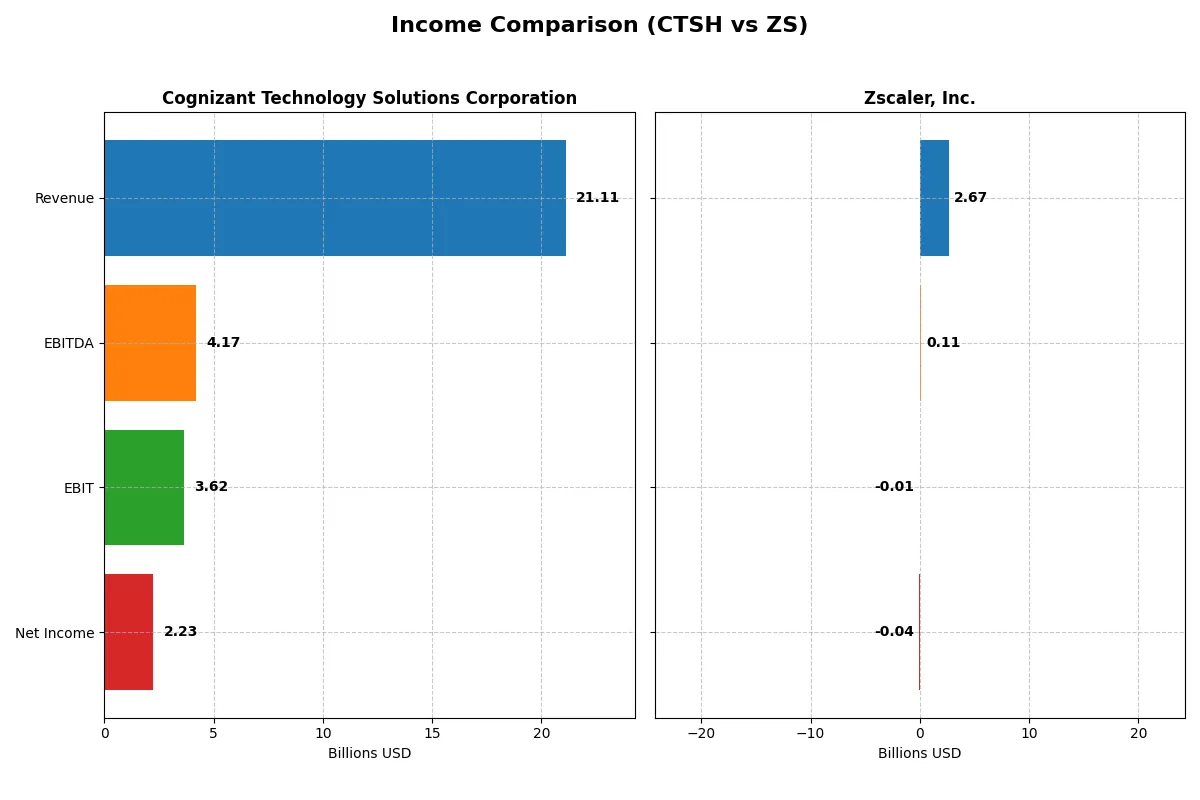
This data dissects the core profitability and scalability of both corporate engines to reveal who dominates the bottom line:
| Metric | Cognizant Technology Solutions Corporation (CTSH) | Zscaler, Inc. (ZS) |
|---|---|---|
| Revenue | 21.1B | 2.67B |
| Cost of Revenue | 14.0B | 618M |
| Operating Expenses | 3.59B | 2.18B |
| Gross Profit | 7.12B | 2.05B |
| EBITDA | 4.17B | 112M |
| EBIT | 3.62B | -8.77M |
| Interest Expense | 37M | 9.52M |
| Net Income | 2.23B | -41.5M |
| EPS | 4.56 | -0.27 |
| Fiscal Year | 2025 | 2025 |
Income Statement Analysis: The Bottom-Line Duel
This income statement comparison reveals the true efficiency and operational momentum driving each company’s financial engine.
Cognizant Technology Solutions Corporation Analysis
Cognizant’s revenue grew steadily from $18.5B in 2021 to $21.1B in 2025, showing a solid 14% overall increase. Its net income rose modestly to $2.23B in 2025, despite a slight net margin contraction to 10.56%. Gross margin remains stable near 34%, indicating consistent cost control, while EBIT margin improved to 17.16%, reflecting enhanced operational efficiency.
Zscaler, Inc. Analysis
Zscaler posted rapid revenue growth from $673M in 2021 to $2.67B in 2025, a striking 297% surge driven by aggressive expansion. However, it still reports a net loss of $41M in 2025, though this marks a significant margin improvement with net margin at -1.55%. Its gross margin is strong at nearly 77%, but negative EBIT margin signals ongoing investment pressures impacting profitability.
Steady Profits vs. High Growth Momentum
Cognizant delivers consistent profitability with healthy margins and stable net income, while Zscaler excels in revenue and margin growth but remains unprofitable. Cognizant’s profile suits investors prioritizing margin stability. Zscaler appeals to those chasing high growth potential despite current losses.
Financial Ratios Comparison
These vital ratios act as a diagnostic tool to expose the underlying fiscal health, valuation premiums, and capital efficiency of the companies compared below:
| Ratios | Cognizant Technology Solutions Corporation (CTSH) | Zscaler, Inc. (ZS) |
|---|---|---|
| ROE | 14.85% | -2.31% |
| ROIC | 12.31% | -3.18% |
| P/E | 17.90 | -1063.01 |
| P/B | 2.66 | 24.51 |
| Current Ratio | 2.34 | 2.01 |
| Quick Ratio | 2.34 | 2.01 |
| D/E | 0.10 | 1.00 |
| Debt-to-Assets | 7.61% | 28.0% |
| Interest Coverage | 95.38 | -13.49 |
| Asset Turnover | 1.02 | 0.42 |
| Fixed Asset Turnover | 14.02 | 4.22 |
| Payout ratio | 27.35% | 0% |
| Dividend yield | 1.53% | 0% |
| Fiscal Year | 2025 | 2025 |
Efficiency & Valuation Duel: The Vital Signs
Ratios act as a company’s DNA, exposing hidden risks and operational strengths that surface beyond headline numbers.
Cognizant Technology Solutions Corporation
Cognizant demonstrates solid profitability with a 14.85% ROE and a favorable 10.56% net margin, indicating efficient operations. Its valuation metrics, including a P/E of 17.9 and P/B of 2.66, suggest a fairly priced stock. Shareholders benefit from a 1.53% dividend yield, reflecting steady returns alongside reinvestment in growth initiatives.
Zscaler, Inc.
Zscaler’s core profitability metrics reveal losses, with a negative ROE of -2.31% and a -1.55% net margin, signaling operational challenges. The stock trades at a stretched P/B of 24.51 despite a negative P/E, hinting at high investor expectations. It pays no dividend, focusing heavily on R&D as a growth strategy, which weighs on near-term returns.
Balanced Efficiency vs. Growth Risk
Cognizant offers a better balance of operational efficiency and valuation, with positive returns and shareholder dividends. Zscaler’s elevated valuation and negative profitability introduce higher risk. Investors seeking stability may prefer Cognizant, while those targeting aggressive growth might consider Zscaler’s high-risk profile.
Which one offers the Superior Shareholder Reward?
I find Cognizant Technology Solutions Corporation (CTSH) delivers superior shareholder reward in 2026. CTSH pays a steady dividend yield near 1.53% with a sustainable payout ratio around 27%, supported by strong free cash flow coverage (~90%). It also runs consistent buyback programs, enhancing total returns. Conversely, Zscaler, Inc. (ZS) pays no dividends and shows negative net margins, relying on reinvestment in growth and R&D. ZS’s buyback activity is minimal, and its high valuation multiples (P/B ~24.5, P/FCF ~61) reflect speculative growth bets. Historically, I’ve observed that mature firms like CTSH with balanced dividends and buybacks offer more reliable long-term value than high-growth tech peers still scaling losses. Hence, CTSH presents a more attractive and sustainable total return profile for investors in 2026.
Comparative Score Analysis: The Strategic Profile
The radar chart reveals the fundamental DNA and trade-offs of Cognizant Technology Solutions Corporation and Zscaler, Inc., illustrating their financial strengths and weaknesses:

Cognizant shows a balanced profile with strong ROE (4) and ROA (5) scores, reflecting efficient asset use and profitability. Zscaler relies heavily on discounted cash flow strength (4) but struggles with profitability (ROE 1, ROA 1) and financial stability (Debt/Equity 1). Cognizant also maintains moderate valuation scores (P/E 3, P/B 3), while Zscaler’s valuation metrics signal overvaluation risks. Overall, Cognizant presents a more stable and diversified financial profile.
Bankruptcy Risk: Solvency Showdown
The Altman Z-Score gap signals Cognizant’s superior solvency, with a score of 6.85 versus Zscaler’s 4.07, both safely above distress thresholds but indicating different risk buffers:
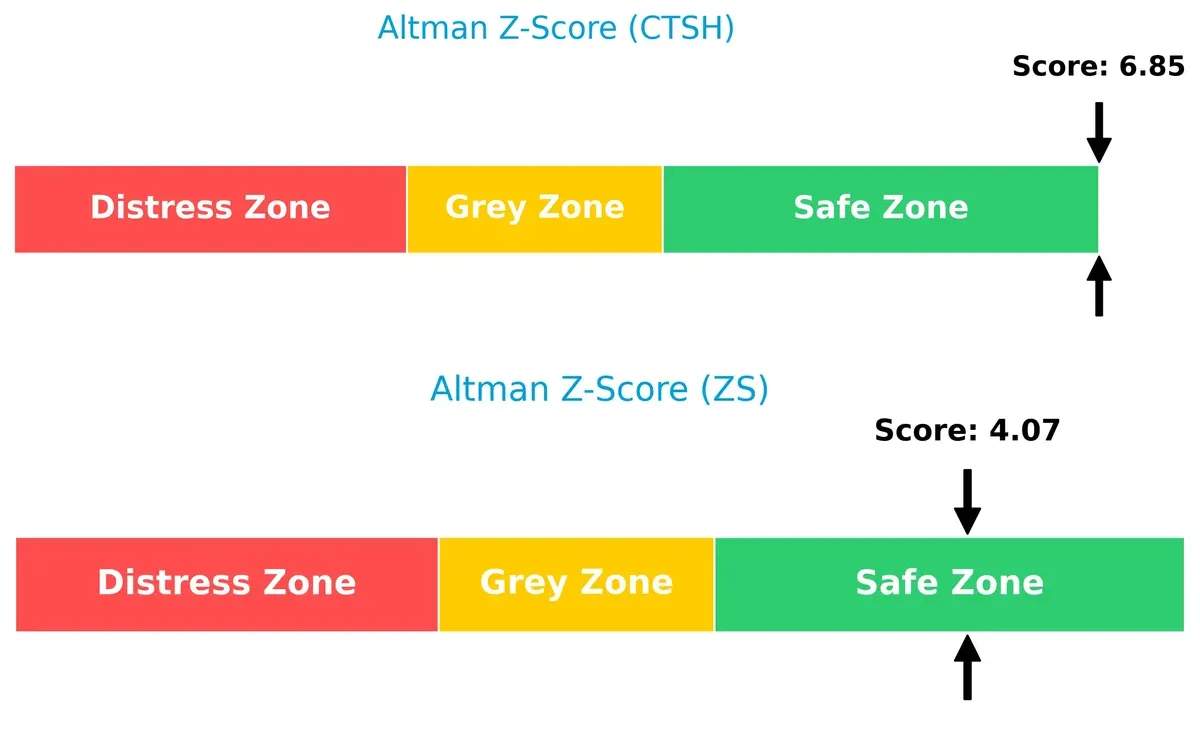
Cognizant’s higher Z-Score suggests robust financial health and a lower bankruptcy risk, reinforcing its resilience through economic cycles. Zscaler, while also in the safe zone, operates with thinner margins of solvency, warranting caution.
Financial Health: Quality of Operations
Cognizant’s Piotroski F-Score of 7 versus Zscaler’s 3 highlights a stark contrast in financial quality and operational strength:
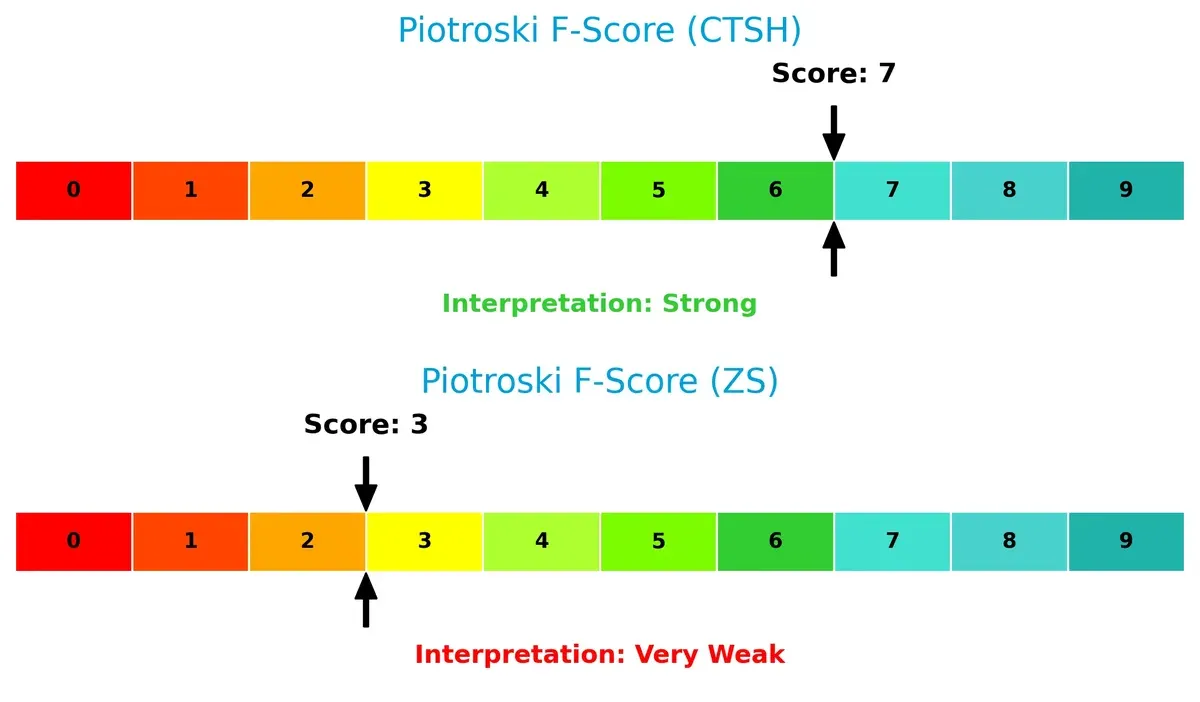
A score of 7 signals Cognizant’s strong internal metrics and effective capital allocation. Zscaler’s low score raises red flags, reflecting weak profitability and efficiency metrics that could impair long-term value creation. Investors should weigh these operational risks carefully.
How are the two companies positioned?
This section dissects the operational DNA of Cognizant and Zscaler by comparing their revenue distribution and internal dynamics. The goal is to confront their economic moats to identify which model offers the most resilient, sustainable advantage today.
Revenue Segmentation: The Strategic Mix
The following visual comparison dissects how Cognizant Technology Solutions Corporation and Zscaler, Inc. diversify their income streams and where their primary sector bets lie:
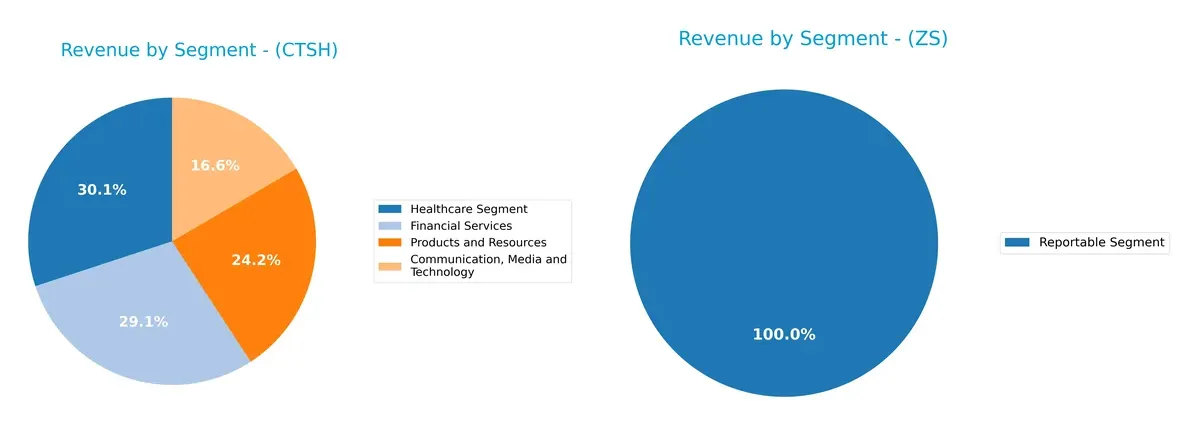
Cognizant shows a well-balanced revenue mix with Healthcare at $5.9B, Financial Services at $5.7B, Products and Resources at $4.8B, and Communication, Media and Technology at $3.3B. In contrast, Zscaler relies solely on one reportable segment generating $2.7B. Cognizant’s diversification reduces concentration risk and showcases cross-sector strength. Zscaler pivots on a single growth engine, exposing it to higher sector-specific volatility.
Strengths and Weaknesses Comparison
This table compares the Strengths and Weaknesses of Cognizant Technology Solutions Corporation and Zscaler, Inc.:
CTSH Strengths
- Diversified revenue across multiple sectors
- Positive net margin of 10.56%
- Strong liquidity with current ratio 2.34
- Low debt-to-assets of 7.61%
- High asset turnover of 1.02
- Global presence with significant North America and Europe sales
ZS Strengths
- Favorable current and quick ratios near 2.0
- Low debt-to-assets at 27.98% (favorable)
- Reasonable fixed asset turnover of 4.22
- Presence in US, EMEA, Asia Pacific
- P/E ratio shows market expectation of growth
CTSH Weaknesses
- Neutral ROE at 14.85%, suggesting moderate profitability efficiency
- Neutral WACC at 8.05%, indicating average capital cost
- Neutral valuation multiples (PE 17.9, PB 2.66)
- Dividend yield only 1.53%, limiting income appeal
ZS Weaknesses
- Negative net margin (-1.55%) and ROE (-2.31%) indicate losses
- Negative ROIC (-3.18%) below WACC (8.27%) signals value destruction
- High PB ratio of 24.51 suggests overvaluation risk
- Interest coverage negative (-0.92), raising solvency concerns
- Asset turnover low at 0.42, reflecting weak operational efficiency
- No dividend yield
Cognizant shows robust financial health with diversified revenue and strong liquidity, reinforcing its stable market position. Zscaler’s financials reflect early-stage growth challenges, with losses and high valuation highlighting operational risks and market expectations for future profitability.
The Moat Duel: Analyzing Competitive Defensibility
A structural moat is the only thing protecting long-term profits from competition’s relentless erosion of market share and pricing power:
Cognizant Technology Solutions Corporation: Operational Excellence through Scale and Integration
Cognizant’s moat centers on cost advantage and scale in IT services, reflected in steady 17% EBIT margins and 4.3% ROIC premium over WACC. Its broad industry exposure stabilizes revenue, but declining ROIC signals margin pressure. Expansion in AI and automation could deepen its moat if efficiency gains offset wage inflation in 2026.
Zscaler, Inc.: Rapidly Expanding Cloud Security Network Effects
Zscaler leverages network effects in cloud security with a premium SaaS model, delivering 77% gross margins but negative current ROIC versus WACC. However, its 76% ROIC growth trend and 297% revenue growth over five years show accelerating profitability. Continued innovation in workload segmentation and digital experience can expand its moat amid fierce cybersecurity demand.
Cost Leadership vs. Network Effect: The Moat Showdown
Cognizant’s mature cost advantage offers stable value creation but faces margin erosion risk. Zscaler’s network effect is less profitable today but grows rapidly with strong scalability. I see Cognizant holding a wider moat now, while Zscaler’s deeper moat potential depends on sustaining growth and improving capital returns. Cognizant is better positioned to defend market share in the near term.
Which stock offers better returns?
Over the past 12 months, Cognizant Technology Solutions Corporation and Zscaler, Inc. exhibited contrasting price movements and trading dynamics, with Cognizant showing steady gains and Zscaler facing sharp declines.
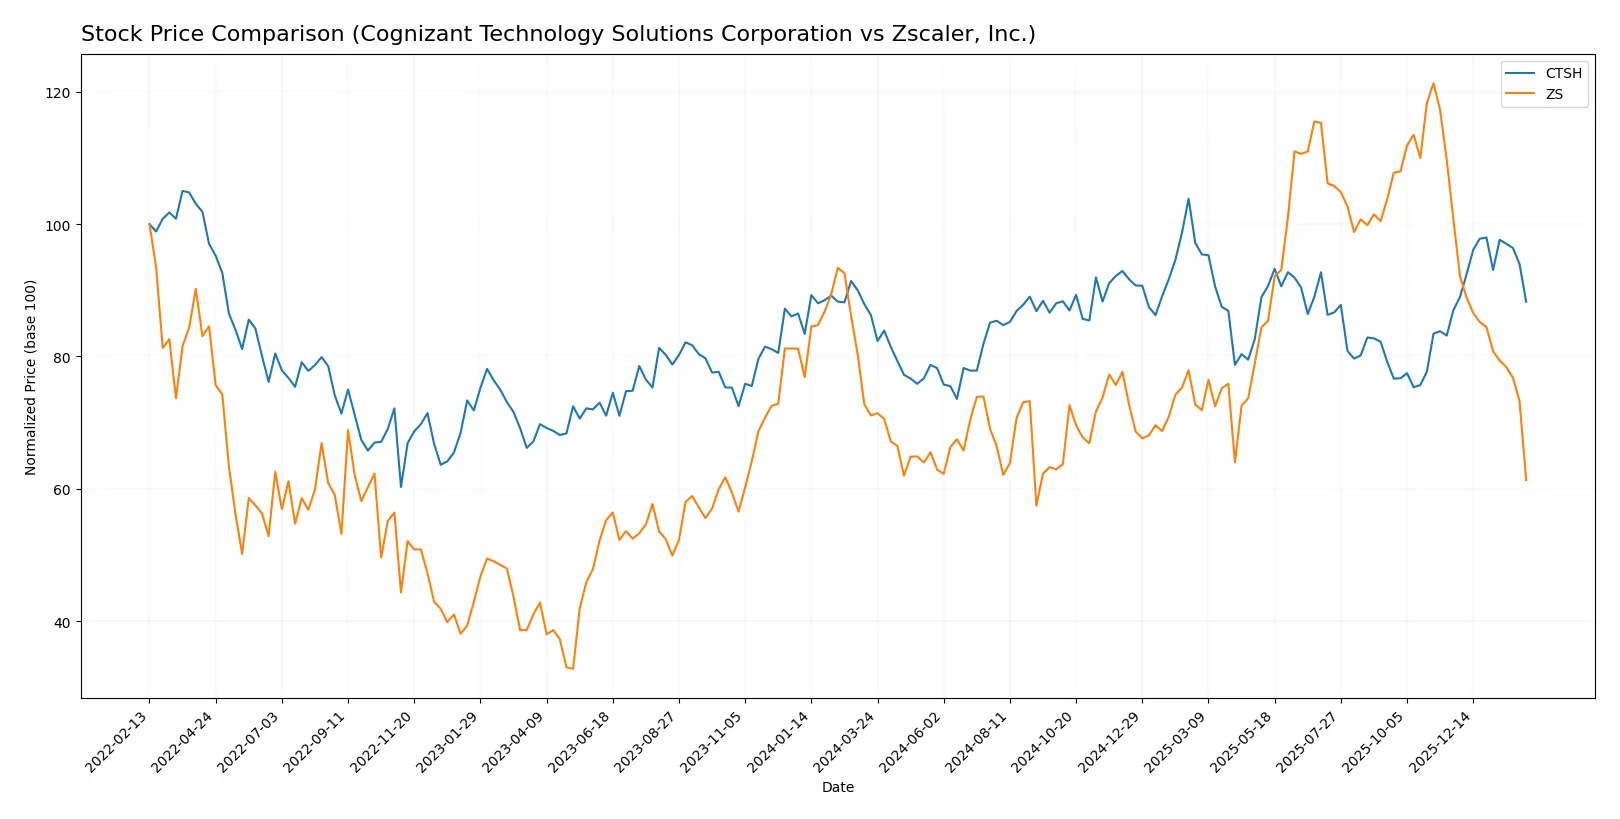
Trend Comparison
Cognizant Technology Solutions Corporation’s stock rose 2.32% over the past year, marking a bullish trend with accelerating momentum and moderate volatility. The price fluctuated between 64.26 and 90.7.
Zscaler, Inc.’s stock dropped 13.76% during the same period, reflecting a bearish trend with decelerating momentum and very high volatility. Its price ranged from 156.78 to 331.14.
Comparatively, Cognizant delivered positive market performance, while Zscaler experienced significant losses, making Cognizant the stronger performer in this timeframe.
Target Prices
Analysts present a clear bullish consensus on both Cognizant Technology Solutions Corporation and Zscaler, Inc.
| Company | Target Low | Target High | Consensus |
|---|---|---|---|
| Cognizant Technology Solutions Corporation | 82 | 107 | 93.2 |
| Zscaler, Inc. | 260 | 360 | 311.41 |
The target consensus for Cognizant at $93.2 suggests an upside from the current $77.08 price. Zscaler’s consensus near $311 vastly exceeds its current $167.33, reflecting high growth expectations.

Don’t Let Luck Decide Your Entry Point
Optimize your entry points with our advanced ProRealTime indicators. You’ll get efficient buy signals with precise price targets for maximum performance. Start outperforming now!
How do institutions grade them?
Cognizant Technology Solutions Corporation Grades
The table below summarizes recent grades from major financial institutions for Cognizant:
| Grading Company | Action | New Grade | Date |
|---|---|---|---|
| TD Cowen | Maintain | Hold | 2026-02-05 |
| Morgan Stanley | Maintain | Equal Weight | 2026-02-05 |
| RBC Capital | Maintain | Sector Perform | 2026-02-05 |
| Guggenheim | Maintain | Buy | 2026-01-28 |
| Citigroup | Maintain | Neutral | 2026-01-22 |
| Wells Fargo | Maintain | Overweight | 2026-01-14 |
| TD Cowen | Maintain | Hold | 2026-01-09 |
| UBS | Maintain | Neutral | 2025-12-08 |
| William Blair | Upgrade | Outperform | 2025-11-21 |
| UBS | Maintain | Neutral | 2025-10-30 |
Zscaler, Inc. Grades
The following grades reflect institutional views on Zscaler over recent months:
| Grading Company | Action | New Grade | Date |
|---|---|---|---|
| Citigroup | Maintain | Buy | 2026-01-13 |
| Keybanc | Maintain | Overweight | 2026-01-12 |
| Piper Sandler | Maintain | Neutral | 2026-01-05 |
| RBC Capital | Maintain | Outperform | 2026-01-05 |
| Mizuho | Upgrade | Outperform | 2025-12-16 |
| Citigroup | Maintain | Buy | 2025-12-01 |
| Bernstein | Downgrade | Market Perform | 2025-12-01 |
| Baird | Maintain | Outperform | 2025-11-26 |
| Needham | Maintain | Buy | 2025-11-26 |
| BTIG | Maintain | Buy | 2025-11-26 |
Which company has the best grades?
Zscaler consistently receives higher ratings, including multiple Buy and Outperform grades. Cognizant’s grades cluster around Hold to Neutral. Better grades for Zscaler may indicate stronger institutional confidence, impacting investor sentiment and valuation.
Risks specific to each company
The following categories identify the critical pressure points and systemic threats facing both firms in the 2026 market environment:
1. Market & Competition
Cognizant Technology Solutions Corporation
- Faces intense competition in IT services with pressure on margins from digital transformation demands.
Zscaler, Inc.
- Operates in a fast-evolving cloud security market with aggressive innovation and pricing pressures.
2. Capital Structure & Debt
Cognizant Technology Solutions Corporation
- Maintains low debt levels (D/E 0.1), strong interest coverage, signaling financial stability.
Zscaler, Inc.
- Higher debt ratio (D/E 1.0) with negative interest coverage, indicating elevated financial risk.
3. Stock Volatility
Cognizant Technology Solutions Corporation
- Beta near 0.96 suggests moderate sensitivity to market swings, more stable stock behavior.
Zscaler, Inc.
- Beta above 1.02 indicates higher volatility and susceptibility to market fluctuations.
4. Regulatory & Legal
Cognizant Technology Solutions Corporation
- Subject to data privacy regulations and outsourcing compliance globally, moderately manageable risks.
Zscaler, Inc.
- Faces stringent cybersecurity regulations and compliance challenges, with potential legal liabilities.
5. Supply Chain & Operations
Cognizant Technology Solutions Corporation
- Large global workforce and extensive operations expose it to operational disruptions and labor regulation risks.
Zscaler, Inc.
- Smaller scale but dependent on cloud infrastructure providers, vulnerable to service interruptions.
6. ESG & Climate Transition
Cognizant Technology Solutions Corporation
- Progressing on sustainability initiatives but exposed to rising ESG expectations in tech sector.
Zscaler, Inc.
- ESG efforts less mature; risks from regulatory and customer pressure to demonstrate climate responsibility.
7. Geopolitical Exposure
Cognizant Technology Solutions Corporation
- Global presence subjects it to geopolitical tensions, trade policies, and cross-border data laws.
Zscaler, Inc.
- Primarily US-based with growing international exposure, sensitive to geopolitical cybersecurity concerns.
Which company shows a better risk-adjusted profile?
Cognizant’s strongest risk factor lies in competitive pressure amid digital transformation, but it boasts a robust balance sheet and stable cash flow. Zscaler faces its greatest risk from financial instability driven by high debt and negative profitability. Cognizant clearly offers a superior risk-adjusted profile, supported by its favorable Altman Z-score (6.85) and strong Piotroski score (7), contrasting with Zscaler’s weaker Piotroski (3) and financial red flags. The stark contrast in interest coverage ratios—97.9 for Cognizant versus negative for Zscaler—underscores my concern about Zscaler’s solvency risk.
Final Verdict: Which stock to choose?
Cognizant Technology Solutions Corporation (CTSH) shines with its operational efficiency and consistent value creation. Its strong cash flow and solid balance sheet form its superpower. A point of vigilance is the slight decline in profitability trends. CTSH suits portfolios targeting steady, moderate growth with resilience.
Zscaler, Inc. (ZS) boasts a strategic moat in cloud security, underpinned by rapid revenue growth and expanding market presence. However, it carries elevated risk with negative profitability and weaker financial health compared to CTSH. ZS fits well with growth-oriented investors who tolerate volatility for disruptive innovation exposure.
If you prioritize reliable cash generation and defensive positioning, CTSH outshines with its stable fundamentals and favorable financial health. However, if you seek high-growth potential and can withstand earnings volatility, ZS offers superior growth prospects despite its current value destruction. Each appeals to distinct investor profiles navigating evolving tech landscapes.
Disclaimer: Investment carries a risk of loss of initial capital. The past performance is not a reliable indicator of future results. Be sure to understand risks before making an investment decision.
Go Further
I encourage you to read the complete analyses of Cognizant Technology Solutions Corporation and Zscaler, Inc. to enhance your investment decisions: