Home > Comparison > Technology > CTSH vs WIT
The strategic rivalry between Cognizant Technology Solutions Corporation and Wipro Limited defines the current trajectory of the global IT services sector. Cognizant operates as a diversified, consulting-driven technology services leader with a strong presence in North America and Europe. Wipro, by contrast, integrates IT services with product offerings and government contracts, primarily within India. This head-to-head pits scale and innovation against regional specialization. This analysis aims to identify which profile delivers superior risk-adjusted returns for a diversified portfolio.
Table of contents
Companies Overview
Cognizant and Wipro stand as major players in the global information technology services landscape, each commanding significant market presence.
Cognizant Technology Solutions Corporation: Global IT Services Powerhouse
Cognizant dominates the professional services space with a diverse revenue mix spanning financial services, healthcare, and technology sectors. It earns primarily through consulting, technology, and outsourcing services. The company’s 2026 strategy centers on advancing digital transformation via AI, robotic automation, and customer experience enhancement to sustain its competitive edge.
Wipro Limited: India-Based IT and Consulting Specialist
Wipro thrives as a comprehensive IT and consulting firm, generating revenue from IT services, products, and government enterprise segments. Its core strength lies in delivering digital strategy, cloud, and infrastructure services across multiple industries, prominently within India. In 2026, Wipro focuses strategically on expanding cloud services and enhancing government IT contracts to solidify domestic dominance.
Strategic Collision: Similarities & Divergences
Both companies operate in IT services with broad industry reach, yet Cognizant pursues a global, multi-sector approach, while Wipro concentrates heavily on India’s market and government contracts. They compete primarily in digital transformation and cloud infrastructure services. Their investment profiles diverge sharply: Cognizant offers a larger market cap and global scale, whereas Wipro presents a more regional, growth-focused opportunity.
Income Statement Comparison
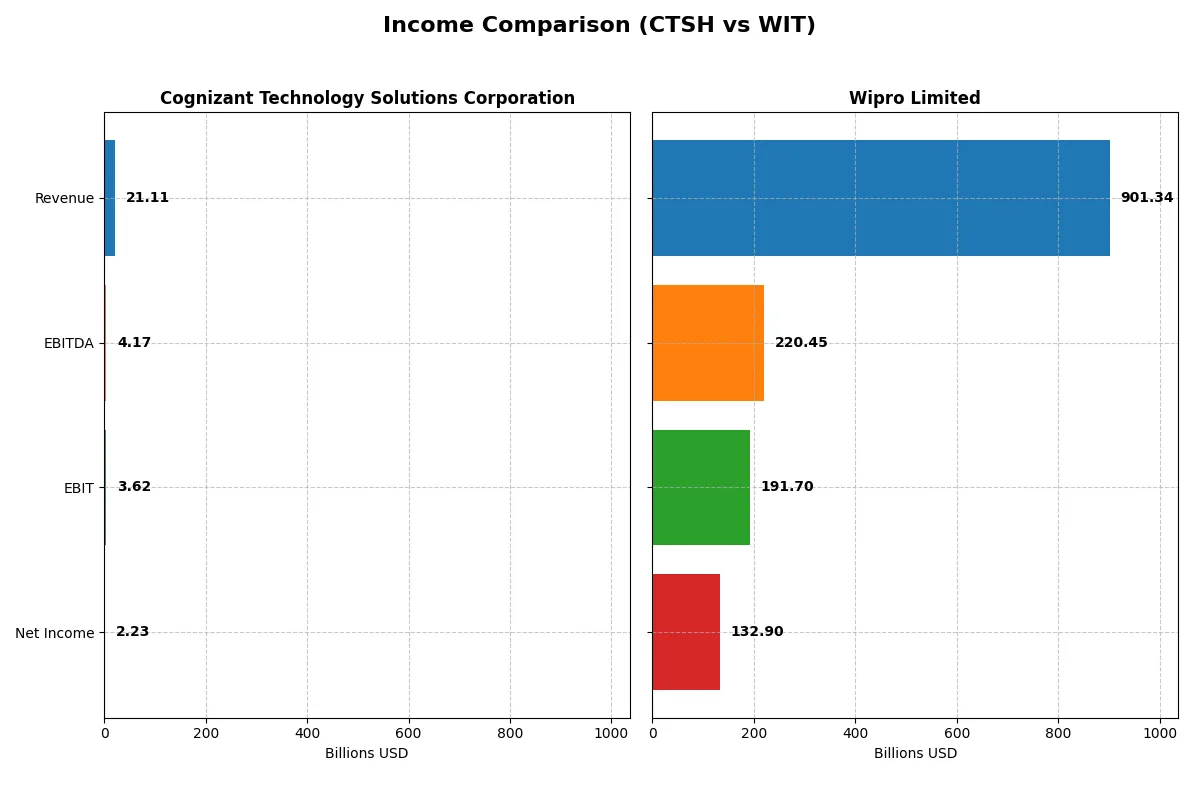
This data dissects the core profitability and scalability of both corporate engines to reveal who dominates the bottom line:
| Metric | Cognizant Technology Solutions Corporation (CTSH) | Wipro Limited (WIT) |
|---|---|---|
| Revenue | 21.1B USD | 901.3B INR |
| Cost of Revenue | 13.99B USD | 625.1B INR |
| Operating Expenses | 3.59B USD | 122.7B INR |
| Gross Profit | 7.12B USD | 276.3B INR |
| EBITDA | 4.17B USD | 220.5B INR |
| EBIT | 3.62B USD | 191.7B INR |
| Interest Expense | 37M USD | 14.94B INR |
| Net Income | 2.23B USD | 132.9B INR |
| EPS | 4.56 USD | 12.56 INR |
| Fiscal Year | 2025 | 2025 |
Income Statement Analysis: The Bottom-Line Duel
This income statement comparison reveals each company’s operational efficiency and profitability under diverse market dynamics.
Cognizant Technology Solutions Corporation Analysis
Cognizant shows steady revenue growth, hitting $21.1B in 2025, up 7% year-over-year. Net income holds near $2.23B, reflecting consistent profitability. Gross margin stands at a robust 33.7%, while net margin remains favorable at 10.6%. Despite slight net margin contraction, operating efficiency improved, with EBIT surging 21% in 2025.
Wipro Limited Analysis
Wipro records nearly flat revenue at 901B INR in 2025, a 0.2% decline from 2024, but boosts net income by 20% to 133B INR. Gross margin at 30.7% and net margin at 14.7% signal strong profitability. EBIT grows 19%, and EPS jumps 20%, indicating effective cost control and momentum despite stagnant top-line growth.
Margin Strength vs. Growth Momentum
Cognizant delivers stable revenue expansion with solid margin improvements, emphasizing operational discipline. Wipro exhibits superior net margin and faster net income growth, though revenue falters slightly. For investors, Cognizant offers steady scale gains, while Wipro appeals with sharper profitability acceleration and earnings momentum.
Financial Ratios Comparison
These vital ratios act as a diagnostic tool to expose the underlying fiscal health, valuation premiums, and capital efficiency of the companies compared below:
| Ratios | Cognizant Technology Solutions Corporation (CTSH) | Wipro Limited (WIT) |
|---|---|---|
| ROE | 14.85% | 16.04% |
| ROIC | 12.31% | 10.49% |
| P/E | 17.90 | 20.60 |
| P/B | 2.66 | 3.30 |
| Current Ratio | 2.34 | 2.72 |
| Quick Ratio | 2.34 | 2.71 |
| D/E (Debt-to-Equity) | 0.10 | 0.23 |
| Debt-to-Assets | 7.61% | 14.93% |
| Interest Coverage | 95.38 | 10.28 |
| Asset Turnover | 1.02 | 0.70 |
| Fixed Asset Turnover | 14.02 | 8.48 |
| Payout ratio | 27.35% | 47.22% |
| Dividend yield | 1.53% | 2.29% |
| Fiscal Year | 2025 | 2025 |
Efficiency & Valuation Duel: The Vital Signs
Financial ratios act as a company’s DNA, uncovering hidden risks and revealing operational excellence beneath surface numbers.
Cognizant Technology Solutions Corporation
Cognizant posts a solid 14.85% ROE and a favorable 10.56% net margin, reflecting steady profitability. Its P/E of 17.9 and P/B of 2.66 indicate a fairly valued stock, neither stretched nor cheap. The 1.53% dividend yield signals a balanced shareholder return, supplementing moderate buybacks and reinvestment in operational efficiency.
Wipro Limited
Wipro delivers a robust 16.04% ROE and a strong 14.74% net margin, showcasing higher profitability. Its P/E ratio of 20.6 suggests a neutral valuation, though a P/B of 3.3 flags a premium price. Wipro’s 2.29% dividend yield, combined with ongoing R&D spend, highlights a dual approach of rewarding shareholders and fueling growth.
Valuation Balance: Profitability and Price Discipline
Wipro offers superior profitability with a slightly premium valuation, while Cognizant balances steady returns and fair pricing more conservatively. Investors seeking growth with income may prefer Wipro’s profile; those favoring operational safety and valuation discipline might lean toward Cognizant.
Which one offers the Superior Shareholder Reward?
I compare Cognizant Technology Solutions Corporation (CTSH) and Wipro Limited (WIT) on dividends, payout ratios, and buybacks. CTSH delivers a 1.53% dividend yield with a 27% payout, supported by strong free cash flow coverage (3.2x). It also executes steady buybacks, enhancing shareholder value sustainably. WIT offers a higher 2.29% dividend yield but with a 47% payout ratio, risking sustainability. Its free cash flow covers dividends 2.2x, and while buybacks exist, they are less aggressive than CTSH’s. CTSH’s balanced distribution and robust cash flow suggest a more sustainable total return in 2026. I conclude CTSH offers the superior shareholder reward for prudent investors seeking long-term value.
Comparative Score Analysis: The Strategic Profile
The radar chart reveals the fundamental DNA and trade-offs of Cognizant Technology Solutions Corporation and Wipro Limited, highlighting their financial strengths and valuation nuances:
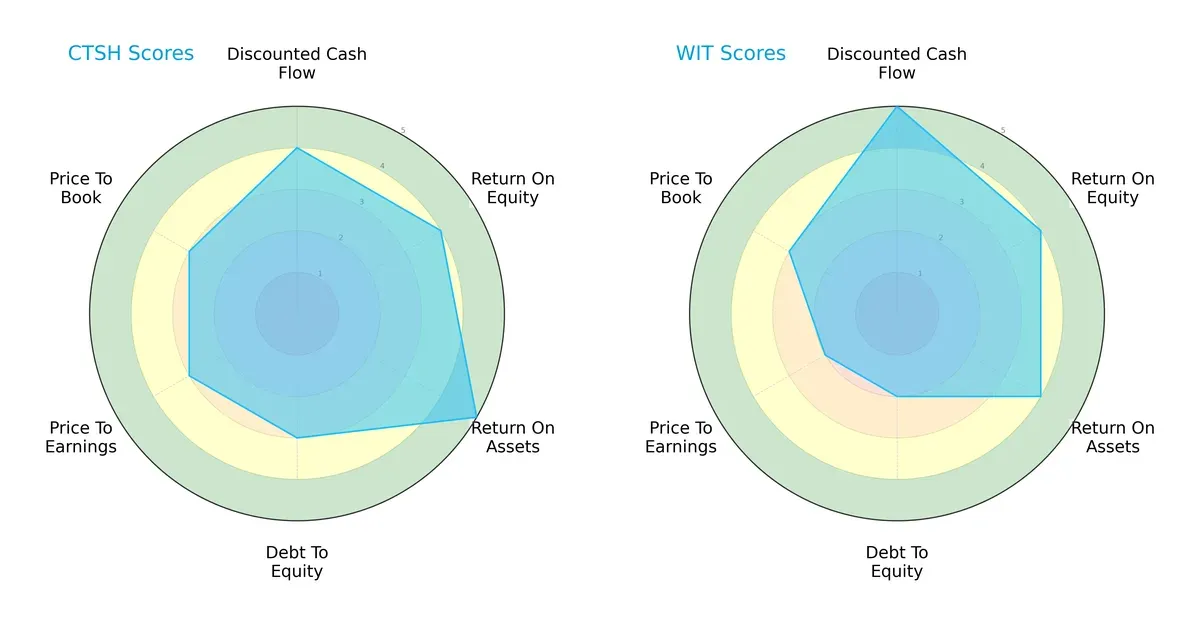
Cognizant shows a more balanced profile with very favorable ROA (5) and moderate but stable debt-to-equity and valuation scores (3). Wipro excels in discounted cash flow (5), indicating strong future cash generation, but lags in debt-to-equity (2) and valuation metrics (2), suggesting higher financial risk and potential overvaluation. Cognizant’s balanced approach offers stability; Wipro leverages a pronounced edge in cash flow strength.
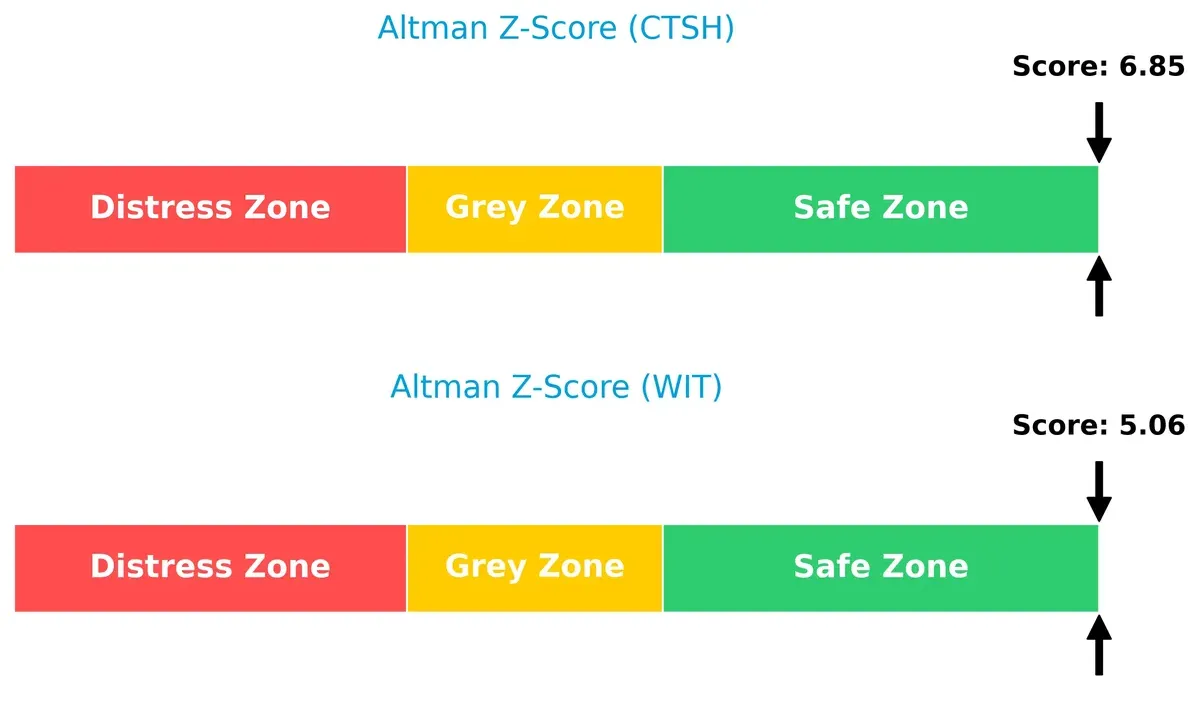
Bankruptcy Risk: Solvency Showdown
Cognizant’s higher Altman Z-Score (6.85) versus Wipro’s (5.06) implies stronger solvency and lower bankruptcy risk, positioning it more securely in this cycle’s volatile environment:
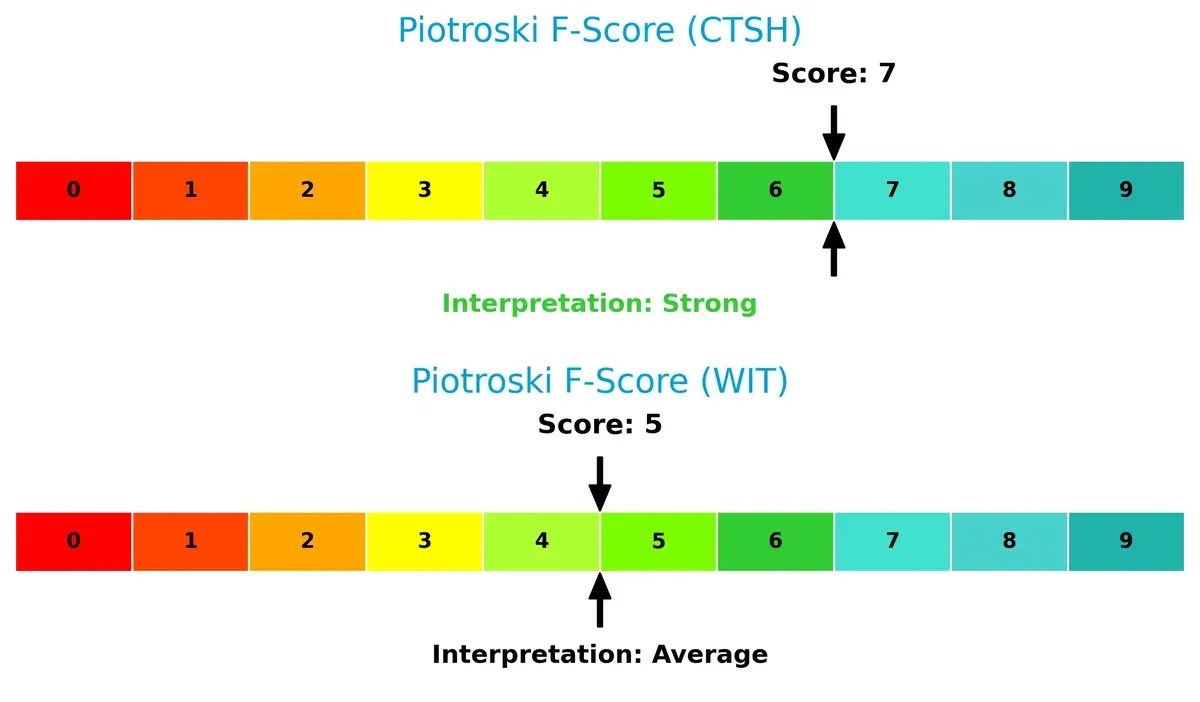
Financial Health: Quality of Operations
Cognizant’s Piotroski F-Score of 7 signals strong financial health and operational quality. Wipro’s 5 reflects average strength, raising mild red flags on internal financial metrics:
How are the two companies positioned?
This section dissects the operational DNA of Cognizant and Wipro by comparing their revenue distribution by segment and internal strengths and weaknesses. The goal is to confront their economic moats to identify which business model offers the most resilient and sustainable competitive advantage today.
Revenue Segmentation: The Strategic Mix
The following visual comparison dissects how both firms diversify their income streams and where their primary sector bets lie:
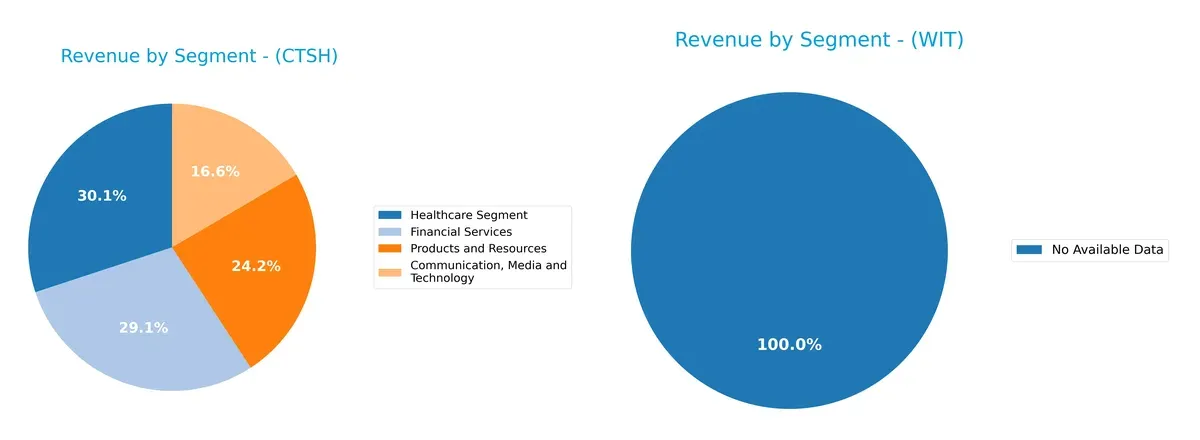
Cognizant Technology Solutions Corporation (CTSH) displays a well-balanced revenue profile across Healthcare (5.93B), Financial Services (5.75B), Products and Resources (4.78B), and Communication, Media and Technology (3.27B). This diverse base reduces concentration risk and supports ecosystem lock-in. Wipro Limited (WIT) lacks available data, preventing segmentation comparison and highlighting a transparency gap for investors. CTSH’s mix anchors its strategy in multiple stable sectors, enhancing resilience.
Strengths and Weaknesses Comparison
This table compares the Strengths and Weaknesses of Cognizant Technology Solutions Corporation and Wipro Limited:
CTSH Strengths
- Diverse revenue streams across Communication, Financial Services, Healthcare, Products
- Strong global presence with major sales in North America and Europe
- Favorable profitability ratios including net margin and ROIC
- Low debt levels and high interest coverage ratios
WIT Strengths
- Favorable profitability with higher net margin and ROE
- Lower WACC indicating cost-efficient capital structure
- Strong liquidity ratios with a higher current ratio
- Favorable dividend yield and fixed asset turnover
CTSH Weaknesses
- Neutral ROE and valuation multiples (PE, PB)
- Moderate market share concentration in North America and Europe
- No explicit data on innovation or product diversification beyond segments
WIT Weaknesses
- Unfavorable PB ratio indicating possible overvaluation
- Neutral asset turnover ratio suggesting efficiency challenges
- Lack of disclosed geographic revenue diversification
Overall, CTSH shows robust diversification and financial stability, especially in global markets and asset efficiency. WIT excels in profitability and capital cost management but faces valuation and efficiency scrutiny. Both companies’ strengths and weaknesses highlight different strategic priorities in growth and financial management.
The Moat Duel: Analyzing Competitive Defensibility
A structural moat is the only reliable shield protecting long-term profits from relentless competitive erosion. Let’s examine how these two IT giants defend their turf:
Cognizant Technology Solutions Corporation: Switching Costs Anchor Customer Loyalty
Cognizant’s competitive edge stems from high switching costs embedded in complex client integrations. Its steady 17% EBIT margin and 4.3% ROIC above WACC confirm value creation, though ROIC is slipping. Expansion into AI-driven healthcare services could deepen this moat by 2026.
Wipro Limited: Cost Advantage Powers Margin Leadership
Wipro’s moat arises from its superior cost structure, delivering a robust 21% EBIT margin and a 4.7% ROIC premium over WACC. Despite a declining ROIC trend, Wipro’s aggressive investments in digital transformation and Indian market dominance position it for disruptive growth ahead.
Switching Costs vs. Cost Advantage: The 2026 Moat Faceoff
Both firms create value with ROIC exceeding WACC by roughly 4-5%, yet Wipro’s higher margin signals a wider moat. Cognizant’s switching cost moat is durable but challenged by margin pressure. Wipro’s cost advantage better equips it to defend and expand market share in evolving IT services.
Which stock offers better returns?
Over the past year, Cognizant Technology Solutions Corporation’s stock gained 2.32%, showing accelerating bullish momentum. In contrast, Wipro Limited’s shares declined sharply by 18.24%, with decelerating bearish pressure.
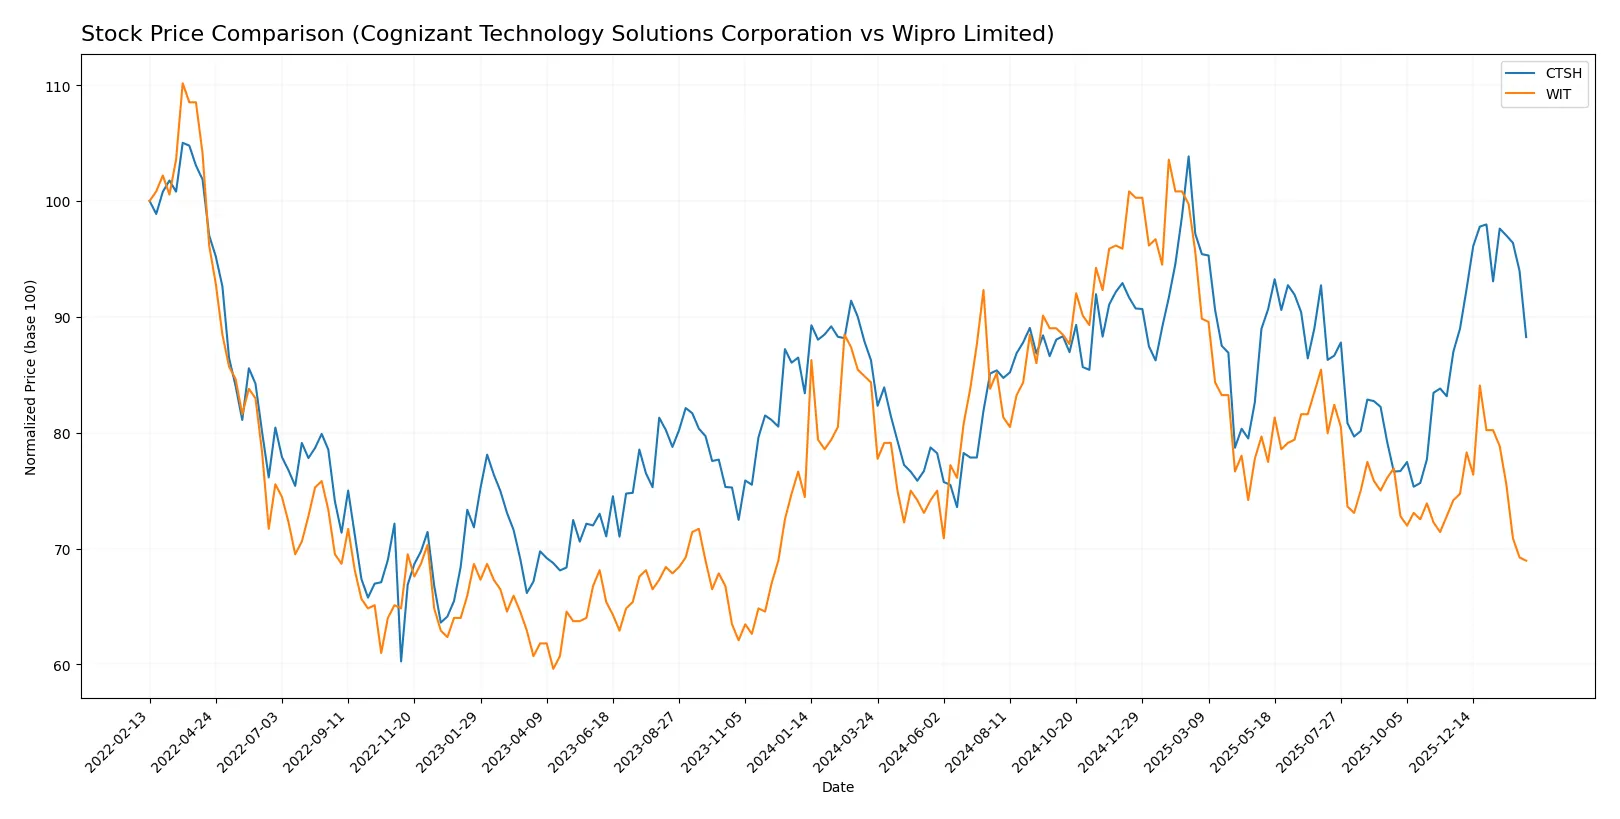
Trend Comparison
Cognizant Technology Solutions Corporation’s stock rose 2.32% over 12 months, marking a bullish trend with accelerating price gains and a high volatility of 5.77%.
Wipro Limited’s stock fell 18.24% over the same period, reflecting a bearish trend with deceleration and very low volatility at 0.32%.
Cognizant outperformed Wipro, delivering positive returns and strong upward momentum, while Wipro experienced significant declines and weakening price pressure.
Target Prices
Analysts present a moderate upside consensus for both Cognizant Technology Solutions Corporation and Wipro Limited.
| Company | Target Low | Target High | Consensus |
|---|---|---|---|
| Cognizant Technology Solutions Corporation | 82 | 107 | 93.2 |
| Wipro Limited | 7 | 7.7 | 7.35 |
Cognizant’s target consensus stands about 21% above its current price of $77.08, reflecting positive growth expectations. Wipro’s consensus target exceeds its $2.51 price substantially, signaling strong potential appreciation.

Don’t Let Luck Decide Your Entry Point
Optimize your entry points with our advanced ProRealTime indicators. You’ll get efficient buy signals with precise price targets for maximum performance. Start outperforming now!
How do institutions grade them?
Below is a summary of recent institutional grades for Cognizant Technology Solutions Corporation and Wipro Limited:
Cognizant Technology Solutions Corporation Grades
This table shows the latest grades assigned by various reputable grading companies to Cognizant Technology Solutions Corporation.
| Grading Company | Action | New Grade | Date |
|---|---|---|---|
| TD Cowen | Maintain | Hold | 2026-02-05 |
| Morgan Stanley | Maintain | Equal Weight | 2026-02-05 |
| RBC Capital | Maintain | Sector Perform | 2026-02-05 |
| Guggenheim | Maintain | Buy | 2026-01-28 |
| Citigroup | Maintain | Neutral | 2026-01-22 |
| Wells Fargo | Maintain | Overweight | 2026-01-14 |
| TD Cowen | Maintain | Hold | 2026-01-09 |
| UBS | Maintain | Neutral | 2025-12-08 |
| William Blair | Upgrade | Outperform | 2025-11-21 |
| UBS | Maintain | Neutral | 2025-10-30 |
Wipro Limited Grades
This table shows the latest grades assigned by various reputable grading companies to Wipro Limited.
| Grading Company | Action | New Grade | Date |
|---|---|---|---|
| UBS | Upgrade | Neutral | 2025-01-02 |
| Wedbush | Maintain | Underperform | 2024-01-16 |
| JP Morgan | Maintain | Underweight | 2023-05-24 |
| Bernstein | Downgrade | Underperform | 2023-03-22 |
| Bernstein | Downgrade | Underperform | 2023-03-21 |
| Goldman Sachs | Upgrade | Buy | 2022-09-13 |
| Goldman Sachs | Upgrade | Buy | 2022-09-12 |
| Morgan Stanley | Downgrade | Underweight | 2022-07-14 |
| Morgan Stanley | Downgrade | Underweight | 2022-07-13 |
| Macquarie | Upgrade | Outperform | 2022-06-02 |
Which company has the best grades?
Cognizant consistently receives grades in the Hold to Buy range, with recent upgrades to Outperform. Wipro’s grades are more mixed, including several Underperform and Underweight ratings despite occasional upgrades. Investors might view Cognizant’s steadier and generally more positive grades as a sign of greater confidence from analysts.
Risks specific to each company
The following categories identify the critical pressure points and systemic threats facing both firms in the 2026 market environment:
1. Market & Competition
Cognizant Technology Solutions Corporation
- Faces intense competition from global IT service providers with pressure on margins due to digital transformation demands.
Wipro Limited
- Competes strongly in India but less globally diversified; faces competition from both local and international IT firms.
2. Capital Structure & Debt
Cognizant Technology Solutions Corporation
- Maintains a very low debt-to-equity ratio (0.1), reflecting strong financial stability and conservative leverage.
Wipro Limited
- Higher leverage with debt-to-equity at 0.23, increasing financial risk despite still manageable interest coverage.
3. Stock Volatility
Cognizant Technology Solutions Corporation
- Beta near 1 (0.957) indicates stock moves closely with the market, moderate volatility.
Wipro Limited
- Lower beta (0.434) signals less sensitivity to market swings, lower stock volatility.
4. Regulatory & Legal
Cognizant Technology Solutions Corporation
- Operates primarily in the US and Europe, exposed to stringent data privacy and outsourcing regulations.
Wipro Limited
- Operates mainly in India with exposure to evolving government IT policy and compliance requirements.
5. Supply Chain & Operations
Cognizant Technology Solutions Corporation
- Relies on global operations with potential risks from geopolitical tensions and offshore delivery model disruptions.
Wipro Limited
- More concentrated in India, risks tied to local infrastructure and government contracts in the ISRE segment.
6. ESG & Climate Transition
Cognizant Technology Solutions Corporation
- Increasing pressure to align with global ESG standards; digital and AI services require sustainable practices.
Wipro Limited
- Faces growing demands from Indian regulators and investors to improve ESG disclosures and climate resilience.
7. Geopolitical Exposure
Cognizant Technology Solutions Corporation
- High exposure to US and European markets; sensitive to trade tensions and regulatory changes in those regions.
Wipro Limited
- Primarily exposed to Indian market dynamics and regional geopolitical risks in South Asia.
Which company shows a better risk-adjusted profile?
Cognizant’s strongest risk is market competition intensified by global digital shifts. Wipro’s greatest risk lies in elevated leverage and regional concentration. Wipro shows a very favorable overall financial rating but has moderate risks in debt and valuation metrics. Cognizant’s robust liquidity and low leverage provide a safer balance sheet. Given Cognizant’s higher Altman Z-score and Piotroski score, it demonstrates a stronger risk-adjusted profile. Recent data confirm Cognizant’s superior financial stability despite competitive pressures.
Final Verdict: Which stock to choose?
Cognizant Technology Solutions Corporation’s superpower lies in its consistent cash generation and efficient capital use, reflected in a strong balance sheet and favorable financial ratios. A point of vigilance is its slightly declining profitability trend. It suits portfolios aiming for steady growth with moderate risk tolerance.
Wipro Limited boasts a strategic moat through its robust recurring revenue and disciplined capital management. Its financial safety appears slightly weaker than Cognizant’s, especially regarding leverage, yet it offers higher earnings growth potential. This profile aligns with investors seeking GARP—growth at a reasonable price—with a tolerance for valuation premium.
If you prioritize capital efficiency and financial stability, Cognizant outshines due to its superior balance sheet and consistent cash flow. However, if you seek higher growth with a strategic moat in emerging markets, Wipro offers better growth dynamics despite elevated risk. Both present viable scenarios depending on your risk appetite and investment horizon.
Disclaimer: Investment carries a risk of loss of initial capital. The past performance is not a reliable indicator of future results. Be sure to understand risks before making an investment decision.
Go Further
I encourage you to read the complete analyses of Cognizant Technology Solutions Corporation and Wipro Limited to enhance your investment decisions: