Home > Comparison > Technology > CTSH vs LDOS
The strategic rivalry between Cognizant Technology Solutions Corporation and Leidos Holdings, Inc. shapes the future of the Information Technology Services sector. Cognizant operates as a global digital consulting and outsourcing powerhouse, while Leidos focuses on defense-driven technology and national security solutions. This analysis explores their contrasting operational models and growth drivers to identify which company offers a superior risk-adjusted return for a diversified portfolio.
Table of contents
Companies Overview
Cognizant and Leidos stand as pivotal players in the evolving Information Technology Services sector.
Cognizant Technology Solutions Corporation: Global IT Consulting Powerhouse
Cognizant operates as a professional services company specializing in consulting, technology, and outsourcing across multiple industries. Its core revenue stems from delivering digital transformation services, including AI, analytics, and robotic process automation. In 2026, Cognizant emphasizes customer experience enhancement and outcome-based contracting, targeting healthcare, financial services, and media sectors for operational efficiency gains.
Leidos Holdings, Inc.: Defense and Civil IT Innovator
Leidos focuses on providing technology solutions primarily to defense, intelligence, civil, and health markets. It generates revenue through national security systems, IT modernization, and health digital transformation services. The firm’s 2026 strategy concentrates on expanding its footprint in cybersecurity, cloud computing, and advanced systems integration for government and commercial clients.
Strategic Collision: Similarities & Divergences
Both firms compete in IT services but diverge sharply in philosophy: Cognizant drives a broad commercial consulting model while Leidos anchors on specialized government and defense contracts. Their battleground lies in the digital transformation arena, with Cognizant targeting multi-sector commercial clients, and Leidos focusing on national security and health. This contrast shapes distinct investment profiles—Cognizant’s scale and diversity versus Leidos’ niche expertise and lower beta.
Income Statement Comparison
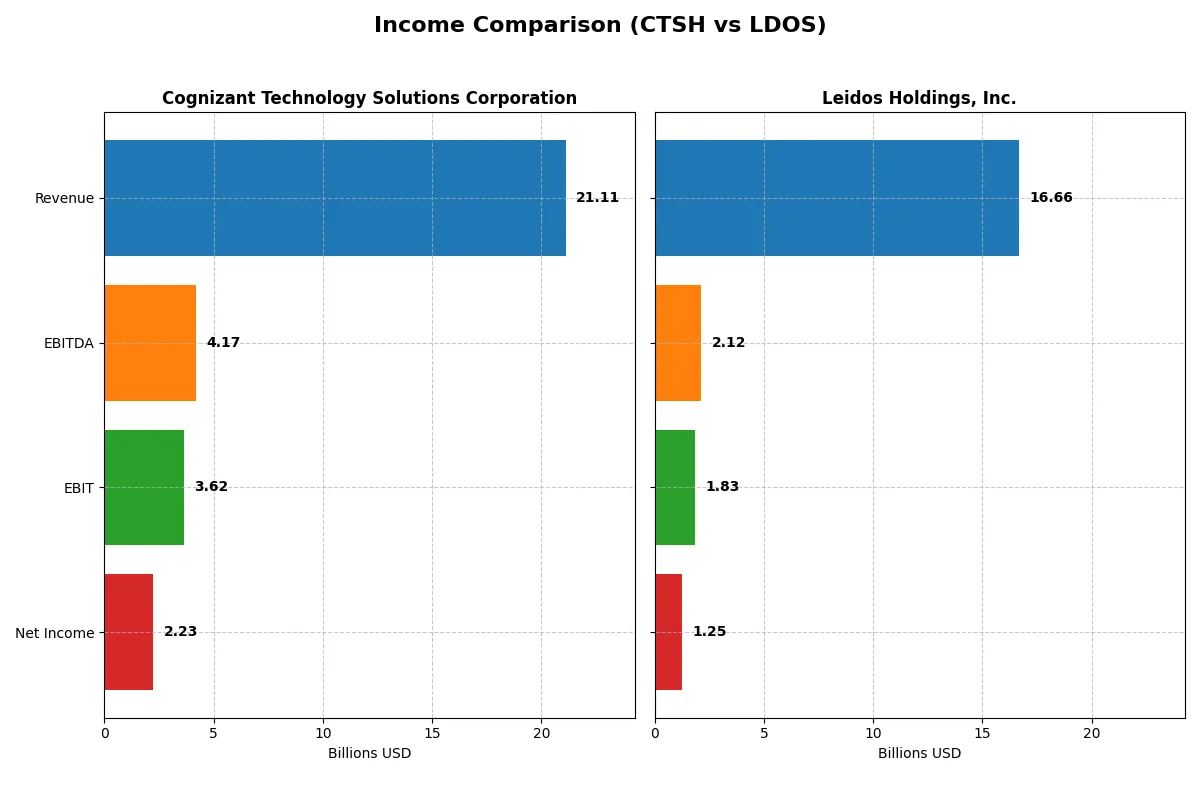
This data dissects the core profitability and scalability of both corporate engines to reveal who dominates the bottom line:
| Metric | Cognizant Technology Solutions Corporation (CTSH) | Leidos Holdings, Inc. (LDOS) |
|---|---|---|
| Revenue | 21.1B | 16.7B |
| Cost of Revenue | 14.0B | 13.9B |
| Operating Expenses | 3.59B | 971M |
| Gross Profit | 7.12B | 2.80B |
| EBITDA | 4.17B | 2.12B |
| EBIT | 3.62B | 1.83B |
| Interest Expense | 37M | 193M |
| Net Income | 2.23B | 1.25B |
| EPS | 4.56 | 9.36 |
| Fiscal Year | 2025 | 2024 |
Income Statement Analysis: The Bottom-Line Duel
This income statement comparison reveals which company runs a more efficient corporate engine through revenue growth and margin management.
Cognizant Technology Solutions Corporation Analysis
Cognizant’s revenue grew steadily from $18.5B in 2021 to $21.1B in 2025, showing a 14% increase over five years. Net income rose modestly to $2.23B in 2025 despite a slight decline in net margin to 10.6%. Gross margins remain strong at 33.7%, and EBIT margin improved to 17.2%, signaling efficient cost control and solid operational momentum.
Leidos Holdings, Inc. Analysis
Leidos expanded revenue impressively from $12.3B in 2020 to $16.7B in 2024, a 35.5% gain. Net income surged nearly 100% to $1.25B in 2024, with net margin climbing to 7.5%. Though gross margin trails Cognizant at 16.8%, EBIT margin of 11% and significant EBIT growth highlight accelerating profitability and operational leverage in recent years.
Margin Strength vs. Growth Momentum
Cognizant leads with superior gross and EBIT margins, reflecting operational efficiency and margin discipline. Leidos, meanwhile, drives faster revenue and net income growth with notable margin expansion. For investors, Cognizant’s profile suits those valuing margin stability, while Leidos appeals to those seeking stronger growth momentum and profitability improvement.
Financial Ratios Comparison
These vital ratios act as a diagnostic tool exposing underlying fiscal health, valuation premiums, and capital efficiency of the companies compared:
| Ratios | Cognizant Technology Solutions (CTSH) | Leidos Holdings, Inc. (LDOS) |
|---|---|---|
| ROE | 14.85% | 28.42% |
| ROIC | 12.31% | 13.85% |
| P/E | 17.90 | 15.72 |
| P/B | 2.66 | 4.47 |
| Current Ratio | 2.34 | 1.21 |
| Quick Ratio | 2.34 | 1.13 |
| D/E | 0.10 | 1.20 |
| Debt-to-Assets | 7.61% | 40.38% |
| Interest Coverage | 95.38 | 9.47 |
| Asset Turnover | 1.02 | 1.27 |
| Fixed Asset Turnover | 14.02 | 10.74 |
| Payout Ratio | 27.35% | 16.59% |
| Dividend Yield | 1.53% | 1.05% |
| Fiscal Year | 2025 | 2024 |
Efficiency & Valuation Duel: The Vital Signs
Financial ratios act as the company’s DNA, revealing hidden risks and operational excellence beyond headline figures.
Cognizant Technology Solutions Corporation
Cognizant shows solid profitability with a 14.85% ROE and favorable 10.56% net margin. Its valuation is fairly priced at a 17.9 P/E and 2.66 P/B, reflecting balanced market expectations. The company maintains a healthy dividend yield of 1.53%, rewarding shareholders while preserving strong liquidity and low leverage.
Leidos Holdings, Inc.
Leidos delivers an impressive 28.42% ROE and a decent 7.53% net margin, signaling efficient capital use. The stock trades at a neutral 15.72 P/E but a stretched 4.47 P/B, hinting at premium valuation. Its dividend yield is lower at 1.05%, with higher debt levels indicating greater financial risk despite operational strength.
Balanced Profitability vs. Financial Stability
Cognizant balances profitability with prudent leverage and steady shareholder returns, while Leidos offers higher ROE but carries elevated debt and valuation risks. Investors prioritizing stability may prefer Cognizant’s profile, whereas those seeking growth with higher risk might consider Leidos.
Which one offers the Superior Shareholder Reward?
I compare Cognizant Technology Solutions Corporation (CTSH) and Leidos Holdings, Inc. (LDOS) focusing on dividends, payout ratios, and buybacks. CTSH yields 1.53% with a payout ratio near 27%, supported by strong free cash flow covering 320% of dividends plus capex. LDOS yields 1.05%, pays a lower payout ratio of 16.6%, but shows higher leverage and weaker operating cash flow coverage. CTSH’s consistent buybacks and sustainable dividend policy contrast with LDOS’s higher debt and less robust cash flow. I conclude CTSH offers a superior, more sustainable total shareholder return profile in 2026.
Comparative Score Analysis: The Strategic Profile
The radar chart reveals the fundamental DNA and trade-offs of Cognizant Technology Solutions and Leidos Holdings, Inc., highlighting their distinct financial strengths and risks:
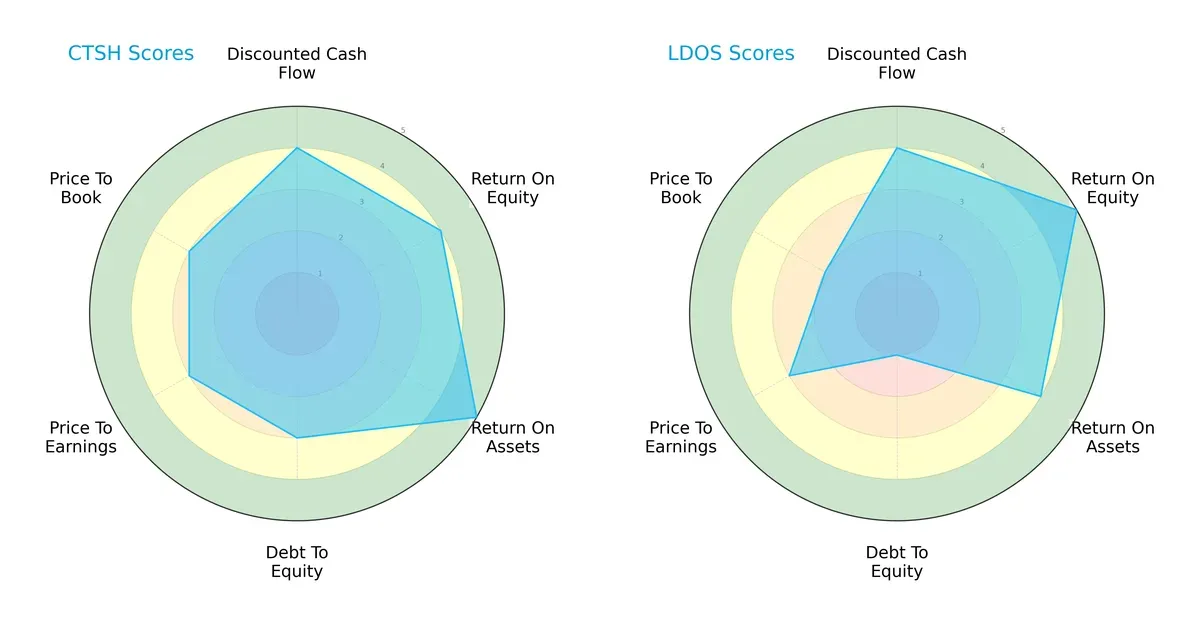
Cognizant presents a balanced profile with solid returns on assets (5) and equity (4), supported by moderate debt and valuation scores (3 each). Leidos excels in return on equity (5) and maintains a favorable discounted cash flow score (4), but its weak debt-to-equity score (1) signals higher financial risk. Cognizant’s moderate leverage contrasts with Leidos’ aggressive capital structure, showing their differing approaches to growth and risk management.
Bankruptcy Risk: Solvency Showdown
The Altman Z-Score delta favors Cognizant (6.85) over Leidos (4.09), confirming both firms are in the safe zone but with differing margins of safety:
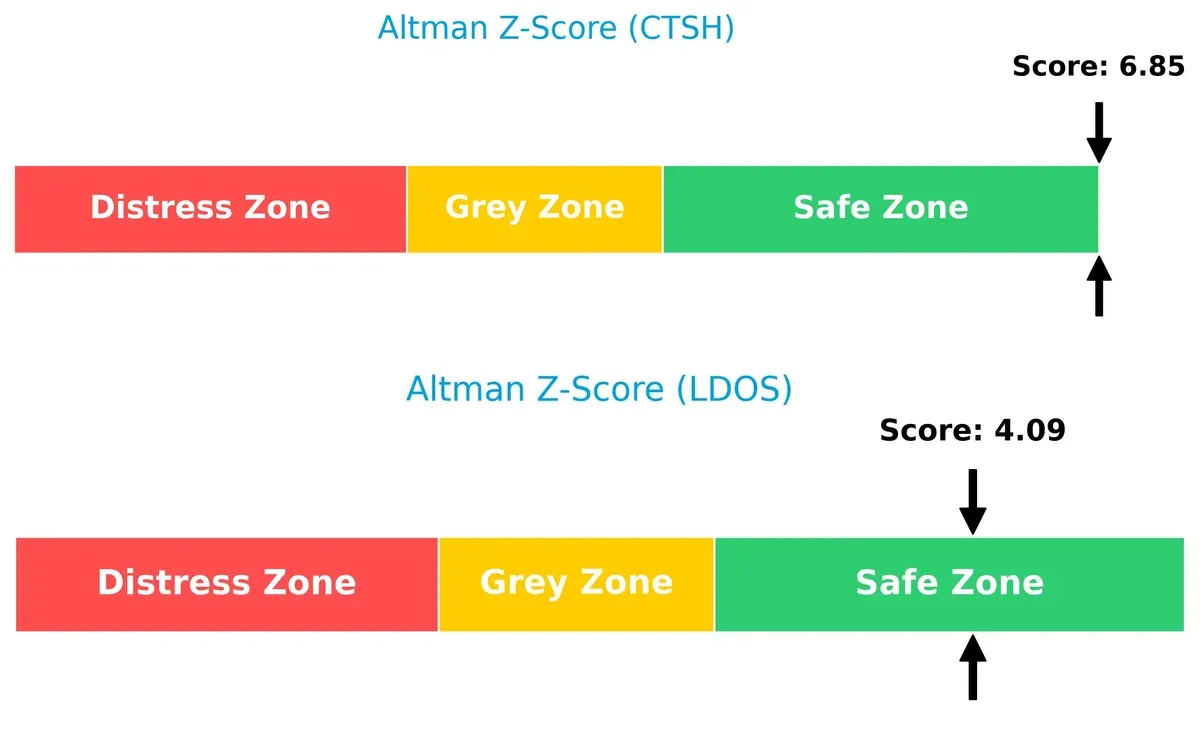
Cognizant’s higher Z-score suggests a stronger buffer against bankruptcy risk in volatile markets, reflecting prudent leverage and liquidity management. Leidos, while also safe, faces closer scrutiny due to its thinner margin, indicating caution for long-term survival in downturns.
Financial Health: Quality of Operations
Leidos scores an 8 on the Piotroski F-Score, outperforming Cognizant’s 7, indicating stronger operational quality and internal financial health:
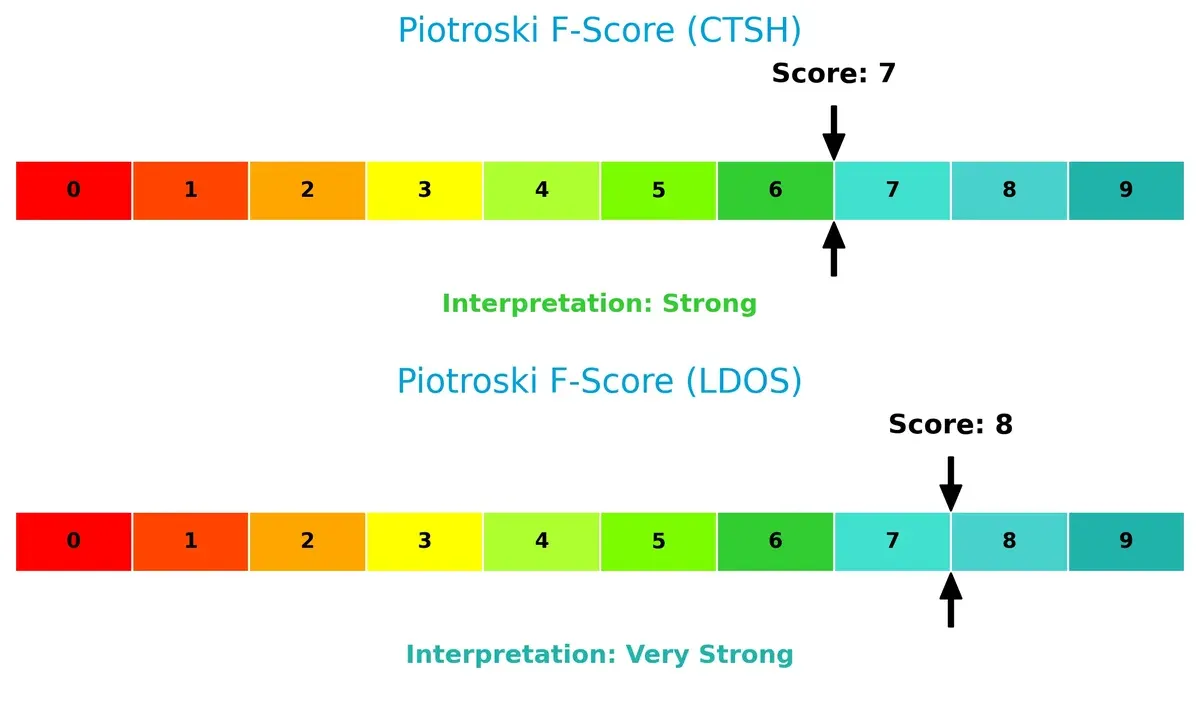
Leidos’ very strong score signals robust profitability, liquidity, and efficiency metrics. Cognizant remains strong but shows slightly less financial resilience. Neither firm raises red flags, but Leidos edges ahead in operational robustness, critical for weathering sector cyclicality.
How are the two companies positioned?
This section dissects the operational DNA of Cognizant and Leidos by comparing their revenue distribution and internal dynamics. The goal is to confront their economic moats and identify which model delivers the most resilient competitive advantage today.
Revenue Segmentation: The Strategic Mix
This visual comparison dissects how Cognizant Technology Solutions and Leidos Holdings diversify their income streams and where their primary sector bets lie:
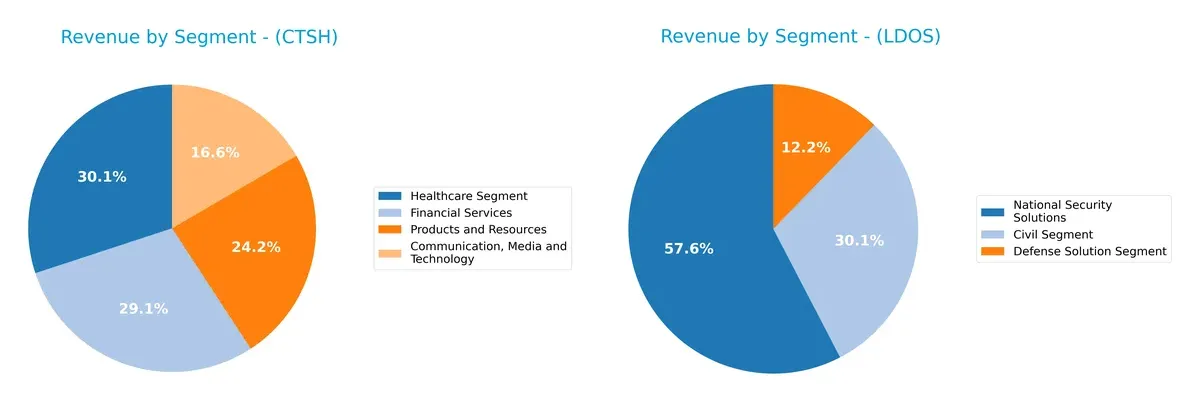
Cognizant balances revenue across Healthcare (5.9B), Financial Services (5.8B), Products & Resources (4.8B), and Communication (3.3B). This diversified mix mitigates concentration risk and signals broad market exposure. Leidos, however, anchors 9.6B in National Security Solutions, overshadowing Civil (5.0B) and Defense (2.0B). This concentration highlights a strategic pivot on defense and government contracts, increasing dependency on public sector budgets but leveraging infrastructure dominance.
Strengths and Weaknesses Comparison
This table compares the Strengths and Weaknesses of Cognizant Technology Solutions Corporation (CTSH) and Leidos Holdings, Inc. (LDOS):
CTSH Strengths
- Diversified revenue across healthcare, financial services, and technology
- Favorable net margin and ROIC indicate efficient profitability
- Strong liquidity with current and quick ratios above 2.3
- Low debt levels and excellent interest coverage ratio
- Solid asset turnover metrics reflecting operational efficiency
LDOS Strengths
- High ROE and ROIC demonstrate effective capital allocation
- Favorable WACC supports lower capital costs
- Strong asset turnover and fixed asset utilization
- Favorable interest coverage despite higher debt
- Revenue concentration in national security and defense with strong market presence
CTSH Weaknesses
- Moderate ROE rated neutral, suggesting room for improvement
- Neutral valuation multiples (PE, PB) imply market uncertainty
- Limited geographic diversification compared to North America focus
- Dividend yield is neutral, less attractive for income investors
LDOS Weaknesses
- Higher debt-to-equity ratio indicates greater leverage risk
- Unfavorable price-to-book ratio may signal overvaluation
- Moderate current ratio suggests tighter short-term liquidity
- Net margin rated neutral, indicating average profitability
- Heavy reliance on U.S. market limits global presence
Overall, CTSH displays strong financial health with diversified revenue and conservative leverage, supporting stability in varied market cycles. LDOS excels in profitability and capital efficiency but carries higher leverage and concentration risks, which may impact its strategic flexibility.
The Moat Duel: Analyzing Competitive Defensibility
A structural moat shields long-term profits from relentless competitive erosion. Without it, market gains vanish quickly. Let’s examine the defensive barriers of two tech service giants:
Cognizant Technology Solutions Corporation: Wide Scale Integration Moat
I see Cognizant’s moat rooted in its intangible assets and diversified client base across North America and Europe. Its 17% EBIT margin and 4.3% ROIC premium over WACC confirm efficient capital use. Yet, a declining ROIC trend warns of margin pressure. New AI and automation services in 2026 may deepen its moat if execution holds.
Leidos Holdings, Inc.: Government Contract Specialization Moat
Leidos relies on high switching costs and specialized defense contracts, contrasting Cognizant’s broader market focus. Its 7.8% ROIC excess and surging 67% ROIC growth display a widening moat. Exceptional net margin growth signals operational leverage. Expansion in cyber and space domains in 2026 could disrupt markets and enhance its fortress.
Integration Scale vs. Contract Specialization: Who Holds the Stronger Moat?
Leidos commands a deeper, more sustainable moat, evidenced by robust ROIC growth and specialized government contracts. Cognizant’s broader moat is wider but shows signs of erosion. Leidos stands better poised to defend and expand market share amid rising complexity and technological demands.
Which stock offers better returns?
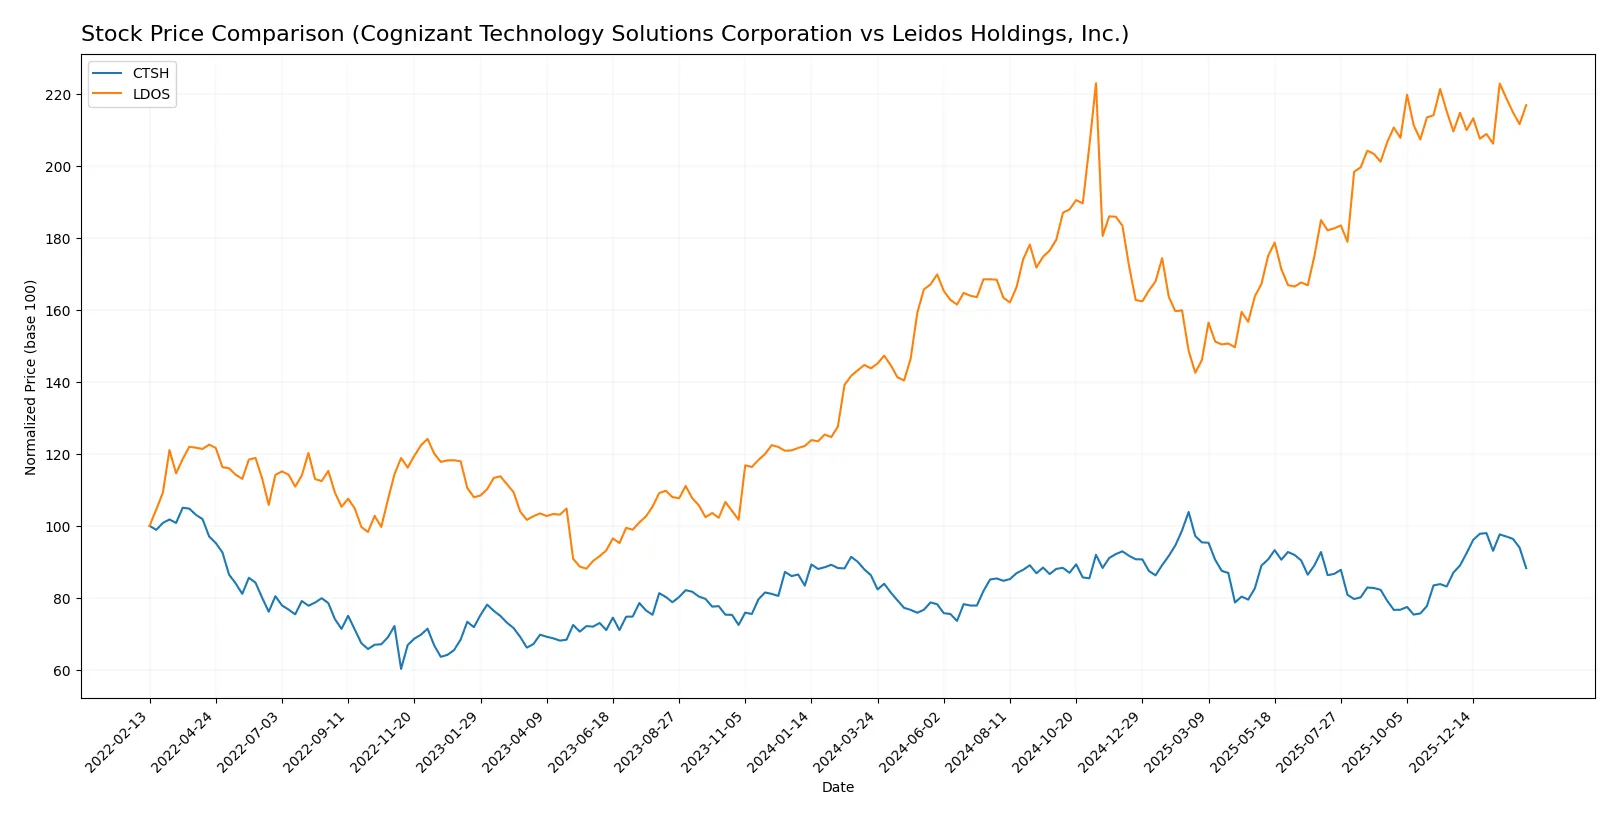
The past year shows contrasting price dynamics: Cognizant Technology Solutions edges a modest 2.32% gain with accelerating momentum, while Leidos Holdings surges over 50% despite slowing acceleration.
Trend Comparison
Cognizant Technology Solutions posts a bullish 2.32% rise over 12 months, marked by accelerating gains and moderate volatility (5.77 std deviation), peaking at 90.7 and bottoming at 64.26.
Leidos Holdings delivers a strong bullish trend with a 50.87% increase over 12 months, though acceleration decelerates; volatility is higher at 20.73 std deviation with a high of 198.42 and low of 124.91.
Leidos outperforms Cognizant by a wide margin in total returns, despite decelerating momentum and greater price volatility over the past year.
Target Prices
Analysts present a bullish consensus with solid upside potential for both Cognizant Technology Solutions and Leidos Holdings.
| Company | Target Low | Target High | Consensus |
|---|---|---|---|
| Cognizant Technology Solutions Corporation | 82 | 107 | 93.2 |
| Leidos Holdings, Inc. | 204 | 230 | 219.8 |
Cognizant’s target consensus of 93.2 suggests a 21% premium to the current 77.08 price. Leidos’s consensus near 220 implies a 14% upside from 192.99. Analysts expect steady growth in both names.

Don’t Let Luck Decide Your Entry Point
Optimize your entry points with our advanced ProRealTime indicators. You’ll get efficient buy signals with precise price targets for maximum performance. Start outperforming now!
How do institutions grade them?
The following tables summarize recent institutional grades for Cognizant Technology Solutions Corporation and Leidos Holdings, Inc.:
Cognizant Technology Solutions Corporation Grades
This table lists the latest grades issued by reputable financial institutions for Cognizant:
| Grading Company | Action | New Grade | Date |
|---|---|---|---|
| TD Cowen | Maintain | Hold | 2026-02-05 |
| Morgan Stanley | Maintain | Equal Weight | 2026-02-05 |
| RBC Capital | Maintain | Sector Perform | 2026-02-05 |
| Guggenheim | Maintain | Buy | 2026-01-28 |
| Citigroup | Maintain | Neutral | 2026-01-22 |
| Wells Fargo | Maintain | Overweight | 2026-01-14 |
| TD Cowen | Maintain | Hold | 2026-01-09 |
| UBS | Maintain | Neutral | 2025-12-08 |
| William Blair | Upgrade | Outperform | 2025-11-21 |
| UBS | Maintain | Neutral | 2025-10-30 |
Leidos Holdings, Inc. Grades
This table shows the most recent institutional grades for Leidos Holdings:
| Grading Company | Action | New Grade | Date |
|---|---|---|---|
| UBS | Maintain | Neutral | 2026-01-15 |
| Citigroup | Maintain | Buy | 2026-01-13 |
| Stifel | Downgrade | Hold | 2026-01-08 |
| B of A Securities | Maintain | Buy | 2025-11-07 |
| UBS | Maintain | Neutral | 2025-11-05 |
| Truist Securities | Maintain | Buy | 2025-11-05 |
| Cantor Fitzgerald | Maintain | Overweight | 2025-10-31 |
| Argus Research | Maintain | Buy | 2025-09-24 |
| RBC Capital | Upgrade | Outperform | 2025-09-04 |
| B of A Securities | Maintain | Buy | 2025-09-04 |
Which company has the best grades?
Leidos Holdings has more frequent buy and outperform ratings, reflecting higher optimism from institutions. Cognizant’s grades are more mixed, with several hold and neutral ratings. Investors may interpret Leidos’s stronger consensus grades as a signal of greater institutional confidence.
Risks specific to each company
The following categories identify critical pressure points and systemic threats facing Cognizant Technology Solutions Corporation and Leidos Holdings, Inc. in the 2026 market environment:
1. Market & Competition
Cognizant Technology Solutions Corporation
- Faces intense competition in IT services, pressured by digital transformation demands and evolving client expectations.
Leidos Holdings, Inc.
- Competes in defense and government sectors with reliance on federal budgets and specialized contracts.
2. Capital Structure & Debt
Cognizant Technology Solutions Corporation
- Maintains low debt-to-equity ratio (0.1), indicating strong balance sheet and low financial risk.
Leidos Holdings, Inc.
- High debt-to-equity ratio (1.2) signals elevated leverage and increased financial risk.
3. Stock Volatility
Cognizant Technology Solutions Corporation
- Beta near 1 (0.957) suggests stock moves closely with broader market, moderate volatility.
Leidos Holdings, Inc.
- Lower beta (0.62) indicates less volatility relative to market, potentially more stable.
4. Regulatory & Legal
Cognizant Technology Solutions Corporation
- Exposed to data privacy regulations and outsourcing compliance risks globally.
Leidos Holdings, Inc.
- Faces stringent government contract regulations and national security scrutiny.
5. Supply Chain & Operations
Cognizant Technology Solutions Corporation
- Dependent on global IT talent and technology infrastructure, vulnerable to labor market shifts.
Leidos Holdings, Inc.
- Relies on government procurement cycles and specialized operational capabilities.
6. ESG & Climate Transition
Cognizant Technology Solutions Corporation
- Increasing pressure to demonstrate sustainability in operations and digital ethics.
Leidos Holdings, Inc.
- Must align with government ESG mandates, especially in defense-related environmental impact.
7. Geopolitical Exposure
Cognizant Technology Solutions Corporation
- Global operations expose it to geopolitical instability in key regions like Europe and Asia.
Leidos Holdings, Inc.
- Heavy dependence on U.S. government contracts limits geographic risk but ties to political shifts.
Which company shows a better risk-adjusted profile?
Leidos faces its main risk in elevated leverage, which increases financial vulnerability despite strong operational metrics. Cognizant’s primary risk lies in fierce market competition amid rapid technological shifts. I see Cognizant’s low leverage and favorable liquidity ratios as strong risk mitigants. Meanwhile, Leidos’ high debt and weaker price-to-book ratio raise caution. The data confirms Cognizant offers a superior risk-adjusted profile in the current market.
Final Verdict: Which stock to choose?
Cognizant Technology Solutions Corporation’s superpower lies in its resilient cash generation and efficient capital use, reflected in a strong balance sheet and consistent value creation. A point of vigilance remains its slightly declining profitability trend. It suits investors targeting steady, long-term growth with moderate risk tolerance.
Leidos Holdings, Inc. boasts a strategic moat through its growing return on invested capital and robust profitability, driven by a specialized defense and technology niche. Despite higher leverage and some balance sheet caution, it offers greater growth momentum and stability relative to Cognizant. It aligns well with investors seeking growth at a reasonable price with a tolerance for elevated financial risk.
If you prioritize capital efficiency and a conservative risk profile, Cognizant stands out due to its strong liquidity and stable cash flows. However, if you seek accelerated growth supported by a widening moat and can accept higher leverage, Leidos offers better upside with a more dynamic earnings trajectory. Both present compelling but distinct analytical scenarios depending on your investment strategy.
Disclaimer: Investment carries a risk of loss of initial capital. The past performance is not a reliable indicator of future results. Be sure to understand risks before making an investment decision.
Go Further
I encourage you to read the complete analyses of Cognizant Technology Solutions Corporation and Leidos Holdings, Inc. to enhance your investment decisions: