Home > Comparison > Technology > IBM vs CTSH
The strategic rivalry between International Business Machines Corporation (IBM) and Cognizant Technology Solutions Corporation (CTSH) shapes the technology services sector’s evolution. IBM operates as a diversified technology powerhouse, offering hybrid cloud, AI, and consulting services, while Cognizant focuses on high-touch professional services and digital transformation outsourcing. This analysis explores their contrasting models and growth trajectories to identify which stock offers a superior risk-adjusted return for a diversified portfolio.
Table of contents
Companies Overview
International Business Machines Corporation and Cognizant Technology Solutions Corporation are pivotal players in the global IT services market.
International Business Machines Corporation: Integrated Solutions Powerhouse
IBM dominates as a technology services leader with a diverse portfolio spanning software, consulting, infrastructure, and financing. Its core revenue derives from hybrid cloud platforms, AI solutions, and enterprise software, including Red Hat. In 2026, IBM focuses strategically on expanding its hybrid cloud and AI capabilities to serve mission-critical workloads across industries.
Cognizant Technology Solutions Corporation: Digital Transformation Specialist
Cognizant excels as a professional services firm providing consulting, technology, and outsourcing globally. Its revenue engine centers on digital experience enhancement, robotic process automation, and AI services across sectors like healthcare, financial services, and media. In 2026, Cognizant emphasizes operational improvements and omni-channel digital solutions to meet evolving client demands.
Strategic Collision: Similarities & Divergences
IBM adopts a hybrid cloud and AI-driven model, leveraging integrated software and infrastructure, while Cognizant pursues a client-centric, digital transformation approach with outsourcing at its core. Their primary battleground lies in delivering innovative IT services that optimize enterprise operations. IBM’s robust platform investments contrast with Cognizant’s agile, service-oriented profile, defining distinct long-term value propositions for investors.
Income Statement Comparison
This data dissects the core profitability and scalability of both corporate engines to reveal who dominates the bottom line:
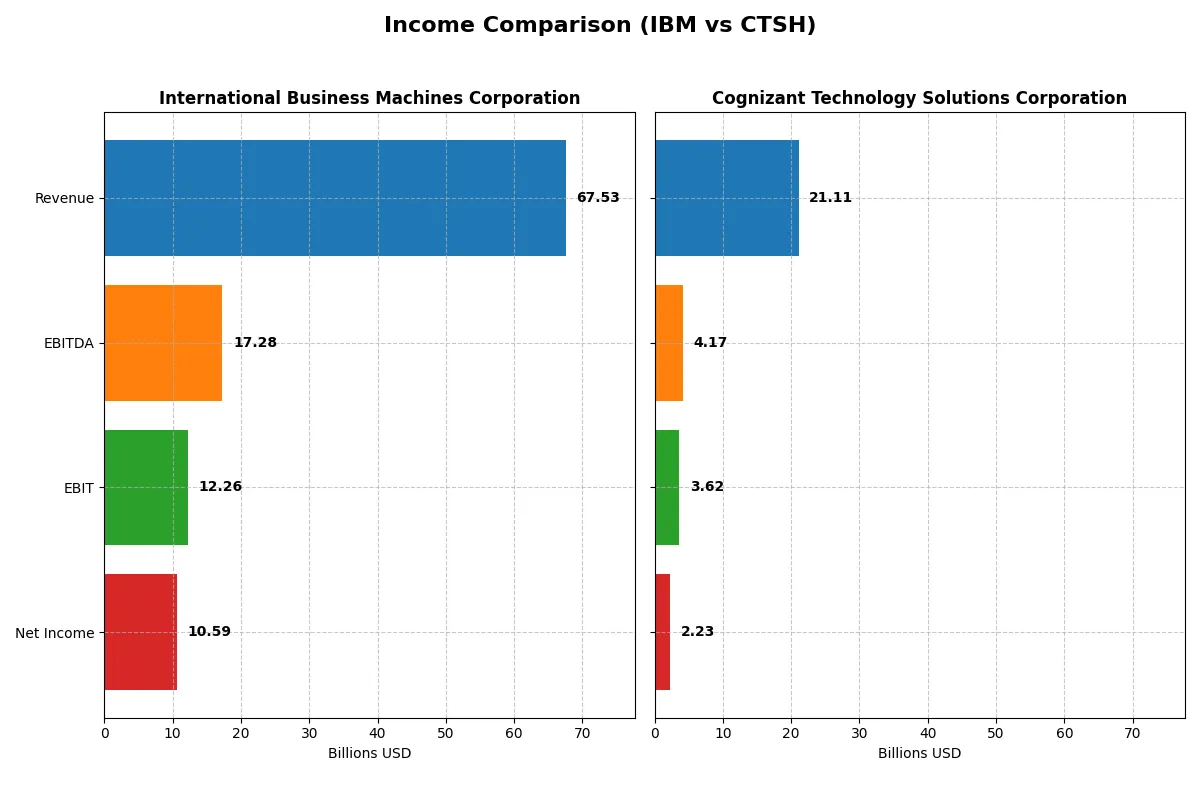
| Metric | International Business Machines Corporation (IBM) | Cognizant Technology Solutions Corporation (CTSH) |
|---|---|---|
| Revenue | 67.5B | 21.1B |
| Cost of Revenue | 27.4B | 14.0B |
| Operating Expenses | 29.9B | 3.6B |
| Gross Profit | 40.2B | 7.1B |
| EBITDA | 17.3B | 4.2B |
| EBIT | 12.3B | 3.6B |
| Interest Expense | 1.9B | 37M |
| Net Income | 10.6B | 2.2B |
| EPS | 11.36 | 4.56 |
| Fiscal Year | 2025 | 2025 |
Income Statement Analysis: The Bottom-Line Duel
This income statement comparison reveals which company delivers stronger operational efficiency and bottom-line profitability in a competitive tech landscape.
International Business Machines Corporation Analysis
IBM’s revenue climbed steadily from $57.4B in 2021 to $67.5B in 2025. Net income surged impressively from $5.74B to $10.6B, reflecting robust margin expansion. Its gross margin stands at a healthy 59.5%, while net margin rose to 15.7%. In 2025, IBM accelerated EBIT growth by 63%, signaling enhanced operational leverage and strong momentum.
Cognizant Technology Solutions Corporation Analysis
Cognizant’s revenue grew moderately from $18.5B in 2021 to $21.1B in 2025. Net income experienced modest gains, reaching $2.23B in 2025 from $2.14B in 2021. Its gross margin of 33.7% and net margin of 10.6% indicate solid profitability but lower scale efficiency compared to IBM. EBIT expanded 21% in the latest year, though net margin slightly declined, suggesting margin pressure.
Margin Strength vs. Growth Momentum
IBM clearly outpaces Cognizant with superior margin profiles and faster net income growth, nearly doubling its bottom line over five years. IBM’s strong operating leverage and consistent margin improvement mark it as the more efficient and scalable business. Investors seeking robust profitability and accelerating earnings will find IBM’s profile more compelling than Cognizant’s steady but slower growth.
Financial Ratios Comparison
These vital ratios act as a diagnostic tool to expose the underlying fiscal health, valuation premiums, and capital efficiency of the companies compared below:
| Ratios | IBM (IBM) | Cognizant (CTSH) |
|---|---|---|
| ROE | 32.4% | 14.9% |
| ROIC | 8.6% | 12.3% |
| P/E | 26.1 | 17.9 |
| P/B | 8.46 | 2.66 |
| Current Ratio | 0.93 | 2.34 |
| Quick Ratio | 0.90 | 2.34 |
| D/E | 2.06 | 0.10 |
| Debt-to-Assets | 44.2% | 7.6% |
| Interest Coverage | 5.34 | 95.4 |
| Asset Turnover | 0.44 | 1.02 |
| Fixed Asset Turnover | 7.48 | 14.02 |
| Payout ratio | 59.0% | 27.4% |
| Dividend yield | 2.27% | 1.53% |
| Fiscal Year | 2025 | 2025 |
Efficiency & Valuation Duel: The Vital Signs
Ratios act as a company’s DNA, revealing hidden risks and operational excellence beyond surface-level financials.
International Business Machines Corporation
IBM demonstrates strong profitability with a 32.45% ROE and a 15.69% net margin, signaling robust shareholder value creation. However, its valuation appears stretched, with a high P/E of 26.07 and P/B of 8.46. The company supports shareholders with a 2.27% dividend yield, balancing returns amid moderate reinvestment in R&D.
Cognizant Technology Solutions Corporation
Cognizant shows moderate profitability, with a 14.85% ROE and 10.56% net margin, reflecting efficient operations. Its valuation is reasonable, marked by a P/E of 17.9 and P/B of 2.66, indicating fair market pricing. The firm offers a modest 1.53% dividend yield, complemented by strong capital allocation toward growth and maintaining a solid balance sheet.
Premium Valuation vs. Operational Safety
IBM sports higher profitability but at a premium valuation with notable leverage concerns. Cognizant delivers balanced financial health and favorable valuation metrics with less risk. Investors prioritizing income and stability might prefer IBM, while those seeking operational efficiency and lower risk may lean toward Cognizant.
Which one offers the Superior Shareholder Reward?
I find IBM delivers a stronger total shareholder reward in 2026. IBM offers a higher dividend yield near 2.3% with a payout ratio around 59%, reflecting solid free cash flow coverage. Its buyback program, while steady, complements dividends well. Cognizant yields just 1.5% with a conservative 27% payout ratio but shows robust free cash flow reinvestment potential. Cognizant’s aggressive debt reduction and moderate buybacks support sustainability but limit immediate income. Historically, IBM’s balanced dividend and buyback mix suits income-focused investors, while Cognizant favors growth investors. For long-term total return, IBM’s distribution model appears more attractive and sustainable now.
Comparative Score Analysis: The Strategic Profile
The radar chart reveals the fundamental DNA and trade-offs of both firms across key financial metrics:
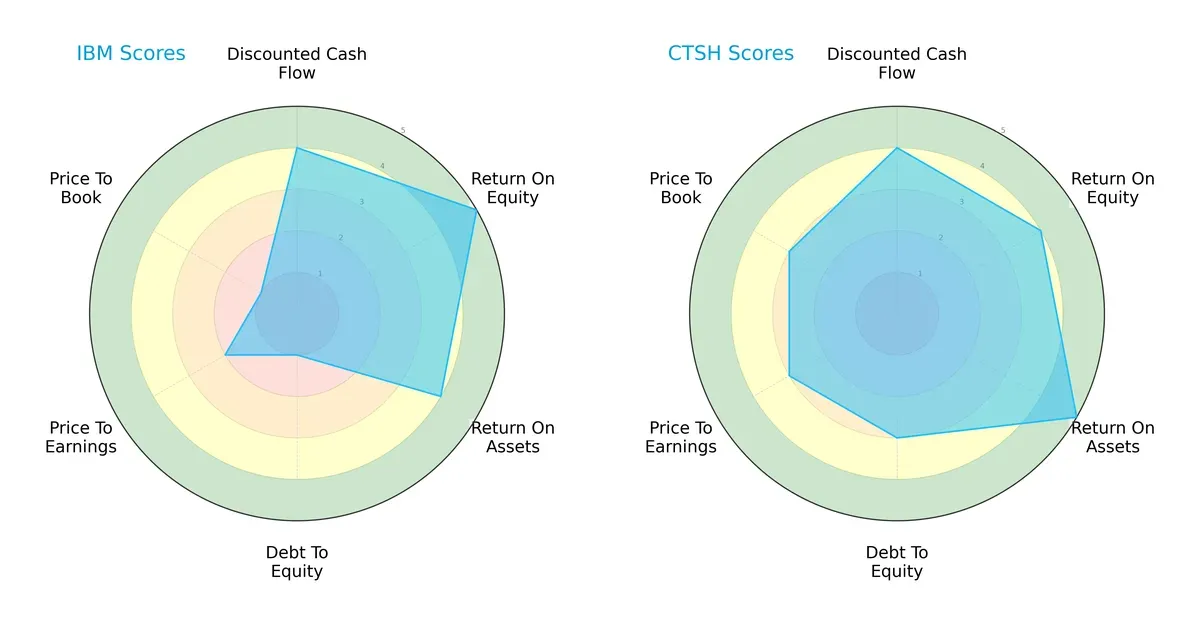
IBM shows strengths in return on equity (5) and return on assets (4), but suffers from a weak debt-to-equity score (1) and poor valuation metrics (PE 2, PB 1). Cognizant (CTSH) offers a more balanced profile, with solid scores in ROA (5), moderate debt leverage (3), and more favorable valuation scores (PE 3, PB 3). CTSH relies less on a single edge and presents a steadier financial footing.
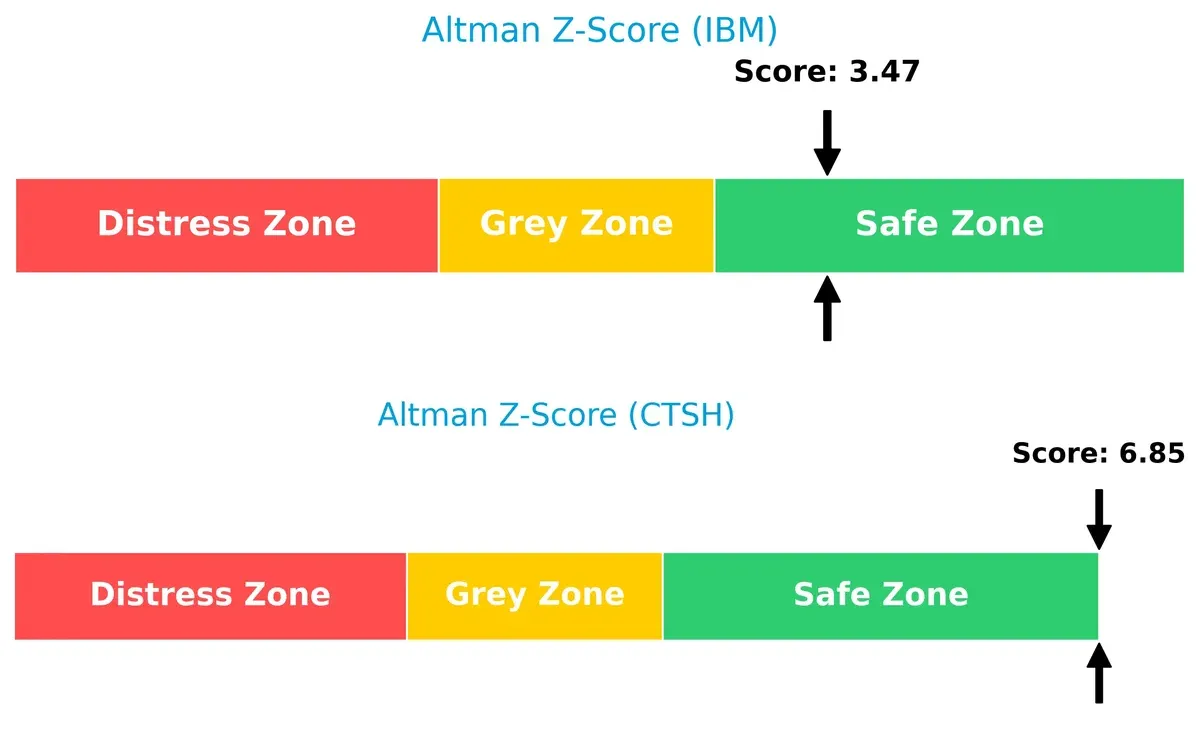
Bankruptcy Risk: Solvency Showdown
CTSH’s Altman Z-Score (6.85) significantly exceeds IBM’s (3.47), indicating a stronger buffer against financial distress in this cycle:
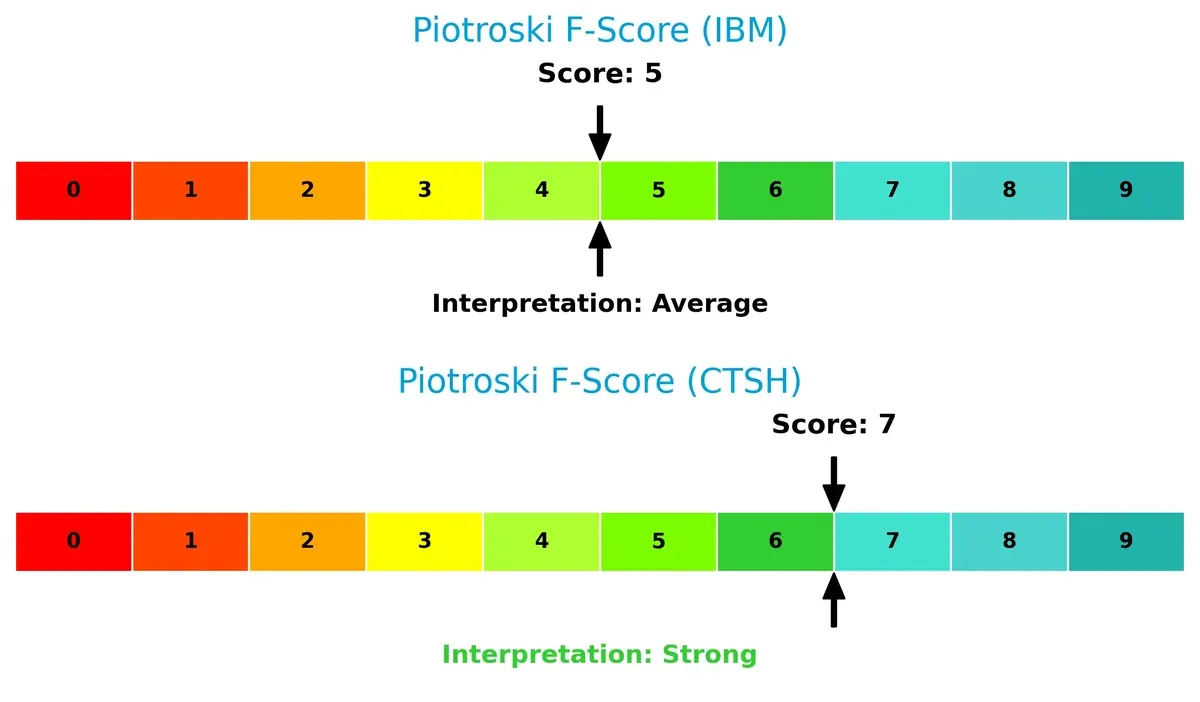
Financial Health: Quality of Operations
CTSH scores a 7 on the Piotroski F-Score, demonstrating robust internal financial health. IBM’s score of 5 signals average strength with some red flags in operational quality:
How are the two companies positioned?
This section dissects IBM and CTSH’s operational DNA by comparing their revenue distribution and internal strengths and weaknesses. The goal is to confront their economic moats to identify the most resilient and sustainable competitive advantage today.
Revenue Segmentation: The Strategic Mix
The following visual comparison dissects how International Business Machines Corporation and Cognizant Technology Solutions Corporation diversify their income streams and where their primary sector bets lie:
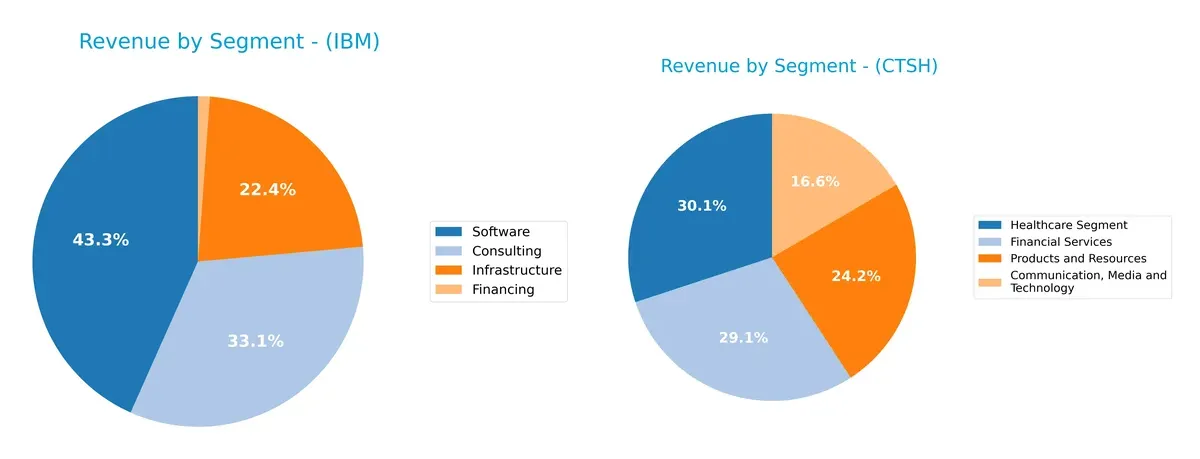
IBM’s revenue pivots around Software at $27B and Consulting at $20.7B, with Infrastructure adding $14B, revealing a balanced yet software-anchored portfolio. Cognizant’s top segment, Financial Services at $5.75B, dwarfs others but remains close to Healthcare and Products and Resources, showing moderate diversification. IBM’s spread signals ecosystem lock-in, reducing concentration risk. Cognizant’s reliance on Financial Services indicates exposure to sector cyclicality but benefits from specialized domain expertise.
Strengths and Weaknesses Comparison
This table compares the strengths and weaknesses of IBM and CTSH based on diversification, profitability, financials, innovation, global presence, and market share:
IBM Strengths
- Diverse revenue streams across Software, Consulting, Infrastructure, Financing
- Strong profitability with 15.7% net margin and 32.5% ROE
- Favorable interest coverage and dividend yield
- Significant global presence in Americas, EMEA, Asia Pacific
- Established market share in technology and consulting sectors
CTSH Strengths
- Favorable profitability metrics with 10.6% net margin and 12.3% ROIC
- Strong liquidity ratios (current and quick above 2.3)
- Low debt levels with 0.1 debt-to-equity ratio
- High asset turnover and fixed asset efficiency
- Global footprint focused on North America and Europe with diversified industry segments
IBM Weaknesses
- Unfavorable valuation multiples: high PE (26.1) and PB (8.5) ratios
- Weak liquidity with current ratio below 1
- Elevated debt-to-equity at 2.06, raising financial risk
- Low asset turnover (0.44) limits operational efficiency
CTSH Weaknesses
- Moderate ROE at 14.9% considered neutral
- Neutral valuation multiples with PE at 17.9 and PB at 2.7
- Geographic presence less diversified outside North America and Europe
- Dividend yield neutral at 1.53%, lower income return
IBM’s strengths lie in its broad product diversification and strong profitability metrics, but valuation concerns and liquidity risks temper the outlook. CTSH shows financial prudence with strong liquidity and low leverage, supporting operational efficiency, though growth metrics like ROE and geographic diversity appear less robust. Both companies must balance profitability and risk management within their strategic frameworks.
The Moat Duel: Analyzing Competitive Defensibility
A structural moat is the only true shield protecting long-term profits from relentless competition erosion. Let’s dissect the competitive advantages of two IT services giants:
International Business Machines Corporation (IBM): Hybrid Cloud & Intangible Asset Moat
IBM’s moat hinges on its hybrid cloud platform and deep software portfolio, notably Red Hat, which drives high ROIC and stable 15.7% net margins. I see its growing ROIC trend as a sign of durable value creation. New AI and automation offerings could further fortify this moat in 2026.
Cognizant Technology Solutions Corporation (CTSH): Cost Efficiency & Scale Moat
Cognizant leverages cost advantage and scale in outsourcing and consulting, reflected in solid EBIT margins near 17%. Unlike IBM, CTSH shows a declining ROIC trend, signaling pressure on profitability. Expansion into AI-driven digital services offers growth potential but risks margin compression.
Moat Strength Showdown: Intangible Assets vs. Cost Leadership
IBM’s intangible asset moat delivers deeper, more sustainable value with a rising ROIC above WACC by 2.2%. Cognizant’s cost-based moat remains intact but weaker, with ROIC above WACC by 4.3% yet declining. IBM is better positioned to defend market share amid technology shifts in 2026.
Which stock offers better returns?
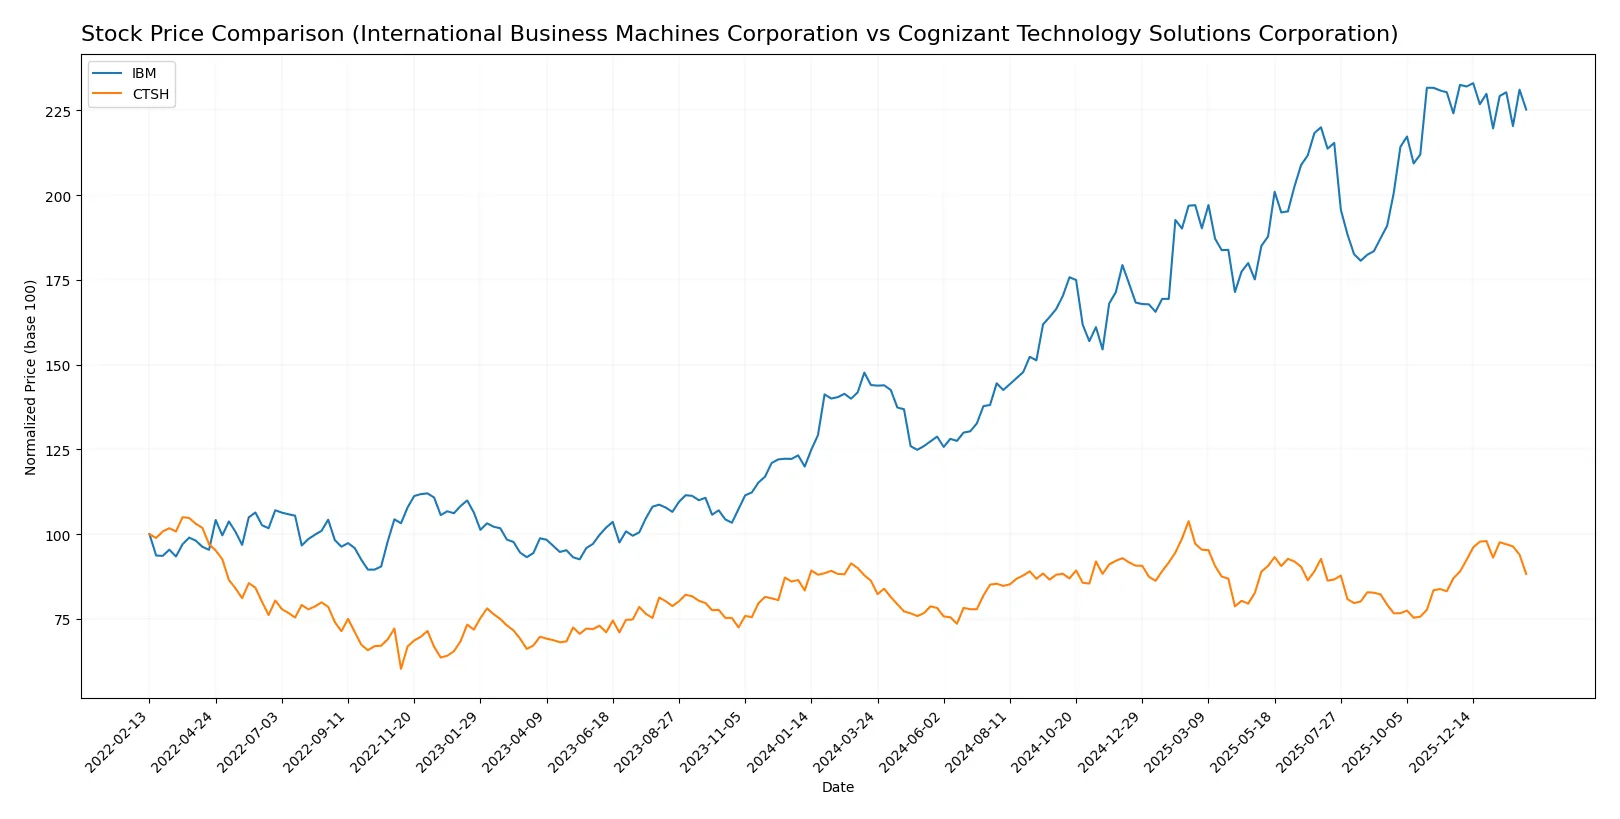
Over the past year, IBM’s stock surged 56.45%, showing a strong bullish trend with decelerating momentum. CTSH rose 2.32%, also bullish but with accelerating momentum.
Trend Comparison
IBM’s stock gained 56.45% over 12 months, marking a bullish trend with high volatility (std dev 43.58) and recent deceleration in price gains. The highest price reached 309.24, the lowest 165.71.
CTSH’s stock increased 2.32% over the same period, maintaining a bullish trend with moderate volatility (std dev 5.77) and accelerating price gains. The highest price hit 90.7, the lowest 64.26.
IBM outperformed CTSH substantially with a 56.45% rise versus CTSH’s 2.32%, delivering the highest market return in the analyzed timeframe.
Target Prices
Analysts present a moderately bullish consensus for both IBM and Cognizant, signaling potential upside from current prices.
| Company | Target Low | Target High | Consensus |
|---|---|---|---|
| International Business Machines Corporation (IBM) | 304 | 380 | 349.5 |
| Cognizant Technology Solutions Corporation (CTSH) | 82 | 107 | 93.2 |
IBM’s consensus target of 349.5 implies a 17% upside from its current 299 price, suggesting confidence in its hybrid cloud and AI segments. Cognizant’s target consensus of 93.2 points to a 21% potential gain, reflecting optimism in its digital transformation services.

Don’t Let Luck Decide Your Entry Point
Optimize your entry points with our advanced ProRealTime indicators. You’ll get efficient buy signals with precise price targets for maximum performance. Start outperforming now!
How do institutions grade them?
International Business Machines Corporation Grades
Here are the latest grades from reputable financial institutions for IBM:
| Grading Company | Action | New Grade | Date |
|---|---|---|---|
| UBS | Maintain | Sell | 2026-01-29 |
| Wedbush | Maintain | Outperform | 2026-01-29 |
| JP Morgan | Maintain | Neutral | 2026-01-29 |
| Stifel | Maintain | Buy | 2026-01-29 |
| Evercore ISI Group | Maintain | Outperform | 2026-01-29 |
| RBC Capital | Maintain | Outperform | 2026-01-29 |
| Jefferies | Maintain | Buy | 2026-01-29 |
| JP Morgan | Maintain | Neutral | 2026-01-21 |
| Evercore ISI Group | Maintain | Outperform | 2026-01-20 |
| B of A Securities | Maintain | Buy | 2026-01-13 |
Cognizant Technology Solutions Corporation Grades
Here are the latest grades from reputable financial institutions for CTSH:
| Grading Company | Action | New Grade | Date |
|---|---|---|---|
| TD Cowen | Maintain | Hold | 2026-02-05 |
| Morgan Stanley | Maintain | Equal Weight | 2026-02-05 |
| RBC Capital | Maintain | Sector Perform | 2026-02-05 |
| Guggenheim | Maintain | Buy | 2026-01-28 |
| Citigroup | Maintain | Neutral | 2026-01-22 |
| Wells Fargo | Maintain | Overweight | 2026-01-14 |
| TD Cowen | Maintain | Hold | 2026-01-09 |
| UBS | Maintain | Neutral | 2025-12-08 |
| William Blair | Upgrade | Outperform | 2025-11-21 |
| UBS | Maintain | Neutral | 2025-10-30 |
Which company has the best grades?
IBM consistently receives higher ratings, including multiple Buy and Outperform grades from top firms. CTSH shows a more mixed outlook, with Hold and Neutral prevailing. This variance may influence investors seeking stronger institutional conviction.
Risks specific to each company
The following categories identify the critical pressure points and systemic threats facing both firms in the 2026 market environment:
1. Market & Competition
International Business Machines Corporation
- Faces intense competition in hybrid cloud and AI software from tech giants; market share pressure persists.
Cognizant Technology Solutions Corporation
- Competes in IT consulting and outsourcing with growing rivals; must innovate to maintain client base.
2. Capital Structure & Debt
International Business Machines Corporation
- High debt-to-equity ratio (2.06) signals elevated financial risk and leverage concerns.
Cognizant Technology Solutions Corporation
- Low debt-to-equity ratio (0.10) indicates a strong balance sheet with limited financial risk.
3. Stock Volatility
International Business Machines Corporation
- Beta of 0.69 suggests lower volatility, offering relative stability amid market swings.
Cognizant Technology Solutions Corporation
- Beta near 0.96 implies higher sensitivity to market fluctuations, increasing risk for investors.
4. Regulatory & Legal
International Business Machines Corporation
- Subject to complex IT service regulations and data privacy laws; compliance costs could rise.
Cognizant Technology Solutions Corporation
- Faces regulatory scrutiny in healthcare and financial sectors; legal risks from data handling are notable.
5. Supply Chain & Operations
International Business Machines Corporation
- Relies on global hardware supply chains vulnerable to disruption and geopolitical tensions.
Cognizant Technology Solutions Corporation
- Operations depend on international delivery of consulting services; less exposed to physical supply chain risks.
6. ESG & Climate Transition
International Business Machines Corporation
- Under pressure to reduce carbon footprint in hardware production and data centers.
Cognizant Technology Solutions Corporation
- Faces challenges integrating ESG standards in service delivery and global workforce management.
7. Geopolitical Exposure
International Business Machines Corporation
- Global footprint exposes it to trade tensions and regulatory shifts in multiple jurisdictions.
Cognizant Technology Solutions Corporation
- High international presence increases vulnerability to geopolitical instability, especially in emerging markets.
Which company shows a better risk-adjusted profile?
IBM’s most impactful risk is its heavy debt load, which raises financial vulnerability despite strong operational segments. Cognizant’s key risk lies in competitive pressures and market volatility. Cognizant’s superior capital structure and higher Altman Z-score suggest a more resilient risk-adjusted profile. Recent strong liquidity ratios for Cognizant reinforce its financial stability advantage over IBM.
Final Verdict: Which stock to choose?
International Business Machines Corporation (IBM) wields unmatched brand legacy and a fortress-like moat, evidenced by its sustainable ROIC above WACC and robust income growth. Its efficiency in capital allocation stands out, but a low current ratio signals a liquidity point of vigilance. It suits portfolios targeting long-term value with moderate growth appetite.
Cognizant Technology Solutions Corporation (CTSH) commands a strategic moat through operational agility and strong balance sheet health. Its consistent value creation with a favorable ROIC and low leverage offers better financial safety compared to IBM. This stock aligns well with investors seeking Growth at a Reasonable Price (GARP) profiles emphasizing stability and steady returns.
If you prioritize resilient economic moats and strong historical earnings growth, IBM is the compelling choice due to its proven value creation and income expansion. However, if you seek a safer balance sheet with efficient asset utilization and lower financial risk, CTSH offers better stability and a more attractive valuation profile. Both present analytical scenarios for distinct investor strategies.
Disclaimer: Investment carries a risk of loss of initial capital. The past performance is not a reliable indicator of future results. Be sure to understand risks before making an investment decision.
Go Further
I encourage you to read the complete analyses of International Business Machines Corporation and Cognizant Technology Solutions Corporation to enhance your investment decisions: