Home > Comparison > Technology > CTSH vs GLOB
The competitive dynamic between Cognizant Technology Solutions Corporation and Globant S.A. shapes the evolution of the global technology services sector. Cognizant operates as a capital-intensive IT services giant with broad consulting and outsourcing capabilities. In contrast, Globant delivers high-margin digital transformation and agile software solutions with a leaner global footprint. This analysis evaluates which model offers superior risk-adjusted returns amid shifting industry demands, guiding investors toward the optimal portfolio exposure in technology services.
Table of contents
Companies Overview
Cognizant and Globant stand as key innovators in the evolving global technology services arena.
Cognizant Technology Solutions Corporation: Global IT Services Powerhouse
Cognizant dominates as a professional services firm delivering consulting and technology outsourcing across financial, healthcare, and media sectors. Its revenue engine hinges on digital transformation, AI, and robotic process automation services. In 2026, it focuses sharply on omni-channel customer experiences and operational efficiencies, driving growth through integrated solutions for complex industries.
Globant S.A.: Digital Reinvention Specialist
Globant excels as a technology services company shaping the future with digital innovation and agile delivery. It monetizes through platforms spanning e-commerce, cloud transformation, and cutting-edge AI-driven services. The company’s 2026 strategy emphasizes augmented revenue management and cloud-native architecture, leveraging data insights and immersive technologies to redefine client digital ecosystems worldwide.
Strategic Collision: Similarities & Divergences
Both firms prioritize digital transformation but diverge in approach: Cognizant favors integrated outsourcing solutions while Globant pushes a platform-driven, agile innovation model. They compete chiefly in delivering AI and cloud services to enterprises seeking competitive edge. This contrast defines their distinct investment appeal—Cognizant offers scale and breadth, Globant bets on nimble, high-growth specialization.
Income Statement Comparison
This data dissects the core profitability and scalability of both corporate engines to reveal who dominates the bottom line:

| Metric | Cognizant Technology Solutions Corporation (CTSH) | Globant S.A. (GLOB) |
|---|---|---|
| Revenue | 21.1B | 2.42B |
| Cost of Revenue | 14.0B | 1.55B |
| Operating Expenses | 3.59B | 638M |
| Gross Profit | 7.12B | 863M |
| EBITDA | 4.17B | 417M |
| EBIT | 3.62B | 254M |
| Interest Expense | 37M | 29M |
| Net Income | 2.23B | 166M |
| EPS | 4.56 | 3.82 |
| Fiscal Year | 2025 | 2024 |
Income Statement Analysis: The Bottom-Line Duel
This income statement comparison reveals which company runs a more efficient and profitable corporate engine based on recent financial trends.
Cognizant Technology Solutions Corporation Analysis
Cognizant’s revenue grew steadily from $18.5B in 2021 to $21.1B in 2025, with net income rising moderately to $2.23B. Its gross margin holds firm at 33.7%, and net margin remains healthy at 10.6%. The 2025 year showed notable EBIT growth of 21%, signaling improving operational efficiency despite a slight net margin dip.
Globant S.A. Analysis
Globant exhibits rapid revenue expansion from $814M in 2020 to $2.42B in 2024, alongside net income growth to $166M. Gross margin stands stronger at 35.7%, though net margin is lower at 6.9%. The latest year evidences robust top-line momentum and EBIT growth of 16.6%, highlighting dynamic scaling despite a marginal net margin contraction.
Margin Strength vs. Growth Velocity
Cognizant delivers solid profitability with superior net margins and consistent earnings, reflecting mature operational efficiency. Globant impresses with aggressive revenue and net income growth, leveraging higher gross margins but lower net profitability. Investors seeking stability may prefer Cognizant’s steady margins, while those favoring high-growth profiles might lean toward Globant’s expanding scale.
Financial Ratios Comparison
These vital ratios act as a diagnostic tool to expose the underlying fiscal health, valuation premiums, and capital efficiency of the companies compared below:
| Ratios | Cognizant Technology Solutions Corporation (CTSH) | Globant S.A. (GLOB) |
|---|---|---|
| ROE | 14.85% | 8.44% |
| ROIC | 12.31% | 6.82% |
| P/E | 17.90 | 57.64 |
| P/B | 2.66 | 4.86 |
| Current Ratio | 2.34 | 1.54 |
| Quick Ratio | 2.34 | 1.54 |
| D/E | 0.10 | 0.21 |
| Debt-to-Assets | 7.61% | 12.95% |
| Interest Coverage | 95.38 | 7.87 |
| Asset Turnover | 1.02 | 0.76 |
| Fixed Asset Turnover | 14.02 | 8.70 |
| Payout ratio | 27.35% | 0% |
| Dividend yield | 1.53% | 0% |
| Fiscal Year | 2025 | 2024 |
Efficiency & Valuation Duel: The Vital Signs
Ratios act as the company’s DNA, revealing hidden risks and operational excellence that guide investor decisions beyond surface-level metrics.
Cognizant Technology Solutions Corporation
Cognizant shows solid core profitability with a 14.85% ROE and a favorable 10.56% net margin. Its P/E of 17.9 signals a fairly valued stock, neither cheap nor stretched. The company maintains a healthy 2.34 current ratio and returns 1.53% dividend yield, highlighting balanced capital allocation between shareholder returns and operational stability.
Globant S.A.
Globant posts a weaker 8.44% ROE and modest 6.86% net margin, reflecting pressured profitability. The stock trades at a steep P/E of 57.64, indicating stretched valuation. Despite favorable liquidity, it pays no dividends, relying on reinvestment for growth. This profile suggests higher risk with less immediate shareholder reward and efficiency challenges.
Moderate Safety Meets Premium Valuation
Cognizant offers a better balance of operational efficiency and valuation discipline, with more favorable profitability and steady dividends. Globant’s premium valuation and lower returns expose investors to greater risk, suitable only for growth-focused portfolios tolerant of elevated multiples.
Which one offers the Superior Shareholder Reward?
I compare Cognizant Technology Solutions Corporation (CTSH) and Globant S.A. (GLOB) on distribution philosophies and shareholder returns. CTSH delivers a consistent dividend yield around 1.5% with payout ratios near 27%, backed by strong free cash flow coverage (~0.9 FCF/OCF ratio). It also maintains moderate buybacks, adding to total returns. GLOB pays no dividends but reinvests heavily in growth, evident from high R&D and capex spending. Its free cash flow coverage is more volatile but generally lower, and buybacks are minimal or absent. CTSH’s dividend plus buybacks offer a more sustainable, balanced shareholder reward in 2026. GLOB’s strategy bets on capital appreciation but carries higher valuation multiples (P/E ~58 vs. CTSH ~18), implying greater risk. I conclude CTSH provides the superior total return profile for income-focused and risk-conscious investors.
Comparative Score Analysis: The Strategic Profile
The radar chart reveals the fundamental DNA and trade-offs of Cognizant Technology Solutions Corporation and Globant S.A., highlighting their distinct financial strengths and valuation approaches:

Cognizant shows a balanced profile with strong ROE (4) and ROA (5) scores, indicating efficient asset use and profitability. Globant leverages a superior DCF score (5), signaling strong future cash flow expectations but lags in profitability metrics (ROE 3, ROA 3). Valuation scores favor Globant’s price-to-book (4) but penalize its price-to-earnings (2), reflecting market skepticism. Cognizant’s moderate debt-to-equity and valuation scores (3 each) suggest steadier financial risk management.
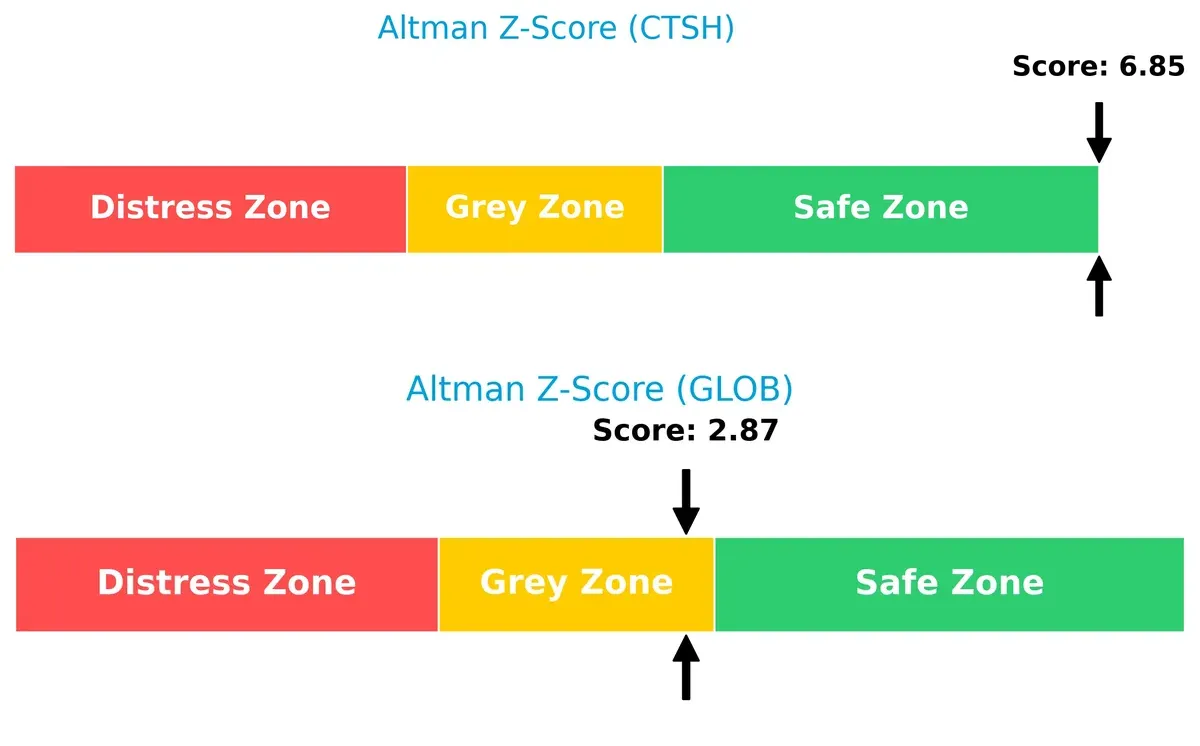
Bankruptcy Risk: Solvency Showdown
Cognizant’s Altman Z-Score of 6.85 places it firmly in the safe zone, signaling robust solvency. Globant’s 2.87 situates it in the grey zone, indicating moderate bankruptcy risk in this cycle:
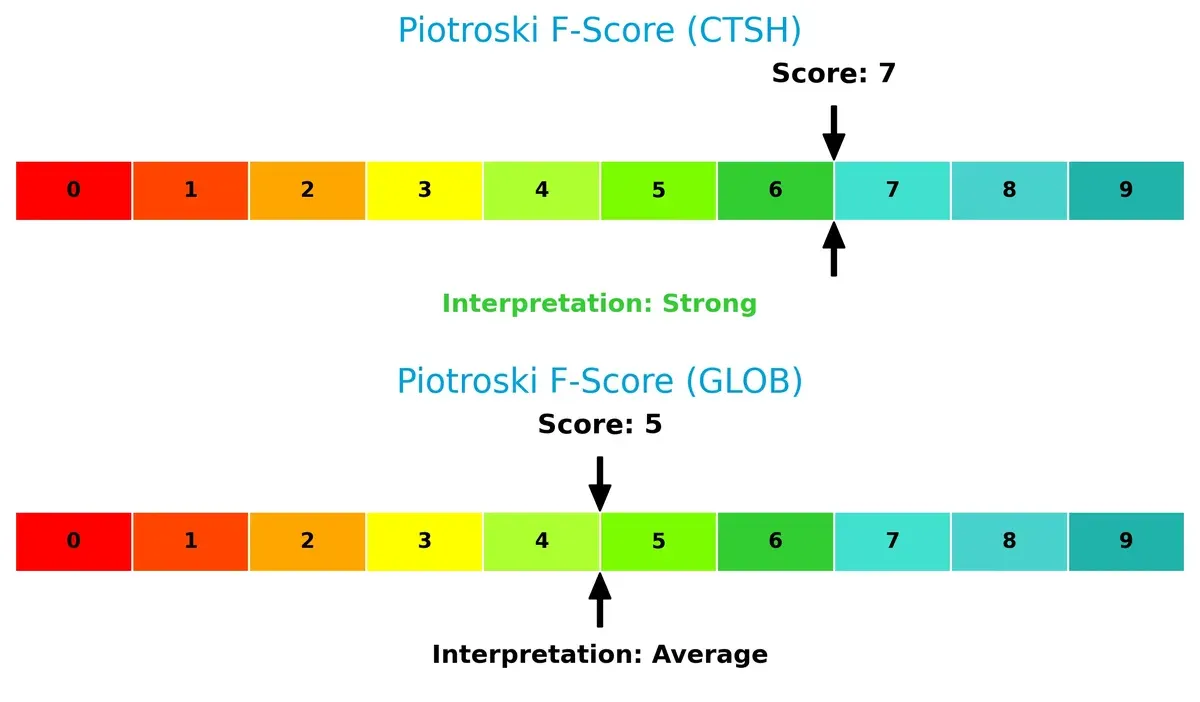
Financial Health: Quality of Operations
Cognizant’s Piotroski F-Score of 7 indicates strong financial health with solid internal metrics. Globant’s score of 5 is average, suggesting potential red flags or less operational efficiency compared to Cognizant:
How are the two companies positioned?
This section dissects the operational DNA of Cognizant and Globant by comparing their revenue distribution and internal dynamics. The goal is to confront their economic moats to reveal which model ensures the most durable competitive advantage today.
Revenue Segmentation: The Strategic Mix
This visual comparison dissects how Cognizant Technology Solutions and Globant diversify their income streams and where their primary sector bets lie:

Cognizant Technology Solutions displays a well-balanced revenue mix, with Healthcare at $5.9B and Financial Services at $5.7B anchoring its portfolio. Communication, Media and Technology, plus Products and Resources, add strong diversification. Globant lacks available segmentation data, preventing direct comparison. Cognizant’s spread reduces concentration risk and signals strategic bets on stable, high-demand sectors like healthcare and finance, reinforcing its infrastructure dominance.
Strengths and Weaknesses Comparison
This table compares the Strengths and Weaknesses of Cognizant Technology Solutions Corporation (CTSH) and Globant S.A. (GLOB):
CTSH Strengths
- Diversified revenue across media, finance, healthcare, and products segments
- Strong profitability with 10.56% net margin and 12.31% ROIC
- Solid financial health with high current and quick ratios (~2.34)
- Low debt levels with favorable debt-to-assets and interest coverage
- Extensive global presence, especially in North America and Europe
- High asset turnover ratios indicating operational efficiency
GLOB Strengths
- Geographic diversification across Americas, Europe, and Asia
- Favorable liquidity ratios above 1.5
- Moderate debt with favorable interest coverage
- Growing presence in Latin America and North America
- Favorable fixed asset turnover indicates asset utilization
- Innovation-driven business model (implied by global reach and growth)
CTSH Weaknesses
- Neutral ROE at 14.85%, slightly below top industry peers
- Neutral valuation multiples (PE 17.9, PB 2.66) may limit growth appeal
- Dividend yield neutral, possibly limiting income focus
- Heavy reliance on North America and Europe markets
GLOB Weaknesses
- Lower profitability with 6.86% net margin and unfavorable ROE at 8.44%
- High valuation multiples (PE 57.64, PB 4.86) may pressure returns
- No dividend yield, reducing income attractiveness
- Lower asset turnover and operational efficiency compared to CTSH
- Higher debt-to-assets ratio (12.95%) than CTSH
Overall, CTSH demonstrates robust financial health, broad diversification, and strong operational efficiency, positioning it as a stable player in its sector. GLOB shows geographic diversification and some operational strengths but faces challenges with profitability, higher valuations, and leverage. These factors shape each company’s strategic focus on balancing growth and financial discipline.
The Moat Duel: Analyzing Competitive Defensibility
Structural moats safeguard long-term profits by fending off competitors, making them the cornerstone of durable corporate success:
Cognizant Technology Solutions Corporation: Intangible Assets Moat
Cognizant leverages strong intangible assets like proprietary technology and client relationships, reflected in a stable 17% EBIT margin. Its declining ROIC trend signals pressure, yet expansion into AI and automation services could reinforce its moat in 2026.
Globant S.A.: Growth-Driven Innovation Moat
Globant’s moat centers on rapid innovation and agile digital reinvention studios, fueling a 15% revenue growth. Unlike Cognizant, it currently sheds value (negative ROIC vs. WACC) but shows a robust ROIC growth trend, indicating improving capital efficiency and future moat strengthening.
Intangible Assets vs. Innovation Velocity
Cognizant’s wider moat stems from consistent value creation and margin stability, despite waning ROIC. Globant’s deeper moat lies in accelerating profitability and innovation momentum. Cognizant remains better positioned to defend market share today, but Globant’s improving ROIC trend signals potential disruption ahead.
Which stock offers better returns?
The past year reveals a sharp divergence: Cognizant Technology Solutions posts steady gains with accelerating momentum, while Globant plunges dramatically despite volatile swings.
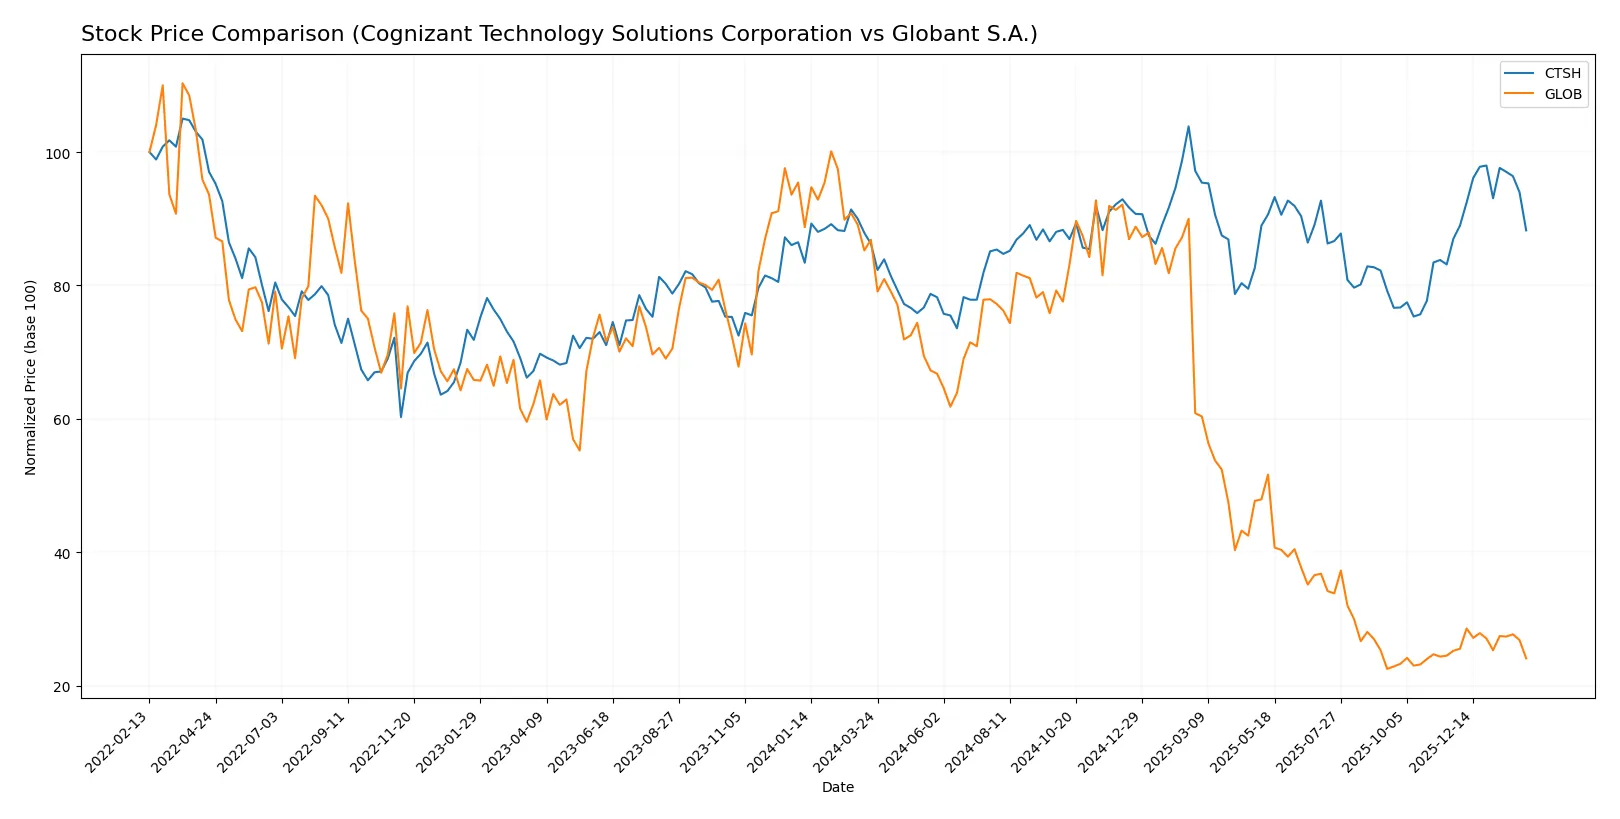
Trend Comparison
Cognizant Technology Solutions shows a bullish trend over 12 months with a 2.32% price increase, accelerating momentum, and a moderate 5.77 volatility. The stock peaked at 90.7 and bottomed at 64.26.
Globant experiences a steep bearish trend, sliding 72.28% in one year, with accelerating decline and extreme volatility of 61.45. Its price ranged from a high of 231.36 to a low of 56.11.
Cognizant outperforms Globant over the past year, delivering positive returns versus Globant’s sharp losses, marking it the stronger market performer in this comparison.
Target Prices
Analysts set a clear bullish consensus for both Cognizant Technology Solutions and Globant, projecting notable upside potential.
| Company | Target Low | Target High | Consensus |
|---|---|---|---|
| Cognizant Technology Solutions Corporation | 82 | 107 | 93.2 |
| Globant S.A. | 68 | 80 | 73.75 |
The consensus targets for Cognizant and Globant exceed their current prices by 20% and 23%, respectively. This signals analysts expect growth above current market valuations.

Don’t Let Luck Decide Your Entry Point
Optimize your entry points with our advanced ProRealTime indicators. You’ll get efficient buy signals with precise price targets for maximum performance. Start outperforming now!
How do institutions grade them?
Cognizant Technology Solutions Corporation Grades
The latest grades from major financial institutions for Cognizant are summarized below:
| Grading Company | Action | New Grade | Date |
|---|---|---|---|
| TD Cowen | Maintain | Hold | 2026-02-05 |
| Morgan Stanley | Maintain | Equal Weight | 2026-02-05 |
| RBC Capital | Maintain | Sector Perform | 2026-02-05 |
| Guggenheim | Maintain | Buy | 2026-01-28 |
| Citigroup | Maintain | Neutral | 2026-01-22 |
| Wells Fargo | Maintain | Overweight | 2026-01-14 |
| UBS | Maintain | Neutral | 2025-12-08 |
| William Blair | Upgrade | Outperform | 2025-11-21 |
Globant S.A. Grades
The latest grades from major financial institutions for Globant are summarized below:
| Grading Company | Action | New Grade | Date |
|---|---|---|---|
| Wells Fargo | Maintain | Equal Weight | 2026-01-14 |
| Jefferies | Downgrade | Hold | 2025-11-20 |
| UBS | Maintain | Neutral | 2025-11-18 |
| Canaccord Genuity | Maintain | Hold | 2025-11-14 |
| JP Morgan | Maintain | Neutral | 2025-11-14 |
| Needham | Maintain | Buy | 2025-11-14 |
| Goldman Sachs | Maintain | Neutral | 2025-10-09 |
Which company has the best grades?
Cognizant consistently receives higher ratings, including upgrades to Outperform and Buy, compared to Globant’s Hold and Neutral marks. This suggests stronger institutional confidence in Cognizant’s performance and outlook, potentially influencing investor sentiment and portfolio decisions.
Risks specific to each company
The following categories highlight critical pressure points and systemic threats facing Cognizant Technology Solutions Corporation and Globant S.A. in the 2026 market environment:
1. Market & Competition
Cognizant Technology Solutions Corporation
- Large market cap supports scale advantage; faces intense competition in IT services from established players.
Globant S.A.
- Smaller market cap limits scale; competes in niche digital transformation with rising new entrants.
2. Capital Structure & Debt
Cognizant Technology Solutions Corporation
- Low debt-to-equity (0.1) and strong interest coverage (97.9) signal robust capital structure.
Globant S.A.
- Moderate debt-to-equity (0.21) with adequate interest coverage (8.87) but higher leverage risk.
3. Stock Volatility
Cognizant Technology Solutions Corporation
- Beta near 1 (0.957) implies stock moves roughly with market; moderate volatility.
Globant S.A.
- Higher beta (1.173) indicates greater volatility and risk relative to market benchmarks.
4. Regulatory & Legal
Cognizant Technology Solutions Corporation
- US-based regulatory environment with potential compliance costs but stable legal framework.
Globant S.A.
- Luxembourg base exposes to complex EU regulations, including data privacy and digital services laws.
5. Supply Chain & Operations
Cognizant Technology Solutions Corporation
- Extensive global operations with risks of operational disruption but diversified client base.
Globant S.A.
- Smaller scale with less operational diversification, potentially sensitive to supply chain shocks.
6. ESG & Climate Transition
Cognizant Technology Solutions Corporation
- Larger firm likely faces greater ESG scrutiny; must invest in sustainable practices to maintain reputation.
Globant S.A.
- Growing emphasis on digital sustainability solutions; ESG integration in services offers growth but also execution risk.
7. Geopolitical Exposure
Cognizant Technology Solutions Corporation
- US-centric with exposure to trade tensions, but diversified international footprint mitigates risk.
Globant S.A.
- Luxembourg domicile provides EU market access but exposes firm to geopolitical instability in Europe.
Which company shows a better risk-adjusted profile?
Cognizant’s strongest vulnerability lies in market competition amid a mature sector but benefits from a rock-solid capital structure and lower volatility. Globant’s biggest risk is elevated stock volatility compounded by a higher P/E and debt ratio, despite growth potential. Cognizant’s superior Altman Z-score (6.85 safe zone) versus Globant’s (2.87 grey zone) underscores its more stable financial footing. The striking contrast in debt levels and volatility defines Cognizant as the safer risk-adjusted choice today.
Final Verdict: Which stock to choose?
Cognizant Technology Solutions Corporation’s superpower lies in its robust capital efficiency and consistent value creation. It manages to convert invested capital into solid returns despite a slight downward ROIC trend, signaling a need for vigilance on profitability sustainability. This stock suits portfolios aiming for steady, quality growth with moderate risk tolerance.
Globant S.A. stands out with its strategic moat in digital transformation services, showing strong revenue and earnings growth fueled by innovation. However, its high valuation and weaker profitability metrics introduce volatility and risk. It fits investors seeking growth at a reasonable price but who can tolerate less stability compared to Cognizant.
If you prioritize consistent value creation and financial resilience, Cognizant outshines due to its favorable capital returns and strong balance sheet. However, if you seek dynamic growth and are comfortable with higher valuation risk, Globant offers superior top-line momentum and innovation potential. Each appeals to distinct investor profiles balancing growth and stability differently.
Disclaimer: Investment carries a risk of loss of initial capital. The past performance is not a reliable indicator of future results. Be sure to understand risks before making an investment decision.
Go Further
I encourage you to read the complete analyses of Cognizant Technology Solutions Corporation and Globant S.A. to enhance your investment decisions: