Home > Comparison > Technology > CTSH vs G
The strategic rivalry between Cognizant Technology Solutions Corporation and Genpact Limited defines the trajectory of the Information Technology Services sector. Cognizant, a diversified technology consulting and outsourcing powerhouse, contrasts with Genpact’s focused business process outsourcing and IT service model. This face-off highlights a battle between broad digital transformation expertise and specialized process-driven efficiency. This analysis will reveal which corporate strategy delivers superior risk-adjusted returns for a balanced portfolio in 2026.

Table of contents
Companies Overview
Cognizant and Genpact stand as pivotal forces in the global IT services market.
Cognizant Technology Solutions Corporation: Global IT Services Powerhouse
Cognizant leads in professional services offering consulting, technology, and outsourcing across financial services, healthcare, and communications. Its revenue hinges on digital transformation solutions like AI, robotic process automation, and analytics. In 2026, Cognizant sharpens its focus on customer experience enhancement and operational improvements in healthcare and digital payments.
Genpact Limited: Business Process and IT Services Specialist
Genpact operates as a business process outsourcing and IT services firm serving banking, consumer goods, and manufacturing sectors. It derives revenue from finance and accounting services, ESG consulting, and digital transformation offerings. In 2026, Genpact emphasizes finance advisory and ESG services alongside robust digital and analytics-driven transformation.
Strategic Collision: Similarities & Divergences
Both companies emphasize digital transformation but differ in approach: Cognizant integrates broad consulting and technology services while Genpact focuses on finance-related processes and ESG. Their primary battleground lies in winning enterprise clients demanding seamless automation and analytics. Cognizant’s scale and diversified segments contrast with Genpact’s specialized process expertise, defining unique investment profiles with distinct risk-return dynamics.
Income Statement Comparison
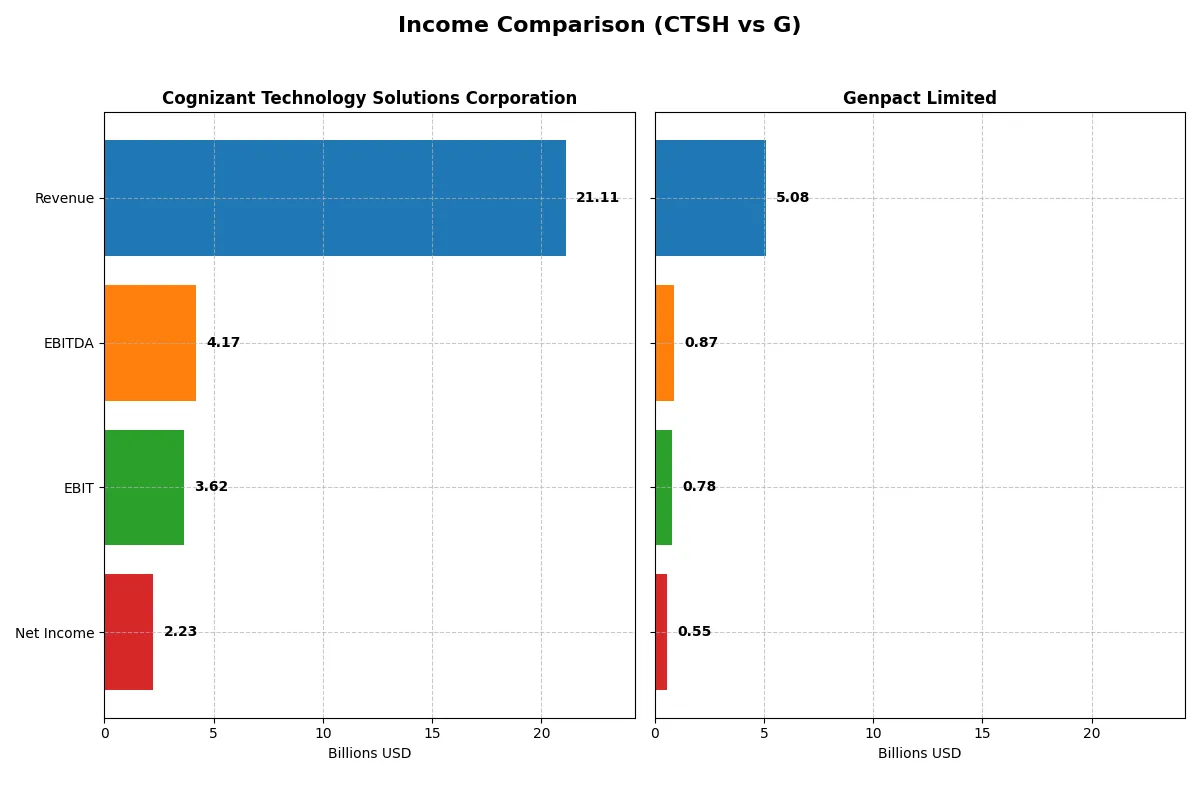
This data dissects the core profitability and scalability of both corporate engines to reveal who dominates the bottom line:
| Metric | Cognizant Technology Solutions Corporation (CTSH) | Genpact Limited (G) |
|---|---|---|
| Revenue | 21.1B | 5.1B |
| Cost of Revenue | 14.0B | 3.2B |
| Operating Expenses | 3.6B | 1.0B |
| Gross Profit | 7.1B | 1.8B |
| EBITDA | 4.2B | 875M |
| EBIT | 3.6B | 780M |
| Interest Expense | 37M | 50M |
| Net Income | 2.2B | 552M |
| EPS | 4.56 | 3.18 |
| Fiscal Year | 2025 | 2025 |
Income Statement Analysis: The Bottom-Line Duel
This income statement comparison reveals the true operational efficiency and profitability momentum of two major players in the technology services sector.
Cognizant Technology Solutions Corporation Analysis
Cognizant’s revenue grew steadily from $18.5B in 2021 to $21.1B in 2025, reflecting a 14% rise over five years. Gross margin remains solid at 33.7%, though net margin declined slightly to 10.6%. Despite a 21% surge in EBIT last year, net income was nearly flat at $2.23B, highlighting margin pressure despite revenue growth.
Genpact Limited Analysis
Genpact’s revenue expanded more sharply, rising 26% from $4.0B in 2021 to nearly $5.1B in 2025. Its gross margin of 36% and net margin of 10.9% both improved, supporting a strong 50% net income increase to $552M. EBIT growth moderated to 3%, but EPS jumped nearly 10% last year, reflecting enhanced bottom-line efficiency.
Margin Resilience vs. Growth Momentum
Cognizant delivers superior scale and a robust EBIT margin of 17.2%, but struggles with net margin contraction and modest net income growth. Genpact, while smaller, posts faster revenue, net income, and EPS growth alongside expanding margins. For investors, Cognizant offers stability and scale, whereas Genpact presents a higher-growth profile with improving profitability.
Financial Ratios Comparison
These vital ratios act as a diagnostic tool to expose the underlying fiscal health, valuation premiums, and capital efficiency of the companies:
| Ratios | Cognizant Technology Solutions Corporation (CTSH) | Genpact Limited (G) |
|---|---|---|
| ROE | 14.85% | 21.67% |
| ROIC | 12.31% | 12.32% |
| P/E | 17.90 | 14.72 |
| P/B | 2.66 | 3.19 |
| Current Ratio | 2.34 | 1.66 |
| Quick Ratio | 2.34 | 1.66 |
| D/E (Debt-to-Equity) | 0.10 | 0.23 |
| Debt-to-Assets | 7.61% | 9.91% |
| Interest Coverage | 95.38 | 15.32 |
| Asset Turnover | 1.02 | 0.87 |
| Fixed Asset Turnover | 14.02 | 13.65 |
| Payout Ratio | 27.35% | 21.31% |
| Dividend Yield | 1.53% | 1.45% |
| Fiscal Year | 2025 | 2025 |
Efficiency & Valuation Duel: The Vital Signs
Financial ratios act as a company’s DNA, uncovering hidden operational strengths and risks that drive investment decisions.
Cognizant Technology Solutions Corporation
Cognizant shows solid profitability with a 14.85% ROE and a favorable 10.56% net margin, indicating operational efficiency. Its P/E of 17.9 suggests a fairly valued stock, neither stretched nor cheap. The 1.53% dividend yield provides steady shareholder returns, while strong liquidity and low debt reinforce financial stability.
Genpact Limited
Genpact impresses with a robust 21.67% ROE and a slightly higher net margin at 10.88%, signaling strong profitability. Its P/E of 14.72 implies the stock is attractively priced, though a higher P/B at 3.19 raises some valuation caution. Genpact’s 1.45% dividend yield and very favorable leverage metrics support shareholder value.
Balanced Profitability Meets Valuation Discipline
Genpact offers higher profitability and a more attractive P/E, albeit with a pricier book value. Cognizant balances solid returns with conservative valuation and superior liquidity. Investors seeking growth with moderate risk may prefer Genpact, while those valuing financial safety might lean toward Cognizant.
Which one offers the Superior Shareholder Reward?
I compare Cognizant Technology Solutions Corporation (CTSH) and Genpact Limited (G) on dividend yields, payout ratios, and buyback intensity. CTSH yields 1.53% with a 27% payout ratio, supported by strong free cash flow coverage (3.2x). Genpact yields slightly lower at 1.45% with a 21% payout ratio but demonstrates a higher free cash flow conversion (90%). CTSH maintains moderate buybacks, enhancing total returns, while Genpact’s buybacks appear less aggressive but supported by solid operating cash flow. CTSH’s lower leverage and higher dividend sustainability edge Genpact’s riskier capital structure. I find CTSH offers a more attractive, balanced total return profile for 2026 investors.
Comparative Score Analysis: The Strategic Profile
The radar chart reveals the fundamental DNA and strategic trade-offs of Cognizant and Genpact Limited, highlighting their financial strengths and valuation nuances:
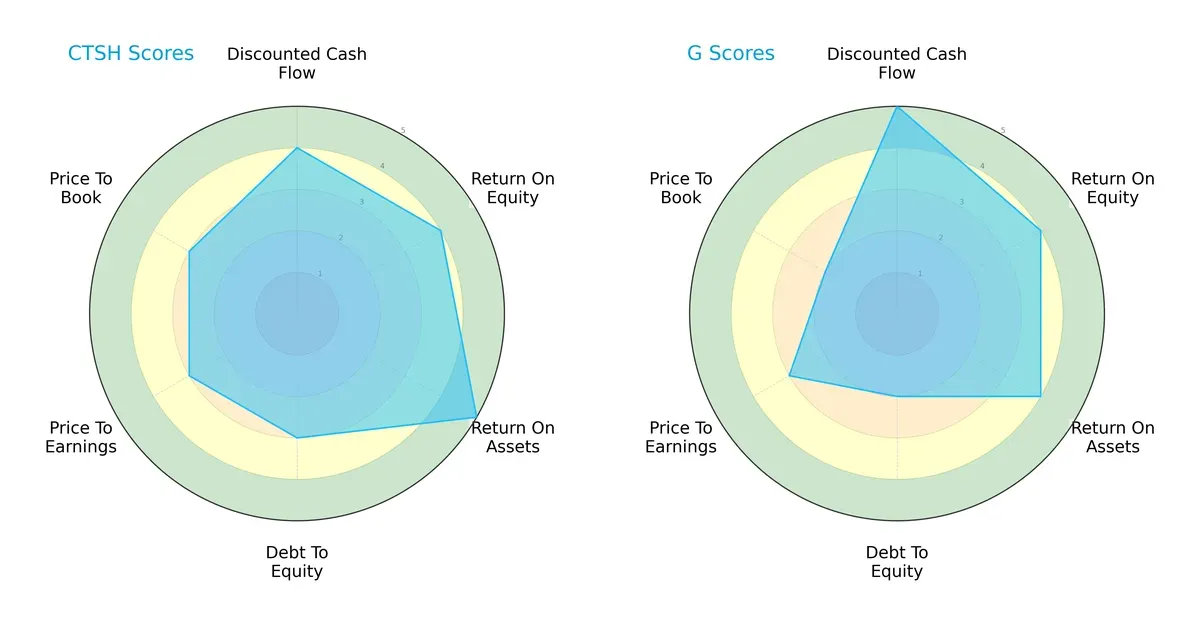
Cognizant demonstrates a more balanced profile with very favorable ROA (5) and moderate debt-to-equity (3), reflecting solid asset efficiency and manageable leverage. Genpact excels in discounted cash flow (5), signaling strong future cash flow expectations but shows weaker debt-to-equity (2) and price-to-book (2) scores, suggesting higher financial risk and premium valuation. Cognizant’s diversified strengths contrast with Genpact’s reliance on a standout DCF advantage.
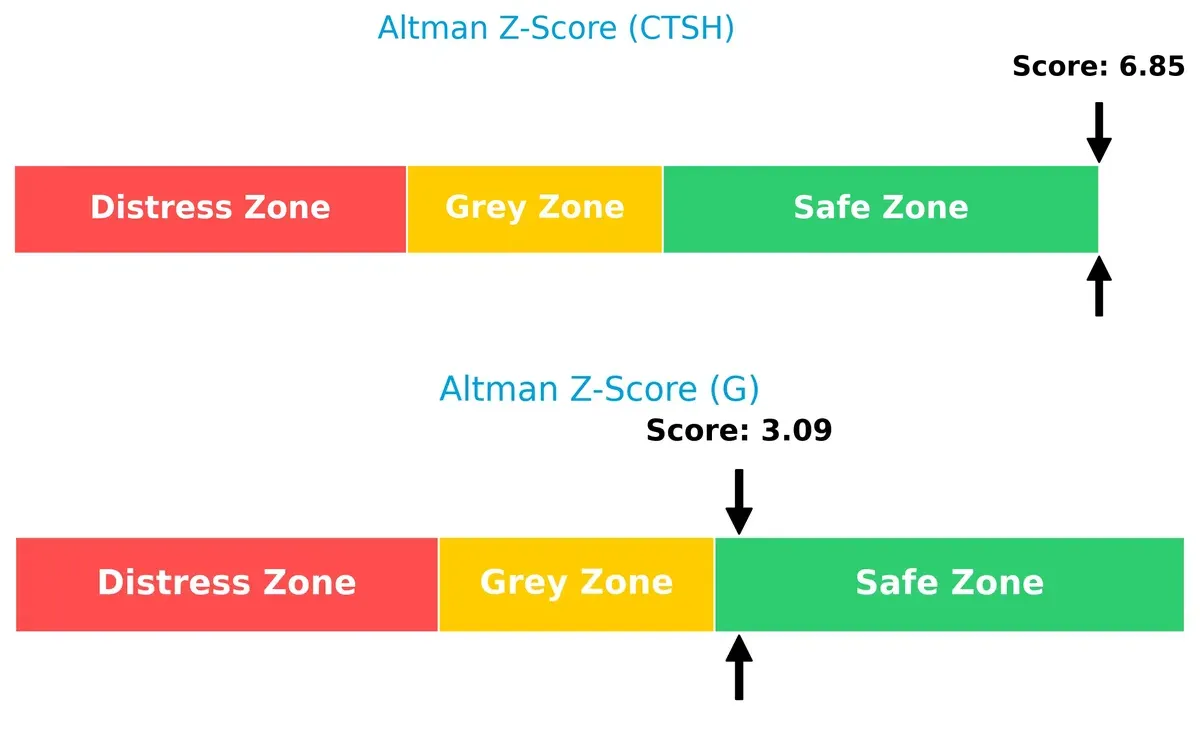
Bankruptcy Risk: Solvency Showdown
Cognizant’s Altman Z-Score (6.85) versus Genpact’s (3.09) implies both firms are safely positioned, but Cognizant holds a wider margin against bankruptcy risk in this cycle:
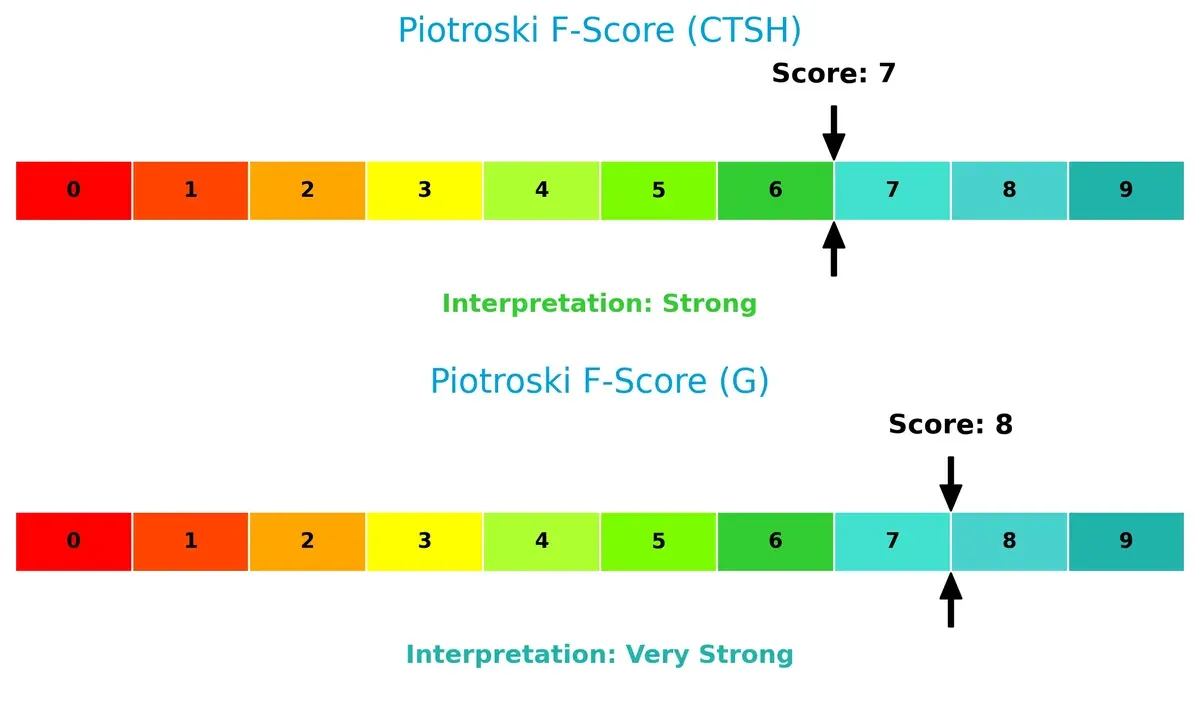
Financial Health: Quality of Operations
Genpact’s Piotroski F-Score of 8 edges out Cognizant’s 7, indicating Genpact is in very strong operational health, while Cognizant remains strong but shows slightly more internal financial variability:
How are the two companies positioned?
This section dissects the operational DNA of CTSH and G by comparing their revenue distribution by segment and internal dynamics. The goal is to confront their economic moats to reveal which business model offers the most resilient, sustainable competitive advantage today.
Revenue Segmentation: The Strategic Mix
This visual comparison dissects how Cognizant Technology Solutions Corporation and Genpact Limited diversify their income streams and where their primary sector bets lie:
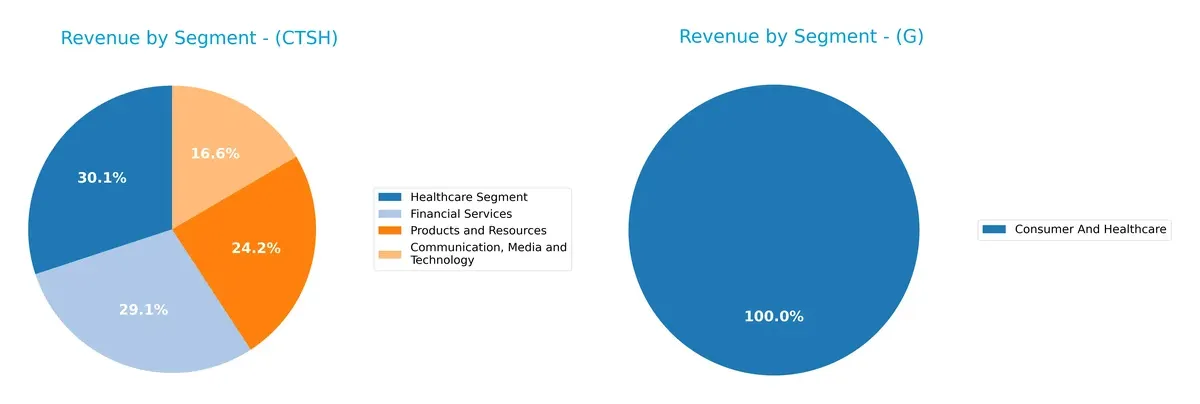
Cognizant anchors its revenue in Healthcare ($5.93B) and Financial Services ($5.75B), with balanced contributions from Products and Resources and Communication sectors. Genpact leans heavily on Consumer and Healthcare ($1.69B), showing less diversification and higher concentration risk. Cognizant’s broad mix suggests a strong ecosystem lock-in across industries, while Genpact’s focus may limit resilience but enhances domain specialization in business process services.
Strengths and Weaknesses Comparison
This table compares the Strengths and Weaknesses of Cognizant Technology Solutions Corporation (CTSH) and Genpact Limited (G):
CTSH Strengths
- Diversified revenue across Communication, Financial Services, Healthcare, and Products sectors
- Strong profitability with favorable net margin and ROIC
- Robust liquidity shown by high current and quick ratios
- Low debt levels and superior interest coverage
- Significant global presence in North America and Europe
G Strengths
- Favorable profitability metrics including higher ROE and ROIC
- Very favorable cost of capital (WACC) and P/E ratio
- Solid liquidity and manageable debt levels
- Diverse geographic footprint with strong presence in India and Americas
- Consistent revenue from Business Process Outsourcing and IT services
CTSH Weaknesses
- Neutral ROE and WACC indicate moderate capital efficiency
- Market valuation ratios are neutral, limiting premium pricing power
- Geographic concentration in North America and Europe limits exposure to emerging markets
G Weaknesses
- Unfavorable price-to-book ratio suggests possible overvaluation
- Asset turnover is neutral, indicating room for operational efficiency improvement
- Less diversified revenue streams compared to CTSH
Overall, CTSH benefits from broad sector diversification and strong financial health, while G excels in profitability and emerging market presence. Each company’s strategic focus reflects its strengths and areas requiring operational or market expansion attention.
The Moat Duel: Analyzing Competitive Defensibility
A structural moat is the only reliable shield defending long-term profits from relentless competition erosion. Let’s examine the distinct moats of two IT service leaders:
Cognizant Technology Solutions: Intangible Assets Powerhouse
Cognizant’s moat stems from deep domain expertise and client trust in digital transformation services. This drives stable 17% EBIT margins and 4.3% ROIC premium over WACC despite a declining ROIC trend. New AI and automation offerings could either reinforce or pressure its moat in 2026.
Genpact Limited: Process Excellence and Scale Advantage
Genpact leverages scalable business process outsourcing and strong operational efficiencies. Its 15.4% EBIT margin and growing 5.1% ROIC surplus over WACC show improving capital efficiency. Expansion into ESG and analytics services positions Genpact well for market disruption in 2026.
Moat Battle: Intangible Expertise vs. Operational Scale
Genpact exhibits a deeper, expanding moat with positive ROIC momentum and robust margin growth. Cognizant remains profitable but faces margin pressure and a shrinking ROIC edge. Genpact is better equipped to defend and grow its market share amid evolving client demands.
Which stock offers better returns?
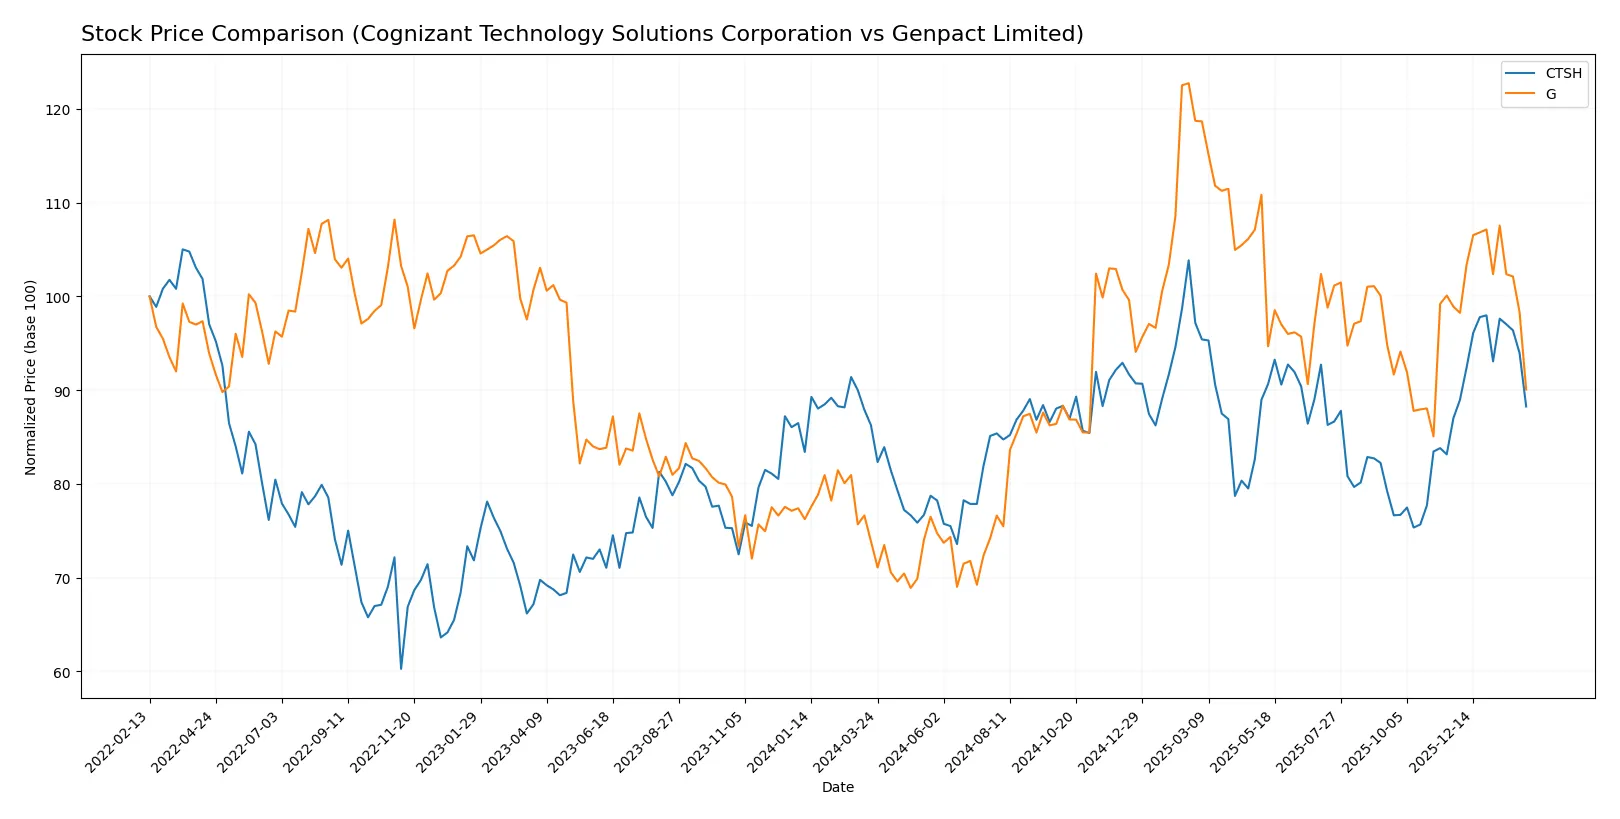
Over the past 12 months, both stocks exhibit notable price movements with Cognizant showing steady acceleration and Genpact displaying strong gains but recent deceleration.
Trend Comparison
Cognizant Technology Solutions (CTSH) posted a 2.32% price increase over the past year, reflecting a bullish trend with accelerating momentum, ranging between $64.26 and $90.7.
Genpact Limited (G) surged 21.95% over the same period, maintaining a bullish trend but with decelerating momentum and a wider price range from $30.9 to $55.05.
Genpact’s returns significantly outpaced Cognizant’s, despite recent negative momentum, delivering the highest market performance overall.
Target Prices
Analysts present a moderately bullish consensus for both Cognizant Technology Solutions Corporation and Genpact Limited.
| Company | Target Low | Target High | Consensus |
|---|---|---|---|
| Cognizant Technology Solutions Corporation | 82 | 107 | 93.2 |
| Genpact Limited | 42 | 50 | 46 |
The consensus targets for Cognizant exceed its current price of $77.08 by over 20%, signaling upside potential. Genpact’s target consensus at $46 also suggests a roughly 14% premium to its current $40.39 price.

Don’t Let Luck Decide Your Entry Point
Optimize your entry points with our advanced ProRealTime indicators. You’ll get efficient buy signals with precise price targets for maximum performance. Start outperforming now!
How do institutions grade them?
Here is a summary of recent institutional grades for Cognizant Technology Solutions Corporation and Genpact Limited:
Cognizant Technology Solutions Corporation Grades
The following table lists recent grades from reputable institutions for Cognizant Technology Solutions Corporation.
| Grading Company | Action | New Grade | Date |
|---|---|---|---|
| TD Cowen | Maintain | Hold | 2026-02-05 |
| Morgan Stanley | Maintain | Equal Weight | 2026-02-05 |
| RBC Capital | Maintain | Sector Perform | 2026-02-05 |
| Guggenheim | Maintain | Buy | 2026-01-28 |
| Citigroup | Maintain | Neutral | 2026-01-22 |
| Wells Fargo | Maintain | Overweight | 2026-01-14 |
| TD Cowen | Maintain | Hold | 2026-01-09 |
| UBS | Maintain | Neutral | 2025-12-08 |
| William Blair | Upgrade | Outperform | 2025-11-21 |
| UBS | Maintain | Neutral | 2025-10-30 |
Genpact Limited Grades
The following table lists recent grades from reputable institutions for Genpact Limited.
| Grading Company | Action | New Grade | Date |
|---|---|---|---|
| Needham | Maintain | Buy | 2026-02-06 |
| JP Morgan | Maintain | Neutral | 2025-08-20 |
| Needham | Maintain | Buy | 2025-08-08 |
| Mizuho | Maintain | Neutral | 2025-07-01 |
| Needham | Maintain | Buy | 2025-06-30 |
| TD Cowen | Maintain | Buy | 2025-06-27 |
| Baird | Maintain | Neutral | 2025-05-08 |
| Needham | Maintain | Buy | 2025-05-08 |
| Mizuho | Maintain | Neutral | 2025-02-10 |
| Needham | Maintain | Buy | 2025-02-07 |
Which company has the best grades?
Genpact Limited has consistently received Buy ratings from multiple firms, reflecting stronger bullish sentiment. Cognizant’s grades are more mixed, ranging from Hold to Buy. Investors might interpret Genpact’s higher consensus Buy ratings as greater institutional confidence.
Risks specific to each company
The following categories identify critical pressure points and systemic threats facing Cognizant Technology Solutions Corporation (CTSH) and Genpact Limited (G) in the 2026 market environment:
1. Market & Competition
Cognizant Technology Solutions Corporation (CTSH)
- Faces intense competition from global IT service firms; must innovate in AI and automation to maintain market share.
Genpact Limited (G)
- Competes in business process outsourcing with focus on digital transformation; growth depends on expanding high-value services.
2. Capital Structure & Debt
Cognizant Technology Solutions Corporation (CTSH)
- Strong balance sheet with low debt-to-equity (0.1), high interest coverage (97.9x), indicating low financial risk.
Genpact Limited (G)
- Higher leverage (debt-to-equity 0.23) with lower interest coverage (15.7x); manageable but riskier in rising rate environments.
3. Stock Volatility
Cognizant Technology Solutions Corporation (CTSH)
- Beta near 1 (0.96) suggests stock moves in line with market; moderate volatility expected.
Genpact Limited (G)
- Lower beta (0.74) indicates less sensitivity to market swings; may appeal to risk-averse investors.
4. Regulatory & Legal
Cognizant Technology Solutions Corporation (CTSH)
- Subject to evolving data privacy and outsourcing regulations in US and Europe; compliance costs could rise.
Genpact Limited (G)
- Faces regulatory scrutiny in multiple jurisdictions, including environmental and labor laws; compliance complexity is high.
5. Supply Chain & Operations
Cognizant Technology Solutions Corporation (CTSH)
- Operates globally with diverse outsourcing partners; operational risks include talent retention and geopolitical disruptions.
Genpact Limited (G)
- Relies on robust supply chain advisory services; operational excellence critical amid digital transformation pressures.
6. ESG & Climate Transition
Cognizant Technology Solutions Corporation (CTSH)
- Increasing focus on sustainable IT solutions; ESG initiatives may require significant investment to meet client demands.
Genpact Limited (G)
- Strong emphasis on ESG services, including carbon accounting; poised to capitalize but faces execution risks.
7. Geopolitical Exposure
Cognizant Technology Solutions Corporation (CTSH)
- US-based with global operations; sensitive to US-China tech tensions and global trade uncertainties.
Genpact Limited (G)
- Bermuda-based with significant operations in Asia and Americas; geopolitical risks include regional instability and regulatory shifts.
Which company shows a better risk-adjusted profile?
CTSH’s low leverage and high interest coverage provide a robust cushion against financial risks, while G’s higher debt levels and regulatory complexity pose greater challenges. CTSH’s market-aligned volatility and strong operational controls give it an edge. Genpact’s leading ESG positioning is promising but adds execution complexity. I judge CTSH to have a better risk-adjusted profile given its stronger balance sheet and operational resilience. Notably, CTSH’s interest coverage ratio near 98x sharply contrasts with G’s 15.7x, underscoring CTSH’s superior financial safety margin in 2026.
Final Verdict: Which stock to choose?
Cognizant Technology Solutions stands out for its operational efficiency and robust cash generation. Its slight decline in profitability is a point of vigilance but does not overshadow its strong balance sheet and favorable liquidity. This stock fits well within an Aggressive Growth portfolio seeking steady cash flow.
Genpact Limited’s strategic moat lies in its sustainable profitability and improving return on invested capital. It offers a safer profile with very favorable growth metrics, albeit at a higher price-to-book ratio. Genpact suits investors focused on GARP—Growth at a Reasonable Price—with an emphasis on stability and expanding margins.
If you prioritize operational efficiency and reliable cash flow, Cognizant is the compelling choice due to its strong liquidity and value creation despite a declining ROIC trend. However, if you seek sustainable competitive advantage with accelerating profitability, Genpact offers better stability and growth, though at a premium valuation. Both present distinct analytical scenarios for different investor profiles.
Disclaimer: Investment carries a risk of loss of initial capital. The past performance is not a reliable indicator of future results. Be sure to understand risks before making an investment decision.
Go Further
I encourage you to read the complete analyses of Cognizant Technology Solutions Corporation and Genpact Limited to enhance your investment decisions: