Home > Comparison > Technology > CTSH vs IT
The strategic rivalry between Cognizant Technology Solutions Corporation and Gartner, Inc. shapes the evolution of the technology sector. Cognizant operates as a capital-intensive IT services provider with broad consulting and outsourcing capabilities. In contrast, Gartner specializes in high-margin research and advisory services centered on IT strategy. This analysis will assess which business model offers superior risk-adjusted returns for diversified portfolios amidst ongoing technological transformation.
Table of contents
Companies Overview
Cognizant Technology Solutions and Gartner shape the digital transformation landscape with distinct expertise and scale.
Cognizant Technology Solutions Corporation: Global IT Services Powerhouse
Cognizant leads as a professional services company specializing in consulting, technology, and outsourcing. Its revenue stems from four segments, including healthcare and financial services. In 2026, it focuses on digital innovation such as robotic process automation and AI to enhance customer experience and operational efficiency globally.
Gartner, Inc.: Premier IT Research and Advisory Firm
Gartner dominates as a research and advisory company delivering insights via subscription research, conferences, and consulting. Its core income derives from subscription services and tailored IT solutions. The 2026 strategy emphasizes IT cost optimization and digital transformation to support enterprise IT priorities worldwide.
Strategic Collision: Similarities & Divergences
Both operate within the Information Technology Services sector but diverge sharply: Cognizant drives operational outsourcing and technology integration, while Gartner delivers knowledge and strategic advisory. Their primary battleground is digital transformation leadership. Investors face contrasting profiles—Cognizant offers scale and execution, Gartner delivers niche expertise and recurring research revenues.
Income Statement Comparison
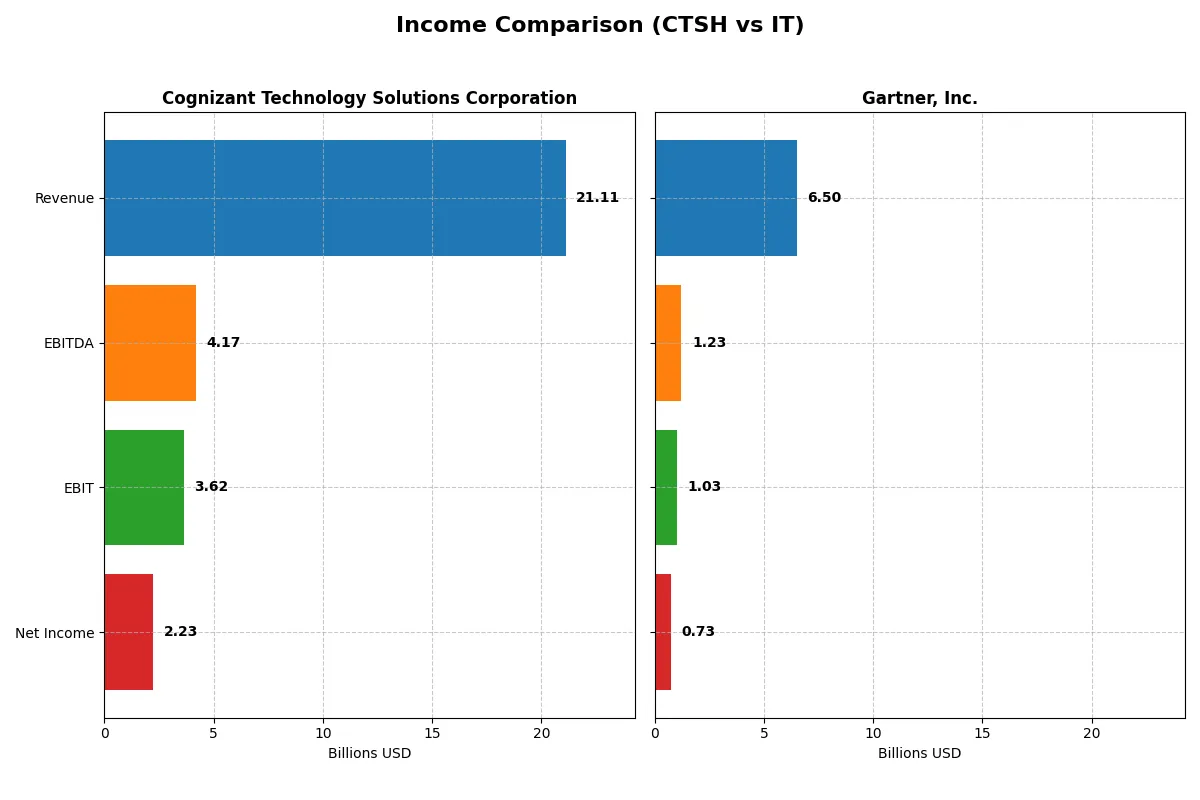
This data dissects the core profitability and scalability of both corporate engines to reveal who dominates the bottom line:
| Metric | Cognizant Technology Solutions Corporation (CTSH) | Gartner, Inc. (IT) |
|---|---|---|
| Revenue | 21.1B | 6.5B |
| Cost of Revenue | 14.0B | 2.1B |
| Operating Expenses | 3.6B | 3.4B |
| Gross Profit | 7.1B | 4.4B |
| EBITDA | 4.2B | 1.2B |
| EBIT | 3.6B | 1.0B |
| Interest Expense | 37M | 61M |
| Net Income | 2.2B | 729M |
| EPS | 4.56 | 9.68 |
| Fiscal Year | 2025 | 2025 |
Income Statement Analysis: The Bottom-Line Duel
This income statement comparison reveals the true operational efficiency and profit generation of two distinct corporate engines.
Cognizant Technology Solutions Corporation (CTSH) Analysis
CTSH’s revenue grew steadily from $18.5B in 2021 to $21.1B in 2025, with net income rising modestly to $2.23B. Gross margin remains healthy at 33.7%, supporting solid profitability. Despite a slight net margin dip in 2025, EBIT margin expanded 21% year-over-year, signaling improving operational efficiency and momentum.
Gartner, Inc. (IT) Analysis
Gartner’s revenue climbed from $4.7B in 2021 to $6.5B in 2025, reflecting aggressive growth. It boasts a superior gross margin of 67.7%, but EBIT and net margins contracted sharply in 2025 due to rising expenses. Net income fell 44% year-over-year to $729M, indicating margin pressure despite top-line gains.
Margin Strength vs. Revenue Expansion
CTSH displays balanced growth with improving EBIT margins and stable net income, reflecting disciplined cost control. Gartner scales revenue faster but struggles with margin erosion and profitability declines. For investors prioritizing consistent earnings and margin resilience, CTSH’s profile offers greater fundamental stability.
Financial Ratios Comparison
These vital ratios act as a diagnostic tool to expose the underlying fiscal health, valuation premiums, and capital efficiency of the companies compared below:
| Ratios | Cognizant Technology Solutions Corporation (CTSH) | Gartner, Inc. (IT) |
|---|---|---|
| ROE | 14.85% | 227.93% |
| ROIC | 12.31% | 19.23% |
| P/E | 17.90 | 24.91 |
| P/B | 2.66 | 56.78 |
| Current Ratio | 2.34 | 1.00 |
| Quick Ratio | 2.34 | 1.00 |
| D/E | 0.10 | 0.86 |
| Debt-to-Assets | 7.61% | 3.40% |
| Interest Coverage | 95.38 | 16.93 |
| Asset Turnover | 1.02 | 0.80 |
| Fixed Asset Turnover | 14.02 | 15.17 |
| Payout ratio | 27.35% | 0% |
| Dividend yield | 1.53% | 0% |
| Fiscal Year | 2025 | 2025 |
Efficiency & Valuation Duel: The Vital Signs
Financial ratios act as a company’s DNA, exposing hidden risks and operational strengths that shape investor decisions.
Cognizant Technology Solutions Corporation
Cognizant delivers solid profitability with a 14.85% ROE and a favorable 10.56% net margin, reflecting operational efficiency. Its valuation appears reasonable at a P/E of 17.9 and P/B of 2.66, neither stretched nor cheap. Shareholders benefit from a modest 1.53% dividend yield, signaling steady returns alongside reinvestment potential.
Gartner, Inc.
Gartner impresses with an extraordinary 227.93% ROE and a strong 11.22% net margin, showcasing exceptional capital efficiency. However, its valuation is elevated, with a P/E near 25 and an unfavorable P/B of 56.78, suggesting stretched pricing. The absence of dividends points to a growth-focused reinvestment strategy, particularly in R&D.
Premium Valuation vs. Operational Safety
Cognizant balances solid profitability and prudent valuation, offering operational safety. Gartner’s exceptional returns come at a high valuation risk and no dividends. Investors seeking stable income and measured risk may favor Cognizant, while those pursuing aggressive growth might lean toward Gartner.
Which one offers the Superior Shareholder Reward?
I compare Cognizant Technology Solutions Corporation (CTSH) and Gartner, Inc. (IT) on dividends, payout ratios, and buybacks to assess shareholder rewards in 2026. CTSH yields 1.53% with a 27% payout ratio, supported by strong free cash flow coverage (3.2x). It balances dividends with buybacks, signaling a sustainable distribution. Gartner pays no dividend, reinvesting heavily in growth (R&D and acquisitions), and executes robust buybacks to boost total returns. While CTSH offers steady income and moderate buybacks, Gartner’s aggressive reinvestment and buybacks target capital appreciation but carry higher risk due to elevated leverage. For risk-averse investors seeking reliable cash flow, CTSH provides superior shareholder reward. Growth-focused investors may prefer Gartner’s return potential but must tolerate volatility. Overall, CTSH delivers a more sustainable and attractive total return profile in 2026.
Comparative Score Analysis: The Strategic Profile
The radar chart reveals the fundamental DNA and trade-offs of Cognizant Technology Solutions Corporation and Gartner, Inc.:
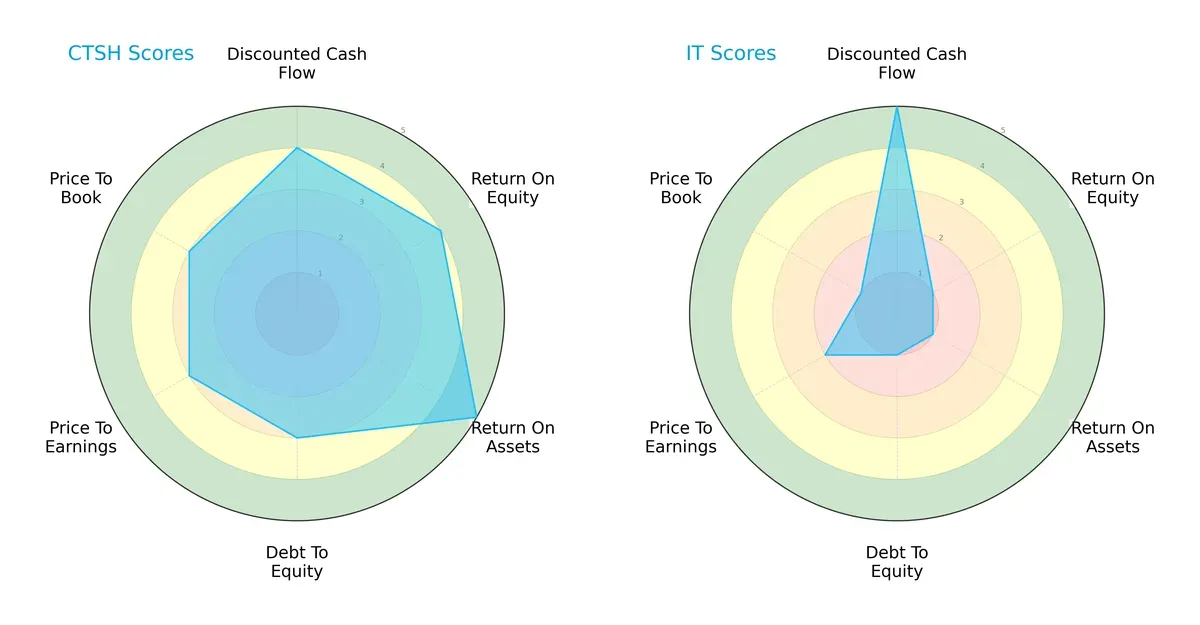
Cognizant posts a balanced profile with strong ROE (4) and ROA (5), moderate debt (3), and reasonable valuation scores (PE and PB at 3). Gartner excels in discounted cash flow (5) but suffers from weak profitability (ROE and ROA at 1) and high leverage (debt-to-equity at 1). Cognizant’s diversified strengths suggest operational resilience, while Gartner relies heavily on future cash flows and faces riskier financial metrics.
Bankruptcy Risk: Solvency Showdown
Cognizant’s Altman Z-Score of 6.25 versus Gartner’s 3.57 signals a clear edge in long-term solvency:
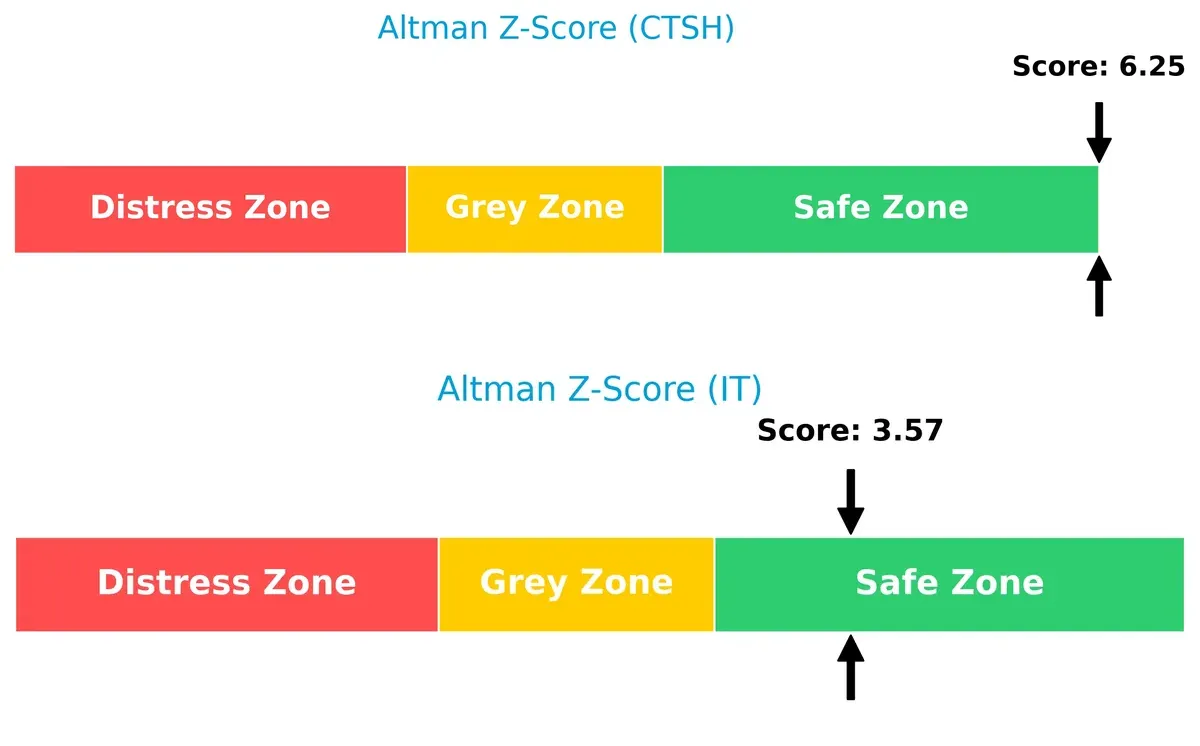
Both are in the safe zone, but Cognizant’s significantly higher score indicates a stronger buffer against economic downturns. Gartner, closer to the lower safe zone boundary, faces more moderate financial risk if market conditions worsen.
Financial Health: Quality of Operations
Cognizant’s Piotroski F-Score of 7 outperforms Gartner’s 5, indicating superior operational quality and financial health:
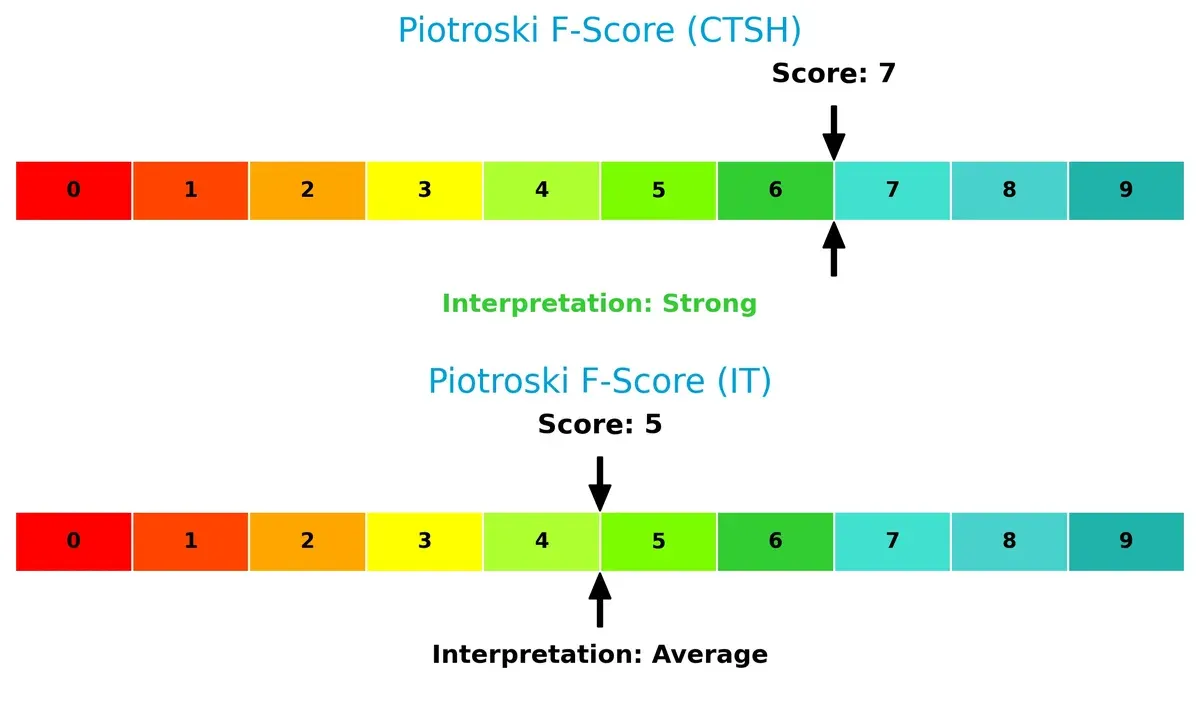
A score of 7 reflects strong profitability, efficiency, and leverage management at Cognizant. Gartner’s average score flags potential red flags in internal metrics, suggesting caution for investors prioritizing financial robustness.
How are the two companies positioned?
This section dissects the operational DNA of Cognizant and Gartner by comparing their revenue distribution by segment and internal dynamics. The goal is to confront their economic moats to identify the most resilient and sustainable competitive advantage today.
Revenue Segmentation: The Strategic Mix
This visual comparison dissects how Cognizant Technology Solutions and Gartner diversify income streams and where their primary sector bets lie:
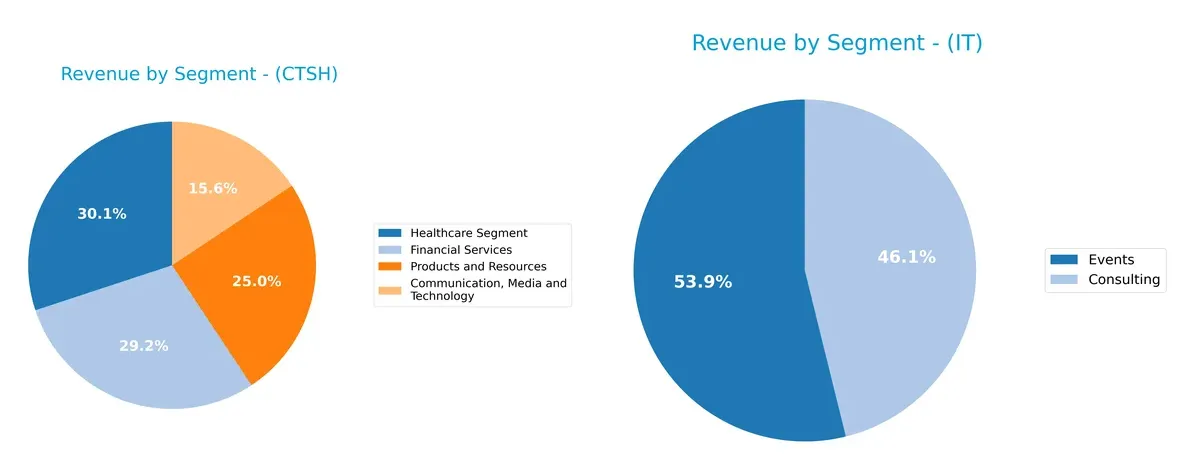
Cognizant anchors revenue across four robust sectors, with Financial Services and Healthcare each exceeding $6.1B, signaling strong diversification. Gartner pivots heavily on its Research Segment at about $5.1B, dwarfing Consulting and Events, which are under $650M each. Cognizant’s balanced portfolio reduces concentration risk, while Gartner’s dominance in research underlines a moat built on proprietary insights but increases dependency on a single segment.
Strengths and Weaknesses Comparison
This table compares the Strengths and Weaknesses of Cognizant Technology Solutions Corporation and Gartner, Inc.:
CTSH Strengths
- Diverse revenue streams across four major industry segments
- Strong global presence with significant North America and Europe markets
- Favorable liquidity ratios with current and quick ratios above 2
- Low debt levels and high interest coverage support financial stability
- ROIC (12.31%) exceeds WACC (7.87%), indicating efficient capital allocation
IT Strengths
- High profitability with exceptional ROE (227.93%) and ROIC (19.23%)
- Strong market presence in research, consulting, and events segments
- Favorable debt-to-assets ratio and interest coverage support creditworthiness
- High fixed asset turnover shows efficient use of fixed assets
- Solid global footprint in the US, Europe Middle East Africa, and other international markets
CTSH Weaknesses
- ROE is neutral at 14.85%, indicating moderate shareholder returns
- PE and PB ratios are neutral, implying market valuation is not clearly favorable
- Dividend yield is modest at 1.53%, limiting income appeal
- Market segments show moderate growth without clear dominance
IT Weaknesses
- High PB ratio (56.78) signals potential overvaluation risk
- Current ratio at 1.0 indicates weaker short-term liquidity
- No dividend yield reduces income for investors
- Debt-to-equity ratio is relatively high at 0.86, increasing financial leverage risk
Both companies exhibit distinct strengths: CTSH excels in diversification and financial stability, while IT shows superior profitability metrics but faces valuation and liquidity concerns. These differences highlight contrasting strategic focuses and risk profiles.
The Moat Duel: Analyzing Competitive Defensibility
A structural moat is the only reliable shield protecting long-term profits from relentless competitive pressure and market disruption:
Cognizant Technology Solutions Corporation: Operational Efficiency with Scale
Cognizant’s primary moat stems from cost advantage and scale in IT outsourcing. Its stable 17% EBIT margin and 33.7% gross margin reflect operational leverage. In 2026, expansion into AI-driven automation could deepen its moat, though margin pressure risks persist.
Gartner, Inc.: Intellectual Capital and Network Effects
Gartner’s moat relies on intangible assets—premium research and expert networks. Unlike Cognizant’s scale, Gartner commands a high 67.7% gross margin, signaling pricing power. Its growing ROIC confirms durable value creation. Future growth hinges on expanding consulting and digital advisory services globally.
Cost Leadership vs. Intellectual Capital: The Moat Showdown
Gartner holds a deeper moat with a robust ROIC exceeding WACC by over 10%, coupled with a rising profitability trend. Cognizant creates value but faces declining ROIC. Gartner is better positioned to defend market share through its unique intellectual property and expanding advisory network.
Which stock offers better returns?
Both stocks show pronounced declines over the past year, with distinct bearish trends and decelerating momentum reflecting weakening investor sentiment.
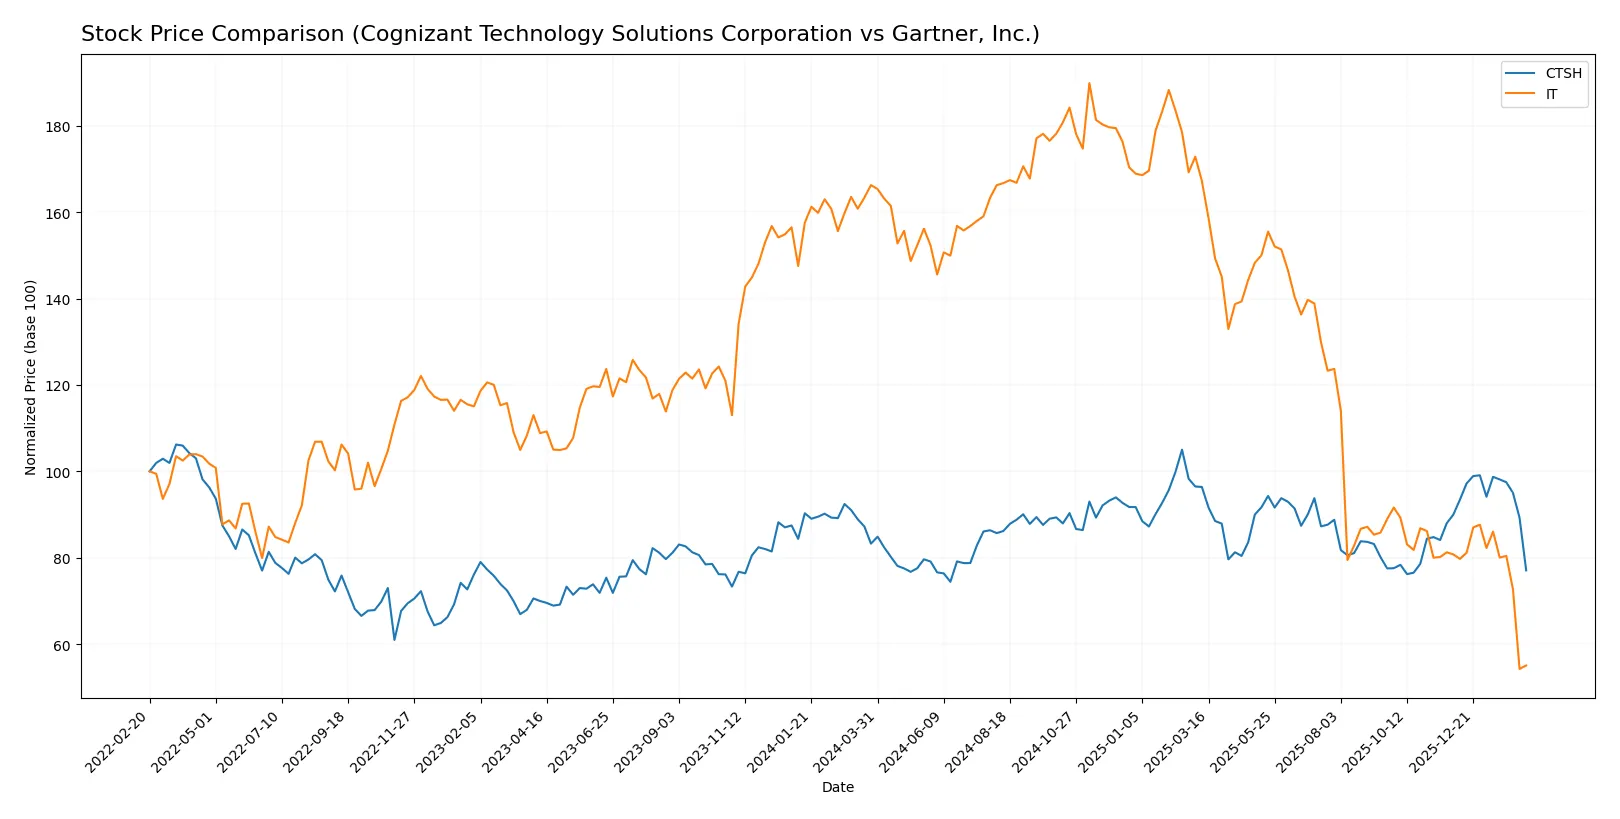
Trend Comparison
Cognizant Technology Solutions Corporation (CTSH) stock fell 7.44% over the past 12 months, showing a bearish trend with decelerating losses. The price ranged between 64.26 and 90.7, with volatility measured by a 5.84 standard deviation.
Gartner, Inc. (IT) experienced a steep 66.92% decline over the same period. The stock’s bearish trend also decelerated but with extreme volatility at a 110.8 standard deviation, hitting highs of 547.4 and lows of 156.33.
Comparing the two, CTSH outperformed IT by a wide margin, delivering a smaller loss and lower volatility, thus providing relatively better market performance over the past year.
Target Prices
Analysts present a cautiously optimistic consensus for Cognizant Technology Solutions and Gartner, Inc.
| Company | Target Low | Target High | Consensus |
|---|---|---|---|
| Cognizant Technology Solutions Corporation | 82 | 107 | 92.1 |
| Gartner, Inc. | 170 | 275 | 206.3 |
Cognizant’s consensus target of 92.1 implies a 38% upside from its current 66.55 price. Gartner’s consensus target of 206.3 suggests a 30% potential rise from 158.58.

Don’t Let Luck Decide Your Entry Point
Optimize your entry points with our advanced ProRealTime indicators. You’ll get efficient buy signals with precise price targets for maximum performance. Start outperforming now!
How do institutions grade them?
Cognizant Technology Solutions Corporation Grades
The table below shows recent grades issued by respected financial firms for Cognizant:
| Grading Company | Action | New Grade | Date |
|---|---|---|---|
| Morgan Stanley | Maintain | Equal Weight | 2026-02-05 |
| RBC Capital | Maintain | Sector Perform | 2026-02-05 |
| TD Cowen | Maintain | Hold | 2026-02-05 |
| Guggenheim | Maintain | Buy | 2026-01-28 |
| Citigroup | Maintain | Neutral | 2026-01-22 |
| Wells Fargo | Maintain | Overweight | 2026-01-14 |
| TD Cowen | Maintain | Hold | 2026-01-09 |
| UBS | Maintain | Neutral | 2025-12-08 |
| William Blair | Upgrade | Outperform | 2025-11-21 |
| Wells Fargo | Maintain | Overweight | 2025-10-30 |
Gartner, Inc. Grades
Below is a summary of recent analyst grades for Gartner:
| Grading Company | Action | New Grade | Date |
|---|---|---|---|
| Truist Securities | Maintain | Buy | 2026-02-06 |
| Barclays | Maintain | Equal Weight | 2026-02-05 |
| Morgan Stanley | Maintain | Equal Weight | 2026-02-04 |
| Wells Fargo | Maintain | Underweight | 2026-02-04 |
| UBS | Maintain | Neutral | 2026-01-09 |
| Morgan Stanley | Maintain | Equal Weight | 2025-12-17 |
| BMO Capital | Maintain | Market Perform | 2025-11-06 |
| UBS | Maintain | Neutral | 2025-11-05 |
| Goldman Sachs | Maintain | Buy | 2025-11-05 |
| Barclays | Maintain | Equal Weight | 2025-11-05 |
Which company has the best grades?
Cognizant holds a mix of Buy, Outperform, and Overweight ratings, suggesting moderate optimism. Gartner shows Buy and Market Perform grades but also an Underweight rating, reflecting mixed views. Investors may weigh this divergence based on their risk tolerance.
Risks specific to each company
The following categories identify the critical pressure points and systemic threats facing both firms in the 2026 market environment:
1. Market & Competition
Cognizant Technology Solutions Corporation
- Faces intense competition in IT consulting and outsourcing, with pressure on pricing and innovation.
Gartner, Inc.
- Operates in niche research and advisory with some pricing power but faces competition from digital disruptors.
2. Capital Structure & Debt
Cognizant Technology Solutions Corporation
- Maintains a low debt-to-equity ratio (0.1), signaling strong financial stability and manageable leverage.
Gartner, Inc.
- Higher debt-to-equity ratio (0.86) increases financial risk despite a favorable interest coverage ratio.
3. Stock Volatility
Cognizant Technology Solutions Corporation
- Beta near 0.96 indicates moderate sensitivity to market swings, reflecting stable investor confidence.
Gartner, Inc.
- Beta above 1.03 suggests higher volatility and greater market risk exposure.
4. Regulatory & Legal
Cognizant Technology Solutions Corporation
- Subject to data privacy and outsourcing regulations internationally, increasing compliance costs.
Gartner, Inc.
- Faces regulatory scrutiny in data handling and advisory services across multiple jurisdictions.
5. Supply Chain & Operations
Cognizant Technology Solutions Corporation
- Complex global delivery model risks disruption but benefits from diversified operational footprint.
Gartner, Inc.
- Less exposed to physical supply chain risks due to service-based model, but dependent on talent availability.
6. ESG & Climate Transition
Cognizant Technology Solutions Corporation
- Increasing pressure to demonstrate sustainable IT practices and reduce carbon footprint.
Gartner, Inc.
- ESG integration critical for client advisory credibility; lagging dividend yield may signal limited ESG-linked returns.
7. Geopolitical Exposure
Cognizant Technology Solutions Corporation
- Broad international presence exposes it to geopolitical risks, including trade tensions and regulatory changes.
Gartner, Inc.
- Also global but with a lighter operational footprint, slightly reducing direct geopolitical risk.
Which company shows a better risk-adjusted profile?
Cognizant’s strongest risk is geopolitical exposure due to its large global operations, whereas Gartner’s capital structure and stock volatility pose significant concerns. Cognizant’s low leverage, strong liquidity ratios, and stable beta offer a superior risk-adjusted profile. Gartner’s elevated debt and high price-to-book ratio underline valuation and financial risks. Cognizant’s Altman Z-score of 6.25 versus Gartner’s 3.57 confirms its safer financial standing.
Final Verdict: Which stock to choose?
Cognizant Technology Solutions Corporation (CTSH) excels as a cash-generating machine with consistent value creation and a robust balance sheet. Its point of vigilance lies in declining profitability trends, signaling the need for close monitoring. It suits portfolios aiming for steady, slightly conservative growth with operational resilience.
Gartner, Inc. (IT) commands a strategic moat through its unparalleled market intelligence and recurring revenue base. Though it carries higher valuation multiples and weaker liquidity ratios, it offers stronger profitability growth and a sustainable competitive advantage. It fits growth-at-a-reasonable-price (GARP) investors willing to tolerate valuation premiums for innovation leadership.
If you prioritize financial stability and proven capital efficiency, CTSH is the compelling choice due to its favorable balance sheet and moderate valuation. However, if you seek superior growth potential backed by a durable moat, IT offers better scalability despite higher risk and valuation volatility. Both present distinct analytical scenarios aligned with different investor risk-return preferences.
Disclaimer: Investment carries a risk of loss of initial capital. The past performance is not a reliable indicator of future results. Be sure to understand risks before making an investment decision.
Go Further
I encourage you to read the complete analyses of Cognizant Technology Solutions Corporation and Gartner, Inc. to enhance your investment decisions: