Home > Comparison > Technology > CTSH vs FISV
The strategic rivalry between Cognizant Technology Solutions Corporation and Fiserv, Inc. shapes the trajectory of the technology services sector. Cognizant operates as a broad-based IT services provider with diversified consulting and digital transformation offerings. In contrast, Fiserv focuses on specialized financial technology and payment solutions. This analysis will evaluate which company’s operational model presents the superior risk-adjusted investment opportunity in a competitive, innovation-driven environment.
Table of contents
Companies Overview
Cognizant and Fiserv stand as pivotal players in the global information technology services landscape. Their scale and innovation shape critical sectors from healthcare to financial services.
Cognizant Technology Solutions Corporation: Global IT Services Powerhouse
Cognizant dominates as a professional services firm specializing in consulting and technology outsourcing. It generates revenue through tailored digital solutions across financial services, healthcare, and media sectors. In 2026, it emphasized AI-driven automation and customer experience enhancements, focusing on integrated omni-channel delivery and operational efficiency.
Fiserv, Inc.: Financial Technology Innovator
Fiserv leads by offering comprehensive payment and financial services technology worldwide. Its core revenue derives from point-of-sale systems, digital banking, and card processing services. The company’s 2026 strategy centers on expanding cloud-based commerce platforms and fraud protection, targeting seamless digital transactions and omnichannel merchant solutions.
Strategic Collision: Similarities & Divergences
Both firms excel in technology-driven services but diverge sharply in approach: Cognizant embraces a consulting-led, sector-diverse model, while Fiserv focuses on financial technology infrastructure and payments. They fiercely compete in digital transformation for financial institutions and merchants. Cognizant’s broad IT services contrast with Fiserv’s specialized fintech platform, creating distinct investment profiles grounded in diversification versus niche dominance.
Income Statement Comparison
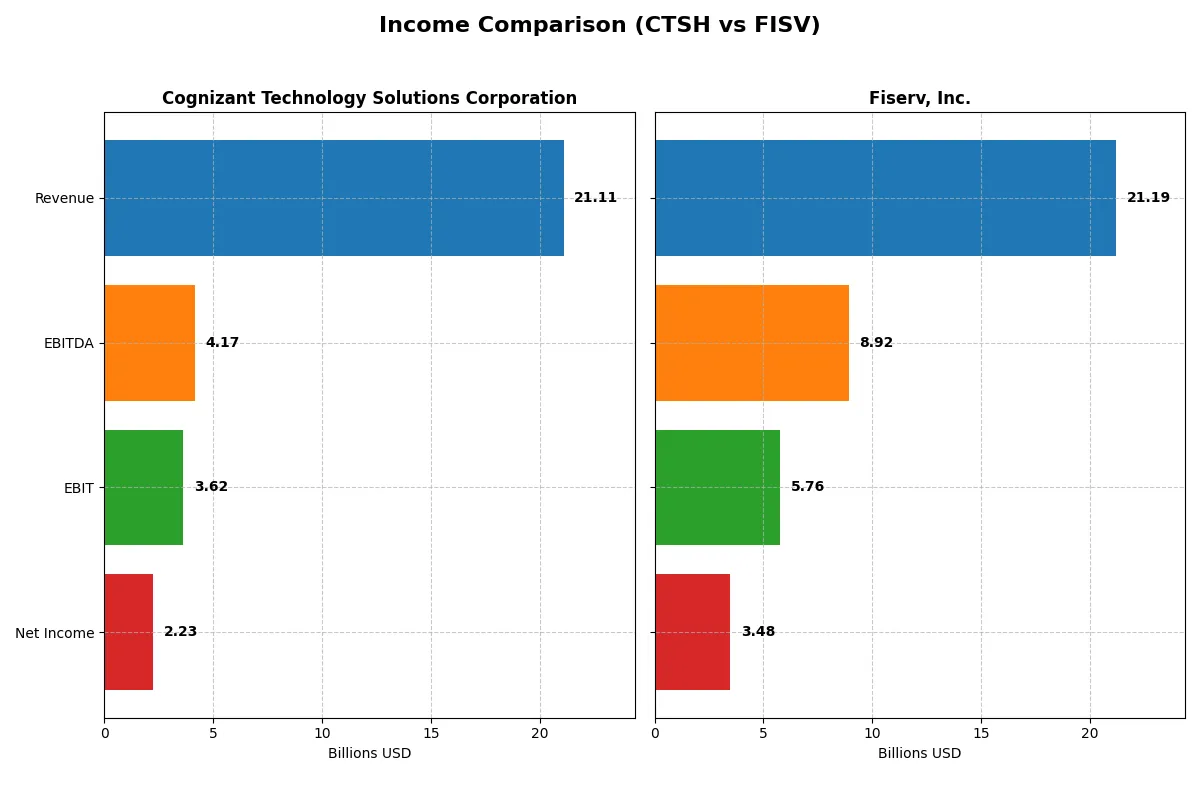
The data below dissects the core profitability and scalability of both corporate engines to reveal who dominates the bottom line:
| Metric | Cognizant Technology Solutions Corporation (CTSH) | Fiserv, Inc. (FISV) |
|---|---|---|
| Revenue | 21.1B | 21.2B |
| Cost of Revenue | 14.0B | 8.6B |
| Operating Expenses | 3.6B | 6.9B |
| Gross Profit | 7.1B | 12.6B |
| EBITDA | 4.2B | 8.9B |
| EBIT | 3.6B | 5.8B |
| Interest Expense | 37M | 1.5B |
| Net Income | 2.2B | 3.5B |
| EPS | 4.56 | 6.34 |
| Fiscal Year | 2025 | 2025 |
Income Statement Analysis: The Bottom-Line Duel
This income statement comparison unveils which company converts revenue into profit more efficiently in today’s competitive landscape.
Cognizant Technology Solutions Corporation Analysis
Cognizant’s revenue grew steadily from 18.5B in 2021 to 21.1B in 2025, while net income increased modestly to 2.23B. Its gross margin remains healthy at 33.7%, with a net margin of 10.6%, reflecting efficient cost control. The 2025 EBIT surged 21%, signaling stronger operating momentum despite slight net margin compression.
Fiserv, Inc. Analysis
Fiserv expanded revenue from 16.2B in 2021 to 21.2B in 2025, with net income soaring 160% to 3.48B. Its gross margin impresses at 59.4%, and net margin stands at a robust 16.4%. Although operating expenses grew faster than revenue recently, Fiserv’s EPS jumped nearly 18% last year, highlighting strong earnings acceleration.
Margin Power vs. Earnings Momentum
Fiserv leads with superior gross and net margins, reflecting a formidable moat and capital allocation efficiency. Cognizant shows solid revenue growth and improving EBIT but lags in margin expansion. For investors prioritizing profitability and earnings momentum, Fiserv’s profile appears more attractive given its dominant margins and rapid net income growth.
Financial Ratios Comparison
These vital ratios act as a diagnostic tool to expose the underlying fiscal health, valuation premiums, and capital efficiency of the companies compared below:
| Ratios | Cognizant Technology Solutions Corporation (CTSH) | Fiserv, Inc. (FISV) |
|---|---|---|
| ROE | 14.9% | 13.5% |
| ROIC | 12.3% | 8.0% |
| P/E | 17.9 | 10.6 |
| P/B | 2.66 | 1.43 |
| Current Ratio | 2.34 | 1.03 |
| Quick Ratio | 2.34 | 1.03 |
| D/E | 0.10 | 1.12 |
| Debt-to-Assets | 7.6% | 36.2% |
| Interest Coverage | 95.4 | 3.82 |
| Asset Turnover | 1.02 | 0.26 |
| Fixed Asset Turnover | 14.0 | 6.87 |
| Payout ratio | 27.4% | 0% |
| Dividend yield | 1.53% | 0% |
| Fiscal Year | 2025 | 2025 |
Efficiency & Valuation Duel: The Vital Signs
Financial ratios act as a company’s DNA, illuminating hidden risks and revealing operational strengths critical for investment clarity.
Cognizant Technology Solutions Corporation
Cognizant posts a solid 14.9% ROE and a 10.6% net margin, signaling consistent profitability. Its P/E of 17.9 and P/B of 2.66 mark it as fairly valued, not stretched. The company returns value through a 1.53% dividend yield, balancing shareholder rewards with stable reinvestment in operations.
Fiserv, Inc.
Fiserv displays a robust 16.4% net margin but a slightly lower 13.5% ROE, highlighting efficient profit generation. The stock trades attractively at a P/E of 10.6 and P/B of 1.43, suggesting undervaluation. However, it carries higher debt and offers no dividend, implying reinvestment or debt management strategies dominate its capital allocation.
Balanced Profitability vs. Value Opportunity
Cognizant offers a favorable balance with steady returns and moderate valuation, reflecting operational safety. Fiserv provides a cheaper entry with stronger margins but embraces higher leverage and no dividends. Investors prioritizing stability may prefer Cognizant, while those seeking value with growth potential might lean toward Fiserv.
Which one offers the Superior Shareholder Reward?
I see Cognizant (CTSH) delivers a 1.53% dividend yield with a prudent 27% payout ratio, supported by strong free cash flow coverage (~90%). Its buyback program is moderate but consistent, enhancing shareholder returns sustainably. Fiserv (FISV) pays no dividends but reinvests heavily in growth and acquisitions, reflected by zero payout and strong free cash flow reinvestment. However, Fiserv’s high leverage (debt-to-equity 1.12) and weaker cash ratio raise sustainability concerns. I conclude CTSH offers a superior total return profile in 2026 due to balanced distributions and healthier capital structure, aligning with prudent long-term value creation.
Comparative Score Analysis: The Strategic Profile
The radar chart reveals the fundamental DNA and trade-offs of both firms, highlighting their financial strengths and valuation contrasts:
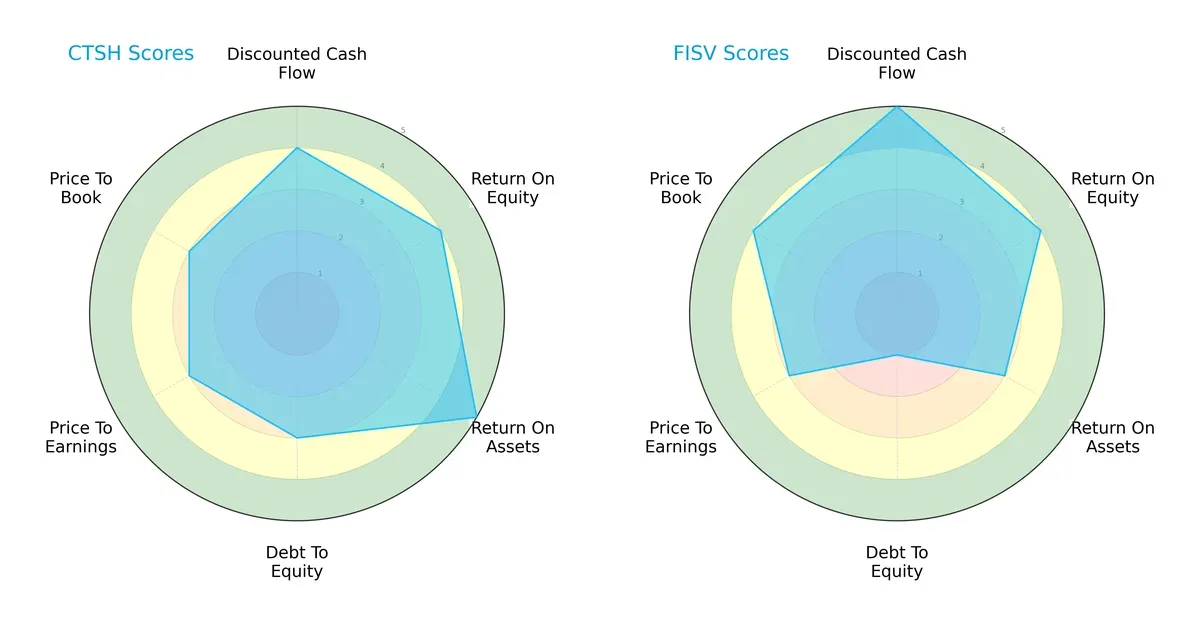
Cognizant Technology Solutions (CTSH) shows a balanced profile with very favorable asset utilization (ROA 5) and solid profitability (ROE 4). Fiserv (FISV) excels in discounted cash flow (DCF 5) and book valuation (P/B 4) but carries a heavy debt burden (Debt/Equity 1). CTSH manages leverage more prudently (Debt/Equity 3), offering a steadier risk-return trade-off. FISV relies on cash flow strength but faces solvency concerns.
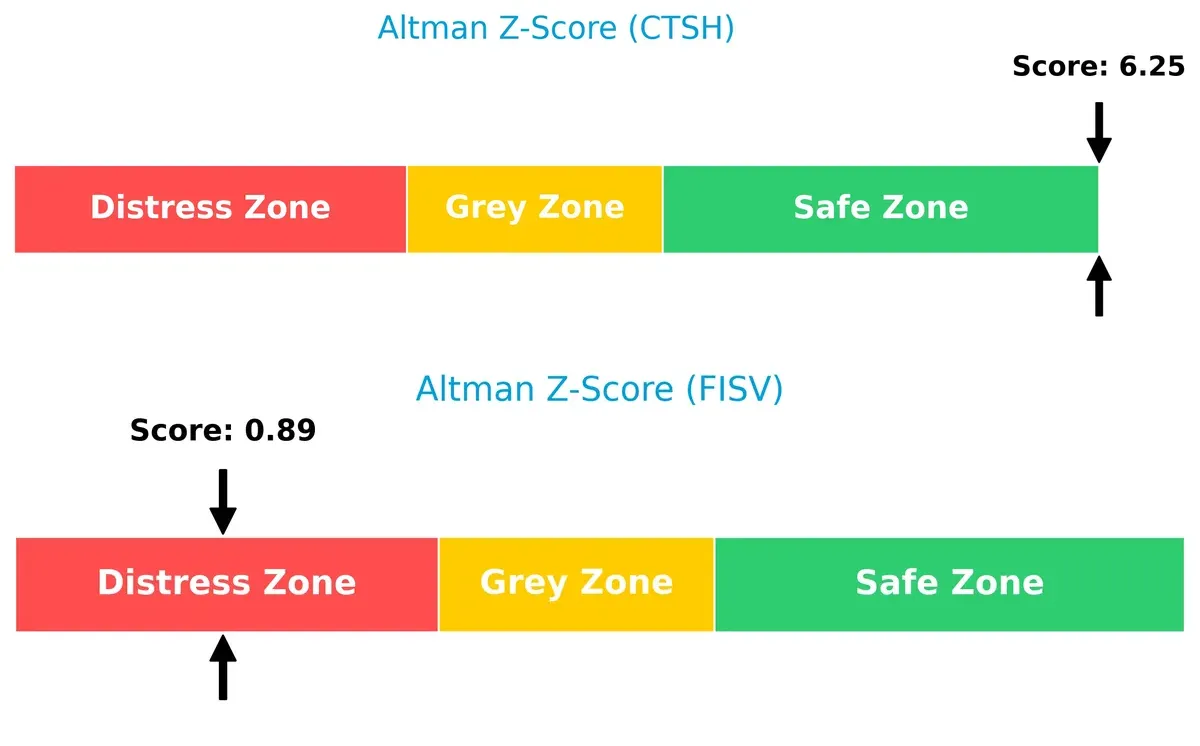
Bankruptcy Risk: Solvency Showdown
CTSH’s Altman Z-Score of 6.25 firmly places it in the safe zone. FISV’s 0.89 signals distress, implying a higher bankruptcy risk in this volatile cycle:
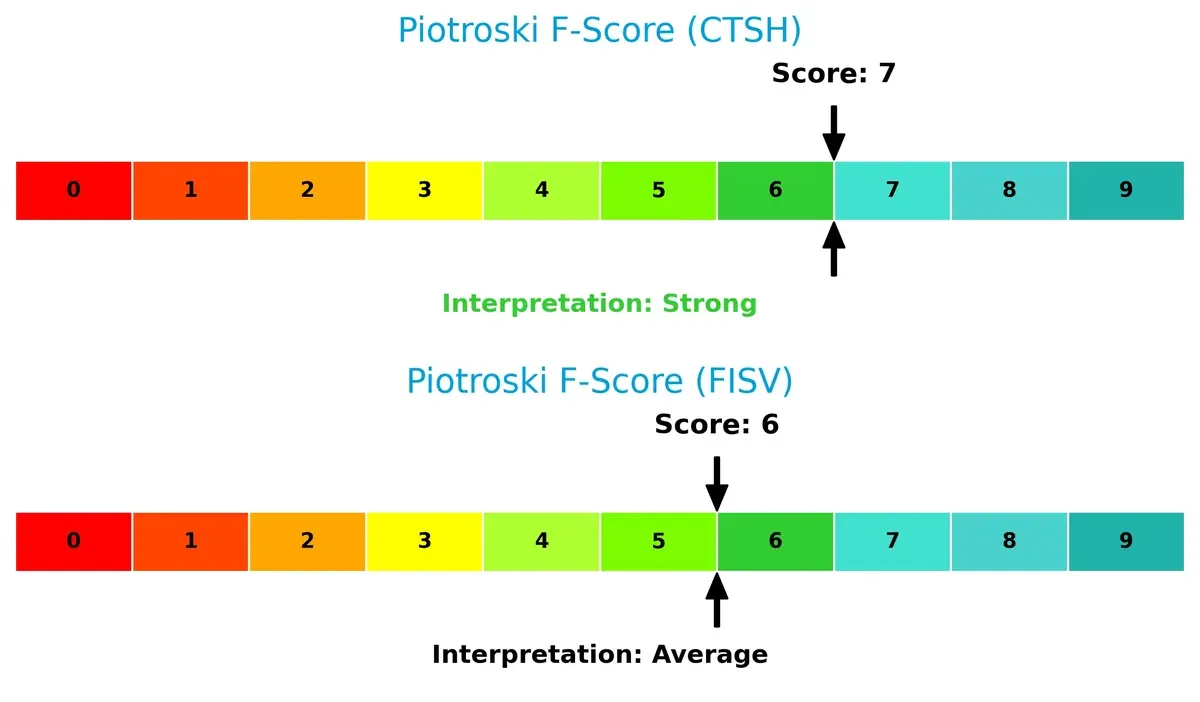
Financial Health: Quality of Operations
CTSH’s Piotroski F-Score of 7 indicates strong financial health. FISV scores 6, reflecting average operational quality and potential red flags in internal metrics:
How are the two companies positioned?
This section dissects the operational DNA of CTSH and FISV by comparing their revenue distribution and internal dynamics. The goal is to confront their economic moats to reveal which model offers the most resilient competitive advantage today.
Revenue Segmentation: The Strategic Mix
This visual comparison dissects how Cognizant Technology Solutions and Fiserv diversify their income streams and where their primary sector bets lie:
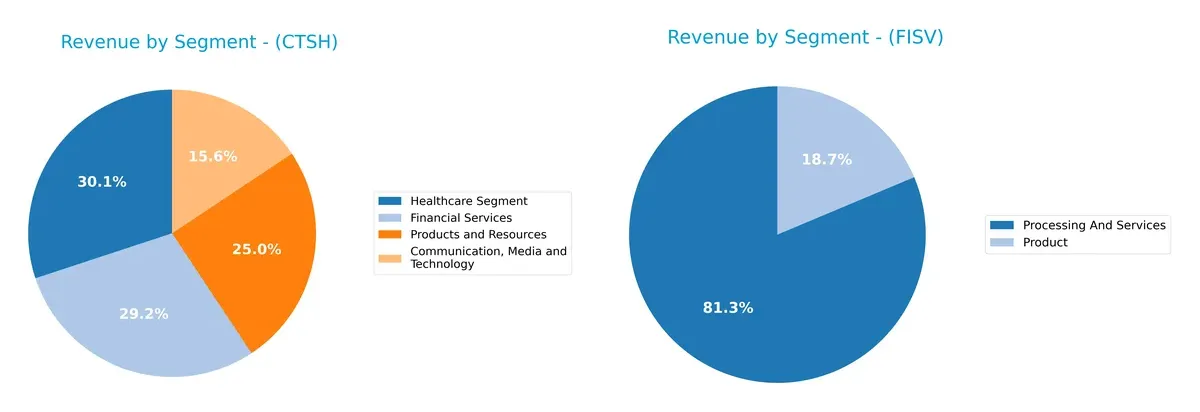
Cognizant’s revenue spreads evenly across Healthcare ($6.35B), Financial Services ($6.17B), and Products and Resources ($5.29B), showing a balanced portfolio. Fiserv, however, anchors $16.6B in Processing and Services, dwarfing its smaller Product segment ($3.8B). Cognizant’s diverse mix reduces concentration risk, while Fiserv’s heavy reliance on processing signals infrastructure dominance but greater exposure to sector-specific shifts.
Strengths and Weaknesses Comparison
This table compares the strengths and weaknesses of Cognizant Technology Solutions Corporation (CTSH) and Fiserv, Inc. (FISV) based on diversification, profitability, financial health, innovation, global presence, and market share:
CTSH Strengths
- Diverse revenue streams across four segments
- Favorable net margin and ROIC indicating efficient capital use
- Strong liquidity with current and quick ratios above 2
- Low debt and high interest coverage support financial stability
- Significant global presence with $15.8B North America and $6.1B Europe sales
FISV Strengths
- Higher net margin and favorable PE and PB ratios suggest strong profitability and valuation
- Favorable WACC and fixed asset turnover imply efficient capital costs and asset use
- Quick ratio above 1 supports short-term liquidity
- Large processing segment revenue around $16.6B underpins market leadership
CTSH Weaknesses
- Neutral ROE may indicate room for improving shareholder returns
- Dividend yield is neutral, limiting income appeal
- Geographic exposure shows moderate reliance on North America
FISV Weaknesses
- High debt-to-equity ratio (1.12) raises leverage concerns
- Low asset turnover (0.26) signals lower operational efficiency
- Neutral interest coverage ratio points to potential risk servicing debt
- Zero dividend yield may deter income-focused investors
CTSH’s diversified business model and strong balance sheet offer financial resilience and geographic breadth. FISV excels in profitability but faces leverage and efficiency challenges, which could affect capital allocation and risk profile. Both companies’ strengths and weaknesses shape their strategic priorities in competitive markets.
The Moat Duel: Analyzing Competitive Defensibility
A structural moat is the only true shield guarding long-term profits from relentless competition and margin pressure. Let’s dissect the competitive moats of two IT services giants:
Cognizant Technology Solutions Corporation: Intangible Assets and Scale Moat
Cognizant leverages deep industry expertise and global delivery scale to maintain stable margins around 17% EBIT. Its 4.4% ROIC premium over WACC signals value creation, but a declining ROIC trend warns of mounting competitive pressure in 2026.
Fiserv, Inc.: Network Effects and Ecosystem Lock-in
Fiserv’s payments platform enjoys strong network effects, reflected in a robust 27% EBIT margin and an expanding ROIC that outpaces WACC by 2.3%. Its very favorable moat status stems from accelerating profitability and ecosystem expansion, positioning it well for disruption and growth.
Moat Strength Showdown: Intangible Assets vs. Network Effects
Fiserv’s growing ROIC and higher margin profile reveal a deeper, more sustainable moat compared to Cognizant’s fading profitability edge. I see Fiserv as better equipped to defend market share amid evolving technology demands.
Which stock offers better returns?
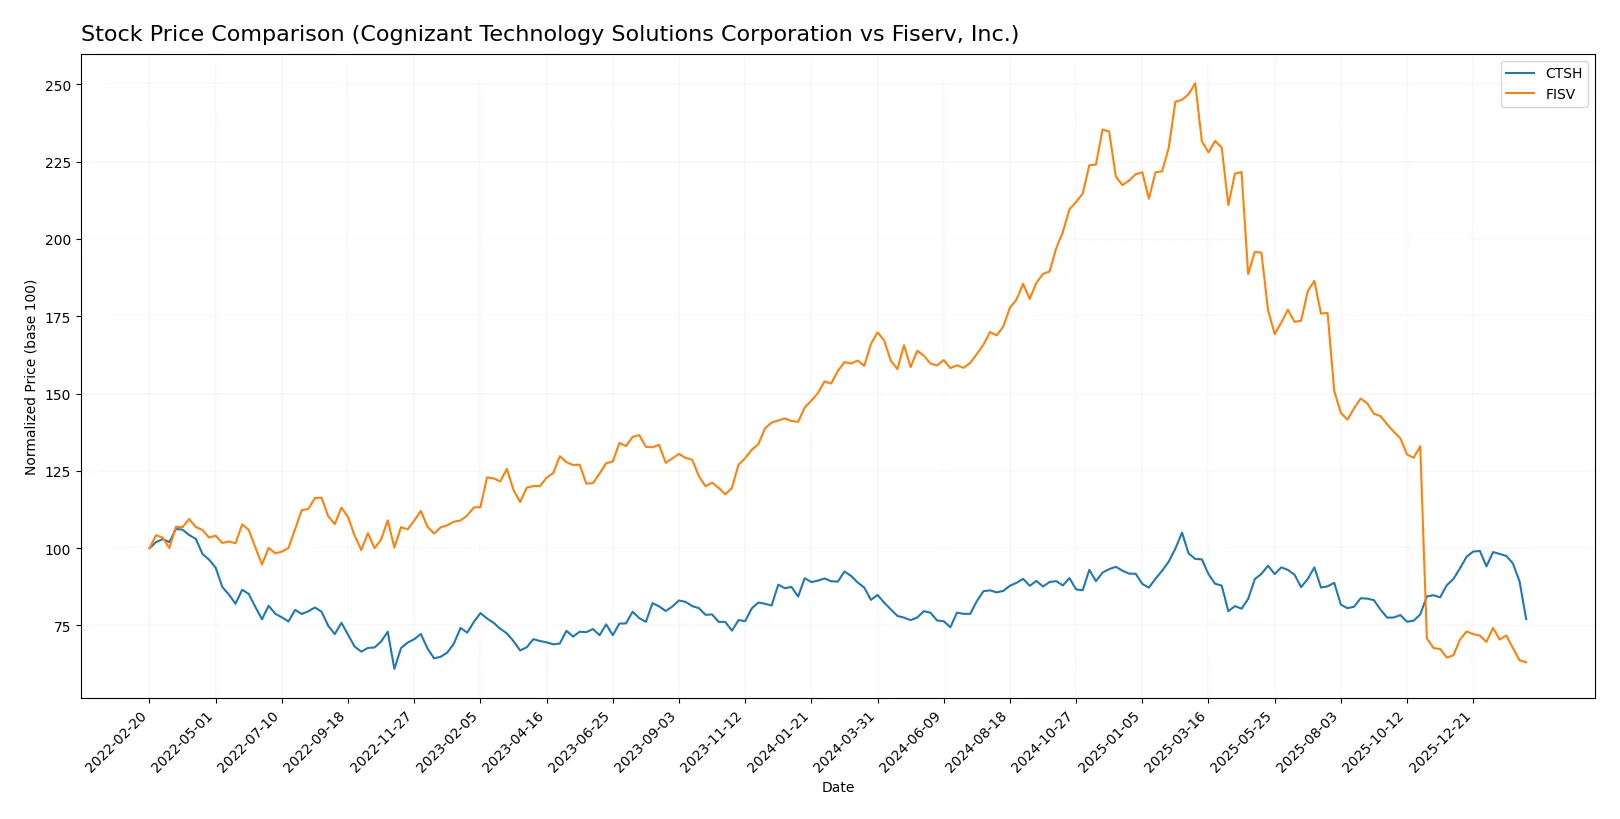
Over the past year, both stocks faced significant declines, with Cognizant showing moderate losses and Fiserv experiencing a steep drop amid heightened volatility.
Trend Comparison
Cognizant’s stock fell 7.44% over 12 months, marking a bearish trend with decelerating losses. The price ranged between 64.26 and 90.7, with recent declines accelerating to -14.36%.
Fiserv’s stock plunged 62.02% over the same period, confirming a bearish trend with accelerating deterioration. Volatility was high, swinging from 59.36 to 235.69, with recent losses of -3.43%.
Fiserv’s performance significantly lagged Cognizant’s, delivering the weaker market return and showing more pronounced price volatility and sharper downward momentum.
Target Prices
Analysts present a wide range of target prices, reflecting divergent views on near-term growth and valuation.
| Company | Target Low | Target High | Consensus |
|---|---|---|---|
| Cognizant Technology Solutions Corporation | 82 | 107 | 92.1 |
| Fiserv, Inc. | 62 | 180 | 104.18 |
Consensus target prices exceed current market prices significantly, signaling analyst optimism but also highlighting valuation risks given market volatility.

Don’t Let Luck Decide Your Entry Point
Optimize your entry points with our advanced ProRealTime indicators. You’ll get efficient buy signals with precise price targets for maximum performance. Start outperforming now!
How do institutions grade them?
Here are the latest institutional grades for Cognizant Technology Solutions Corporation and Fiserv, Inc.:
Cognizant Technology Solutions Corporation Grades
The table below summarizes recent grades from major financial institutions for Cognizant:
| Grading Company | Action | New Grade | Date |
|---|---|---|---|
| Morgan Stanley | Maintain | Equal Weight | 2026-02-05 |
| RBC Capital | Maintain | Sector Perform | 2026-02-05 |
| TD Cowen | Maintain | Hold | 2026-02-05 |
| Guggenheim | Maintain | Buy | 2026-01-28 |
| Citigroup | Maintain | Neutral | 2026-01-22 |
| Wells Fargo | Maintain | Overweight | 2026-01-14 |
| TD Cowen | Maintain | Hold | 2026-01-09 |
| UBS | Maintain | Neutral | 2025-12-08 |
| William Blair | Upgrade | Outperform | 2025-11-21 |
| Wells Fargo | Maintain | Overweight | 2025-10-30 |
Fiserv, Inc. Grades
The following table lists recent institutional grades for Fiserv:
| Grading Company | Action | New Grade | Date |
|---|---|---|---|
| Citigroup | Maintain | Neutral | 2026-02-11 |
| B. Riley Securities | Maintain | Neutral | 2026-02-11 |
| UBS | Maintain | Neutral | 2026-02-11 |
| Stephens & Co. | Maintain | Equal Weight | 2026-02-11 |
| Tigress Financial | Maintain | Buy | 2025-12-31 |
| Mizuho | Maintain | Outperform | 2025-12-22 |
| Morgan Stanley | Downgrade | Equal Weight | 2025-10-30 |
| JP Morgan | Maintain | Overweight | 2025-10-30 |
| RBC Capital | Maintain | Outperform | 2025-10-30 |
| Goldman Sachs | Downgrade | Neutral | 2025-10-30 |
Which company has the best grades?
Cognizant holds a more consistent mix of mid-to-high grades including Buy and Outperform, while Fiserv’s ratings skew neutral with some downgrades. Investors may interpret Cognizant’s grades as reflecting slightly stronger confidence from analysts.
Risks specific to each company
The following categories identify the critical pressure points and systemic threats facing both firms in the 2026 market environment:
1. Market & Competition
Cognizant Technology Solutions Corporation
- Faces intense competition in digital transformation and AI services, pressured by rapid tech innovation and client retention challenges.
Fiserv, Inc.
- Operates in a highly competitive payments and fintech landscape with pressure from agile startups and evolving fintech regulations.
2. Capital Structure & Debt
Cognizant Technology Solutions Corporation
- Maintains a very conservative debt profile with a debt-to-equity ratio of 0.1, indicating strong financial stability.
Fiserv, Inc.
- Carries a high debt-to-equity ratio of 1.12, raising concerns about financial leverage and interest burden.
3. Stock Volatility
Cognizant Technology Solutions Corporation
- Displays moderate volatility with beta near 0.96, reflecting typical tech sector market sensitivity.
Fiserv, Inc.
- Exhibits lower volatility with a beta of 0.78, suggesting more stable stock price movements relative to the market.
4. Regulatory & Legal
Cognizant Technology Solutions Corporation
- Subject to data privacy and outsourcing regulations in North America and Europe, with evolving compliance demands.
Fiserv, Inc.
- Faces significant regulatory scrutiny in payments and financial services, including fraud protection and transaction compliance.
5. Supply Chain & Operations
Cognizant Technology Solutions Corporation
- Relies on global delivery centers, exposing it to geopolitical risks and talent availability challenges.
Fiserv, Inc.
- Dependent on technology infrastructure and third-party vendors, vulnerable to operational disruptions and cybersecurity threats.
6. ESG & Climate Transition
Cognizant Technology Solutions Corporation
- Increasing pressure to improve ESG performance, particularly in social responsibility and governance transparency.
Fiserv, Inc.
- Faces challenges in reducing carbon footprint and enhancing sustainable fintech solutions amid rising investor scrutiny.
7. Geopolitical Exposure
Cognizant Technology Solutions Corporation
- Exposure to US-China tensions and European regulatory fragmentation impacting global service delivery.
Fiserv, Inc.
- Risks tied to global payment flows and sanctions compliance, especially in emerging markets and cross-border transactions.
Which company shows a better risk-adjusted profile?
Cognizant’s strongest risk lies in competitive disruption amid technological shifts, while Fiserv’s critical vulnerability is its elevated leverage. Cognizant’s superior balance sheet and Altman Z-score (6.25, safe zone) demonstrate stronger financial resilience. Recent data confirm Fiserv’s distress zone Altman Z-score (0.89) and high debt-to-equity ratio as red flags. Overall, Cognizant exhibits a better risk-adjusted profile with more prudent capital management and operational stability.
Final Verdict: Which stock to choose?
Cognizant Technology Solutions Corporation (CTSH) impresses with its operational efficiency and strong capital discipline. Its superpower lies in generating consistent value above its cost of capital, signaling solid economic moats. A point of vigilance is its declining profitability trend, which might temper future returns. CTSH suits investors with an Aggressive Growth appetite seeking steady value creation.
Fiserv, Inc. (FISV) stands out with a robust strategic moat anchored in its recurring revenue and growing profitability. Despite heavier leverage and weaker liquidity compared to CTSH, FISV’s expanding ROIC signals improving capital efficiency. It fits well in a GARP (Growth at a Reasonable Price) portfolio, appealing to those valuing growth with a degree of margin of safety.
If you prioritize stable value creation and efficient capital use, CTSH is the compelling choice due to its favorable financial health and consistent returns. However, if you seek accelerating profitability and a durable growth moat, FISV offers better upside potential despite higher financial risk. Both profiles require careful monitoring of their distinct risks.
Disclaimer: Investment carries a risk of loss of initial capital. The past performance is not a reliable indicator of future results. Be sure to understand risks before making an investment decision.
Go Further
I encourage you to read the complete analyses of Cognizant Technology Solutions Corporation and Fiserv, Inc. to enhance your investment decisions: