Home > Comparison > Technology > CTSH vs FIS
The strategic rivalry between Cognizant Technology Solutions Corporation and Fidelity National Information Services, Inc. shapes the evolution of the technology sector. Cognizant operates as a broad-based IT services provider with a diverse portfolio across healthcare and financial services. In contrast, Fidelity focuses on specialized technology solutions for banking and capital markets. This analysis will evaluate which company’s operational model offers the superior risk-adjusted return for a well-diversified portfolio.
Table of contents
Companies Overview
Cognizant and Fidelity National Information Services stand as pivotal players in the evolving technology services sector.
Cognizant Technology Solutions Corporation: Global IT Services Leader
Cognizant dominates the Information Technology Services sector with comprehensive consulting and outsourcing. Its revenue stems from diversified segments: Financial Services, Healthcare, Products and Resources, and Communications. In 2026, Cognizant focuses on AI, robotic process automation, and digital health to enhance customer experience and operational efficiency worldwide.
Fidelity National Information Services, Inc.: Financial Tech Innovator
Fidelity National Information Services specializes in technology solutions for merchants, banks, and capital markets. It generates revenue through Merchant, Banking, and Capital Market solutions. The firm’s strategic emphasis in 2026 lies in digital payment platforms, fraud prevention, and risk management to support global financial institutions’ evolving demands.
Strategic Collision: Similarities & Divergences
Both firms serve technology-driven clients but differ in approach: Cognizant offers a broad, multi-industry IT services platform, while Fidelity focuses on financial technology infrastructure. Their primary competition lies in digital payments and fraud detection. Cognizant’s diversified business contrasts with Fidelity’s specialized financial tech, defining distinct risk and growth profiles for investors.
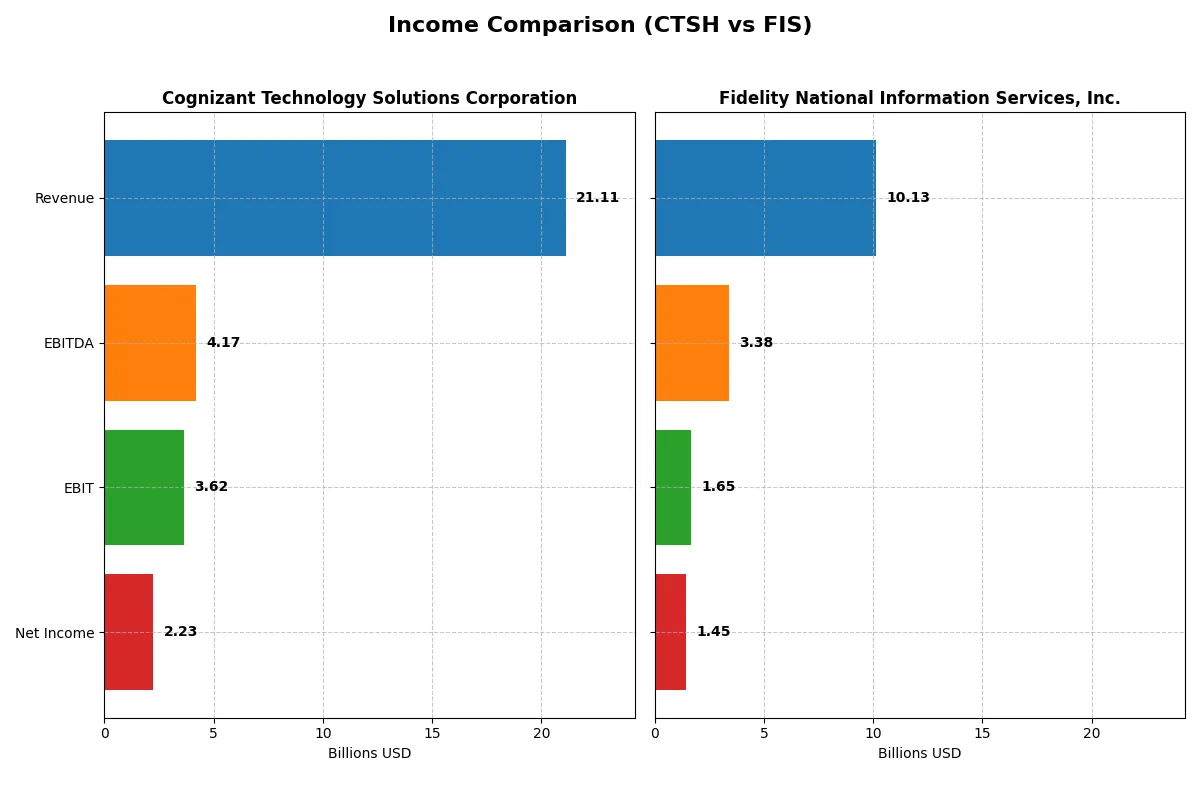
Income Statement Comparison
This data dissects the core profitability and scalability of both corporate engines to reveal who dominates the bottom line:
| Metric | Cognizant Technology Solutions Corporation (CTSH) | Fidelity National Information Services, Inc. (FIS) |
|---|---|---|
| Revenue | 21.1B | 10.1B |
| Cost of Revenue | 14.0B | 6.3B |
| Operating Expenses | 3.59B | 2.10B |
| Gross Profit | 7.12B | 3.80B |
| EBITDA | 4.17B | 3.39B |
| EBIT | 3.62B | 1.65B |
| Interest Expense | 37M | 351M |
| Net Income | 2.23B | 787M |
| EPS | 4.56 | 1.42 |
| Fiscal Year | 2025 | 2024 |
Income Statement Analysis: The Bottom-Line Duel
Comparing income statements reveals which company runs a more efficient and profitable corporate engine over recent years.
Cognizant Technology Solutions Corporation Analysis
Cognizant’s revenue climbed steadily from 18.5B in 2021 to 21.1B in 2025, showing consistent top-line growth. Gross margins remain healthy around 34%, while net margins hold at a favorable 10.6%. The 2025 year highlights operational momentum with a 21% EBIT increase, though net margin slightly dipped, signaling minor pressure on bottom-line efficiency.
Fidelity National Information Services, Inc. Analysis
FIS posted revenue of 10.1B in 2024, down from 13.9B in 2021, reflecting a longer-term decline. However, gross margin improved to 37.6%, and net margin expanded sharply to 14.3%, driven by strong cost control and a 20% EBIT growth last year. The 2024 net income recovery and margin expansion show significant operational leverage despite top-line headwinds.
Margin Strength vs. Revenue Growth
Cognizant delivers steady revenue expansion with stable margins, while FIS struggles top-line but posts impressive margin and net income growth. FIS’s superior margin profile and recent earnings surge mark it as the fundamental winner on profitability. Investors seeking margin power and efficiency may find FIS’s profile more attractive despite revenue challenges.
Financial Ratios Comparison
These vital ratios act as a diagnostic tool to expose the underlying fiscal health, valuation premiums, and capital efficiency of the companies compared below:
| Ratios | Cognizant Technology Solutions Corporation (CTSH) | Fidelity National Information Services, Inc. (FIS) |
|---|---|---|
| ROE | 15% | 9% |
| ROIC | 13% | 4% |
| P/E | 18 | 31 |
| P/B | 2.66 | 2.85 |
| Current Ratio | 2.34 | 0.85 |
| Quick Ratio | 2.34 | 0.85 |
| D/E | 0.10 | 0.74 |
| Debt-to-Assets | 7.6% | 34.2% |
| Interest Coverage | 95.4 | 4.87 |
| Asset Turnover | 1.02 | 0.30 |
| Fixed Asset Turnover | 14.0 | 11.6 |
| Payout ratio | 27% | 55% |
| Dividend yield | 1.53% | 1.79% |
| Fiscal Year | 2025 | 2024 |
Efficiency & Valuation Duel: The Vital Signs
Financial ratios act as a company’s DNA, exposing operational strengths and hidden risks that shape investor confidence and valuation.
Cognizant Technology Solutions Corporation
Cognizant delivers solid profitability with a 14.85% ROE and a favorable 10.56% net margin, signaling operational efficiency. Its P/E of 17.9 suggests a fairly valued stock, neither stretched nor cheap. Shareholders benefit from a 1.53% dividend yield, reflecting balanced capital allocation between returns and reinvestment.
Fidelity National Information Services, Inc.
Fidelity boasts a higher net margin of 14.32% but suffers from a weak 9.24% ROE and subpar 3.99% ROIC, indicating less efficient capital use. Its 30.8 P/E signals an expensive valuation. The 1.79% dividend yield offers modest income, but underlying operational challenges raise caution on sustainability.
Balanced Efficiency vs. Premium Valuation
Cognizant offers a superior balance of profitability and valuation, with stronger returns on equity and capital employed. Fidelity’s elevated P/E and weaker efficiency metrics present higher risk. Investors seeking operational stability may favor Cognizant, while those targeting yield with tolerance for valuation risk might consider Fidelity.
Which one offers the Superior Shareholder Reward?
I compare Cognizant Technology Solutions (CTSH) and Fidelity National Information Services (FIS) on dividends and buybacks. CTSH yields 1.53% with a 27% payout ratio and covers dividends 3.2x via FCF, signaling sustainable distributions. Its buyback program remains moderate but steady. FIS pays a higher 1.79% yield but with a 55% payout ratio, stressing cash flow amid heavy debt (debt/assets 34%). FIS’s buybacks are less consistent, given its weaker operating cash flow and leverage. CTSH’s balanced dividend and buyback, supported by strong free cash flow and low leverage, offer superior long-term shareholder reward in 2026.
Comparative Score Analysis: The Strategic Profile
The radar chart reveals the fundamental DNA and trade-offs of both firms, highlighting their financial strengths and vulnerabilities across key metrics:
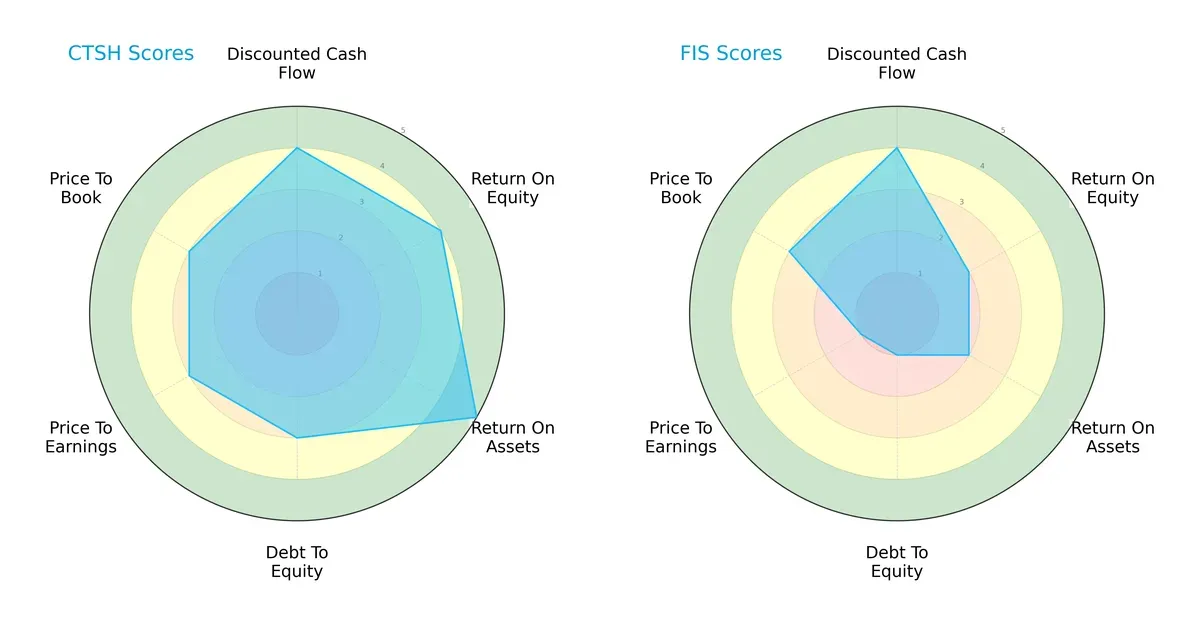
Cognizant Technology Solutions (CTSH) shows a balanced profile with strong ROE (4) and ROA (5) scores, reflecting efficient profit generation and asset utilization. Its moderate debt-to-equity (3) and valuation scores (PE 3, PB 3) suggest prudent capital structure and fair pricing. Conversely, Fidelity National Information Services (FIS) relies heavily on discounted cash flow (4) but scores poorly in profitability (ROE 2, ROA 2) and financial risk (debt-to-equity 1). FIS’s weak valuation metrics (PE 1) highlight potential overvaluation or market skepticism. Overall, CTSH offers a more stable and diversified financial profile, while FIS depends on a single edge in cash flow valuation.
Bankruptcy Risk: Solvency Showdown
The Altman Z-Score delta reveals a stark contrast in long-term survival prospects in this cycle:
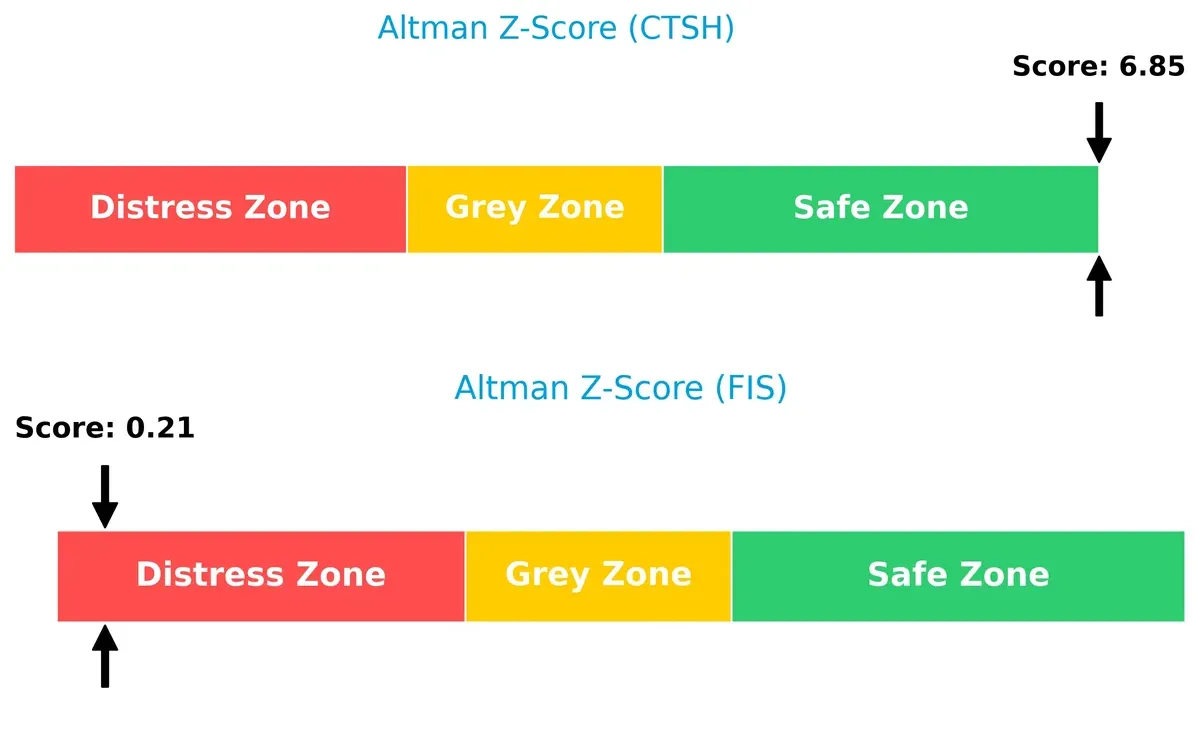
CTSH’s robust score of 6.85 places it firmly in the safe zone, indicating strong solvency and low bankruptcy risk. FIS’s alarmingly low score of 0.21 signals distress, suggesting a high probability of financial distress if current conditions persist. This divergence underscores CTSH’s financial resilience compared to FIS’s precarious position.
Financial Health: Quality of Operations
Piotroski F-Scores highlight operational quality and internal financial health differences:
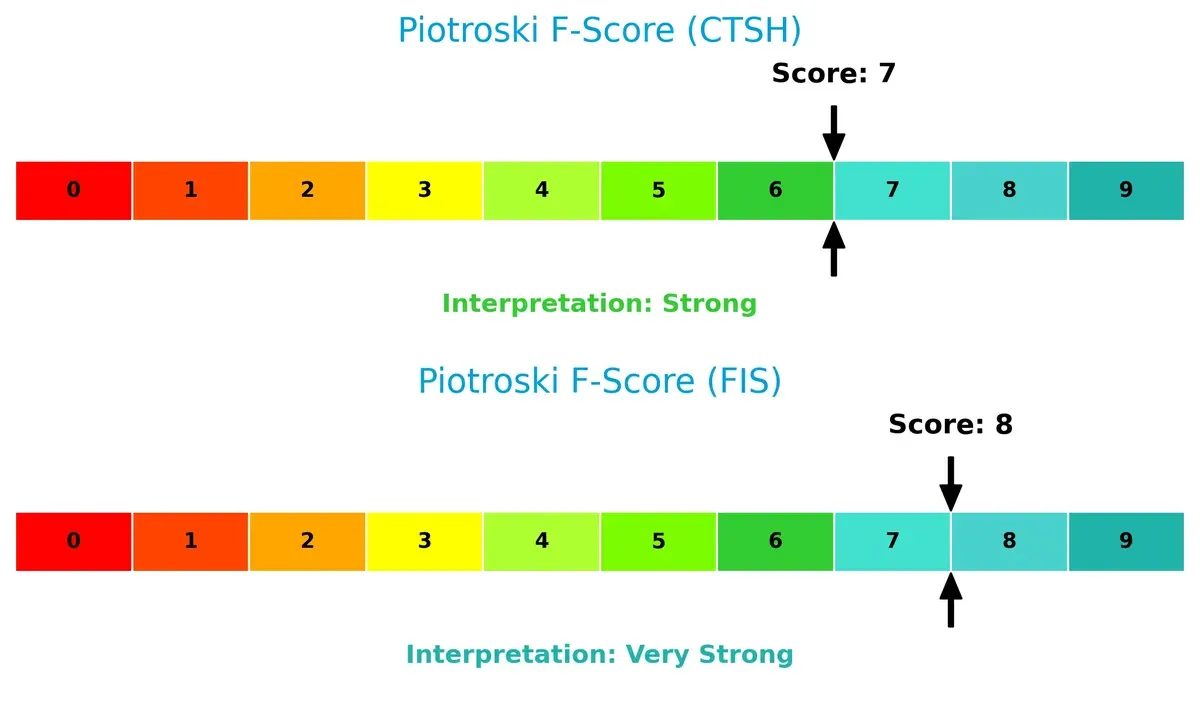
FIS scores an impressive 8, classified as very strong, reflecting excellent profitability, liquidity, and efficiency. CTSH’s solid score of 7 still indicates strong financial health but with slightly more caution warranted. Neither firm shows glaring red flags, but FIS’s higher score suggests superior internal metrics despite its solvency concerns, requiring investors to weigh operational quality against financial risk.
How are the two companies positioned?
This section dissects Cognizant and FIS’s operational DNA by comparing their revenue distribution and internal dynamics. The goal is to confront their economic moats to reveal which model delivers the most resilient competitive advantage today.
Revenue Segmentation: The Strategic Mix
This visual comparison dissects how Cognizant Technology Solutions and Fidelity National Information Services diversify their income streams and where their primary sector bets lie:
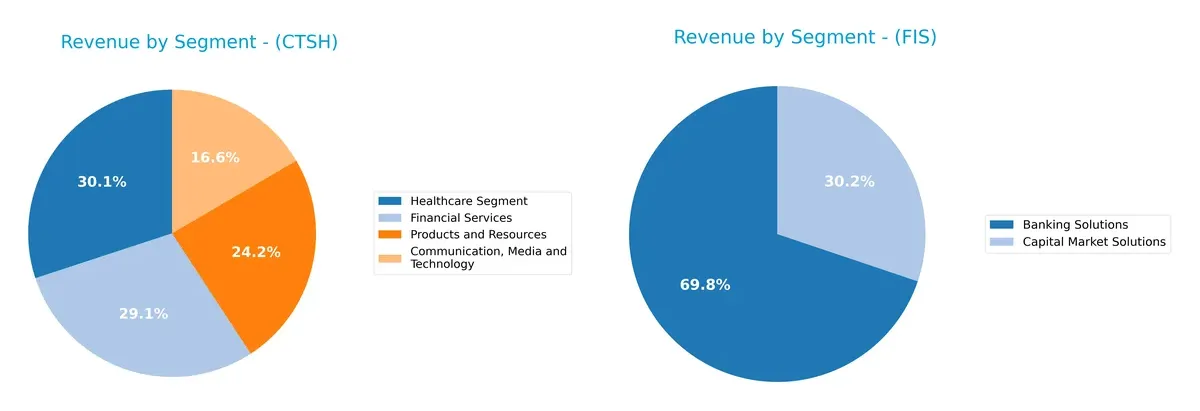
Cognizant pivots on a balanced mix across Healthcare (5.9B), Financial Services (5.7B), and Products (4.8B), showing robust diversification. In contrast, Fidelity leans heavily on Banking Solutions (6.9B), dwarfing Capital Market Solutions (3B). Cognizant’s spread reduces concentration risk, while Fidelity’s dominance in banking signals infrastructure lock-in but higher sector dependency. This split reveals distinct strategic plays in tech-enabled financial services.
Strengths and Weaknesses Comparison
This table compares the strengths and weaknesses of Cognizant Technology Solutions Corporation (CTSH) and Fidelity National Information Services, Inc. (FIS):
CTSH Strengths
- Diverse revenue streams across four segments
- Favorable net margin at 10.56%
- Strong liquidity ratios above 2.3
- Low debt-to-equity of 0.1
- High asset turnover at 1.02
- Global presence with $14.7B North America and $5.7B Europe revenue
FIS Strengths
- Higher net margin at 14.32%
- Favorable WACC at 6.18% supports capital efficiency
- Significant revenue in banking solutions at $6.9B
- Favorable fixed asset turnover at 11.56
- Moderate dividend yield of 1.79%
- Solid North America revenue of $7.8B
CTSH Weaknesses
- ROE neutral at 14.85% suggests moderate equity returns
- PE ratio neutral at 17.9 limits valuation upside
- Dividend yield neutral at 1.53%
- Concentrated healthcare and financial services revenue exposure
- No unfavorable ratios reported
FIS Weaknesses
- ROE and ROIC unfavorable at 9.24% and 3.99% respectively
- Low current ratio at 0.85 indicates liquidity risk
- High PE of 30.8 may imply overvaluation
- Debt-to-assets at 34.16% raises leverage concerns
- Asset turnover weak at 0.3 suggests operational inefficiency
Overall, CTSH shows a well-diversified business model with strong financial health and operational efficiency. FIS demonstrates higher profitability but faces challenges in leverage, liquidity, and operational turnover. These factors shape each company’s strategic priorities in managing risk and growth.
The Moat Duel: Analyzing Competitive Defensibility
A structural moat alone shields long-term profits from relentless competition erosion. Let’s dissect how these moats protect value in 2026:
Cognizant Technology Solutions Corporation: Intangible Assets Driving Consistent Value
Cognizant’s moat stems from deep client relationships and specialized technology consulting expertise. This yields stable 17% EBIT margins and 4.3% ROIC premium over WACC. However, its declining ROIC trend signals margin pressure from rising competition and innovation demands.
Fidelity National Information Services, Inc.: Operational Scale with Emerging Efficiency
FIS relies on scale and integrated payment solutions, outperforming peers with a 37.6% gross margin but currently shedding value with ROIC below WACC. Yet, a sharp ROIC rebound (+210%) suggests operational strides that could fortify its competitive stance in digital banking platforms.
Intangible Assets vs. Scale Efficiency: Who Holds the Deeper Moat?
Cognizant maintains a wider moat by consistently creating value despite margin erosion. FIS’s improving ROIC trend is promising but its current value destruction is a red flag. Cognizant is better positioned to defend its market share amid intensifying sector competition.
Which stock offers better returns?
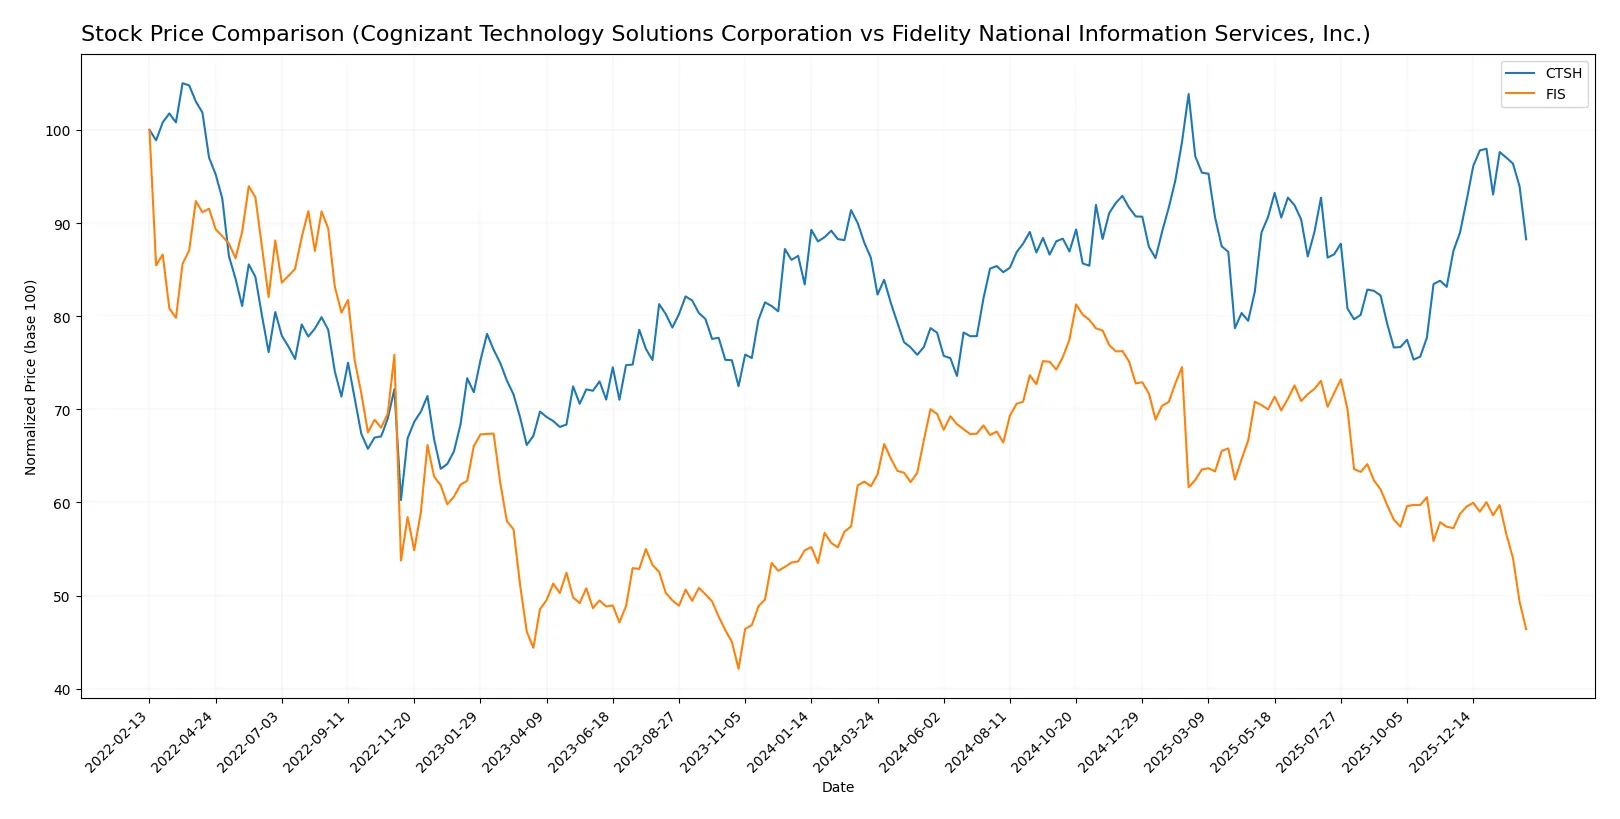
The past year saw Cognizant Technology Solutions Corporation’s share price rising steadily, while Fidelity National Information Services, Inc. faced a sharp decline with notable price volatility and weakening trading momentum.
Trend Comparison
Cognizant’s stock gained 2.32% over the past 12 months, showing a bullish trend with accelerating momentum and a high near 90.7. The recent three-month trend remained positive but decelerated to 1.45%.
Fidelity’s stock dropped 24.87% over the same period, reflecting a bearish trend with decelerating downside momentum and a low near 51.93. The recent quarter worsened with an 18.95% decline and increased volatility.
Comparing both, Cognizant outperformed Fidelity by delivering positive returns. Fidelity experienced the steepest market loss and higher recent selling pressure.
Target Prices
Analysts provide a cautiously optimistic target consensus for both Cognizant Technology Solutions and Fidelity National Information Services.
| Company | Target Low | Target High | Consensus |
|---|---|---|---|
| Cognizant Technology Solutions Corporation | 82 | 107 | 93.2 |
| Fidelity National Information Services, Inc. | 69 | 85 | 75.43 |
Cognizant’s target consensus sits about 21% above its current price of 77.08, signaling moderate upside potential. Fidelity’s consensus target exceeds its 51.93 price by roughly 45%, indicating stronger analyst confidence in growth.

Don’t Let Luck Decide Your Entry Point
Optimize your entry points with our advanced ProRealTime indicators. You’ll get efficient buy signals with precise price targets for maximum performance. Start outperforming now!
How do institutions grade them?
Cognizant Technology Solutions Corporation Grades
The table below shows recent grades from recognized financial institutions for Cognizant Technology Solutions Corporation.
| Grading Company | Action | New Grade | Date |
|---|---|---|---|
| TD Cowen | Maintain | Hold | 2026-02-05 |
| Morgan Stanley | Maintain | Equal Weight | 2026-02-05 |
| RBC Capital | Maintain | Sector Perform | 2026-02-05 |
| Guggenheim | Maintain | Buy | 2026-01-28 |
| Citigroup | Maintain | Neutral | 2026-01-22 |
| Wells Fargo | Maintain | Overweight | 2026-01-14 |
| TD Cowen | Maintain | Hold | 2026-01-09 |
| UBS | Maintain | Neutral | 2025-12-08 |
| William Blair | Upgrade | Outperform | 2025-11-21 |
| UBS | Maintain | Neutral | 2025-10-30 |
Fidelity National Information Services, Inc. Grades
The table below shows recent grades from recognized financial institutions for Fidelity National Information Services, Inc.
| Grading Company | Action | New Grade | Date |
|---|---|---|---|
| Truist Securities | Maintain | Hold | 2025-11-19 |
| UBS | Maintain | Buy | 2025-11-06 |
| RBC Capital | Maintain | Outperform | 2025-11-06 |
| JP Morgan | Maintain | Overweight | 2025-11-06 |
| Truist Securities | Maintain | Hold | 2025-10-24 |
| Keefe, Bruyette & Woods | Maintain | Outperform | 2025-10-01 |
| UBS | Upgrade | Buy | 2025-09-30 |
| Keefe, Bruyette & Woods | Maintain | Outperform | 2025-08-06 |
| UBS | Maintain | Neutral | 2025-08-06 |
| Truist Securities | Maintain | Hold | 2025-07-17 |
Which company has the best grades?
Fidelity National Information Services, Inc. consistently receives higher grades, including multiple “Buy” and “Outperform” ratings. Cognizant has mostly “Hold” and “Neutral” grades, with fewer upgrades. This may influence investor sentiment and portfolio positioning.
Risks specific to each company
The following categories identify the critical pressure points and systemic threats facing both firms in the 2026 market environment:
1. Market & Competition
Cognizant Technology Solutions Corporation
- Faces intense competition in IT services with pressure to innovate in AI and digital transformation.
Fidelity National Information Services, Inc.
- Operates in a competitive fintech space, challenged by agile startups and evolving payment technologies.
2. Capital Structure & Debt
Cognizant Technology Solutions Corporation
- Maintains a very conservative debt profile with a low debt-to-equity ratio at 0.1, minimizing financial risk.
Fidelity National Information Services, Inc.
- Shows a leveraged balance sheet with debt-to-equity around 0.74, increasing vulnerability to interest rate hikes.
3. Stock Volatility
Cognizant Technology Solutions Corporation
- Exhibits moderate stock volatility with a beta near 0.96, reflecting market sensitivity typical for tech services.
Fidelity National Information Services, Inc.
- Slightly lower beta at 0.9 suggests marginally less sensitivity but recent price range shows heightened short-term swings.
4. Regulatory & Legal
Cognizant Technology Solutions Corporation
- Subject to data privacy and cybersecurity regulations across multiple jurisdictions, posing compliance costs.
Fidelity National Information Services, Inc.
- Faces stringent financial regulations and compliance risks in banking and capital markets segments worldwide.
5. Supply Chain & Operations
Cognizant Technology Solutions Corporation
- Relies on global delivery centers; disruptions in offshore labor markets could affect operational efficiency.
Fidelity National Information Services, Inc.
- Dependent on stable technology infrastructure and vendor relationships; hardware supply and software integration risks exist.
6. ESG & Climate Transition
Cognizant Technology Solutions Corporation
- Investing in sustainability initiatives but faces challenges in reducing carbon footprint in data centers.
Fidelity National Information Services, Inc.
- Increasing pressure to enhance ESG disclosures and align products with green finance trends, impacting costs.
7. Geopolitical Exposure
Cognizant Technology Solutions Corporation
- Exposure to geopolitical tensions affecting offshore outsourcing and cross-border data flows.
Fidelity National Information Services, Inc.
- Risks tied to global trade policies and sanctions impacting international banking and payment operations.
Which company shows a better risk-adjusted profile?
Cognizant’s strongest risk is market competition, given rapid technological shifts demanding innovation. Fidelity’s primary risk lies in its capital structure, with elevated debt levels heightening financial strain. Cognizant’s robust balance sheet and favorable liquidity metrics underpin a superior risk-adjusted profile. Notably, Fidelity’s Altman Z-score signals distress, underscoring solvency concerns amid market pressures.
Final Verdict: Which stock to choose?
Cognizant Technology Solutions Corporation (CTSH) excels as a cash-generating machine with disciplined capital allocation and a strong balance sheet. Its slightly declining ROIC signals a point of vigilance, but its robust operational efficiency supports steady value creation. CTSH suits portfolios targeting aggressive growth with moderate risk tolerance.
Fidelity National Information Services, Inc. (FIS) boasts a strategic moat rooted in its entrenched position in financial technology and recurring revenue streams. Despite a shaky balance sheet and value erosion, its improving profitability and strong Piotroski score suggest a turnaround potential. FIS fits investors seeking GARP—growth at a reasonable price—with a higher risk appetite.
If you prioritize consistent value creation and operational stability, CTSH outshines as the compelling choice due to its favorable financial health and efficiency metrics. However, if you seek a high-risk, high-reward scenario with turnaround prospects, FIS offers better growth momentum despite its financial leverage and recent price weakness. Both demand careful risk assessment aligned with your investment profile.
Disclaimer: Investment carries a risk of loss of initial capital. The past performance is not a reliable indicator of future results. Be sure to understand risks before making an investment decision.
Go Further
I encourage you to read the complete analyses of Cognizant Technology Solutions Corporation and Fidelity National Information Services, Inc. to enhance your investment decisions: