Home > Comparison > Technology > CTSH vs EPAM
The strategic rivalry between Cognizant Technology Solutions and EPAM Systems defines the evolving landscape of the Information Technology Services sector. Cognizant operates as a capital-intensive multinational consulting powerhouse with diverse industry segments, while EPAM focuses on high-margin digital platform engineering and software development. This analysis pits Cognizant’s scale against EPAM’s specialization to identify which trajectory offers superior risk-adjusted returns for a diversified portfolio.
Table of contents
Companies Overview
Cognizant and EPAM Systems define the cutting edge of global IT services with strong market relevance.
Cognizant Technology Solutions Corporation: Global IT Services Powerhouse
Cognizant dominates the professional services market by offering consulting, technology, and outsourcing across financial, healthcare, and communications sectors. Its revenue engine relies on digital transformation, AI, and robotic process automation. In 2026, the company focuses on enhancing customer experience and operational improvements in healthcare and financial services, leveraging its broad industry footprint.
EPAM Systems, Inc.: Digital Engineering Innovator
EPAM specializes in digital platform engineering and software development with comprehensive infrastructure and support services. It drives revenue through engineering, automation, and consulting across financial, healthcare, and tech sectors. Its 2026 strategy emphasizes integrated engineering practices, smart automation, and advanced digital and service design solutions, targeting innovation in software quality and digital transformation.
Strategic Collision: Similarities & Divergences
Both firms compete fiercely in IT services but differ in approach: Cognizant emphasizes a broad, multi-industry outsourcing model, while EPAM pursues deep digital engineering and automation. Their battleground is digital transformation across finance and healthcare. Cognizant’s scale contrasts with EPAM’s engineering specialization, creating distinct risk and growth profiles for investors.
Income Statement Comparison
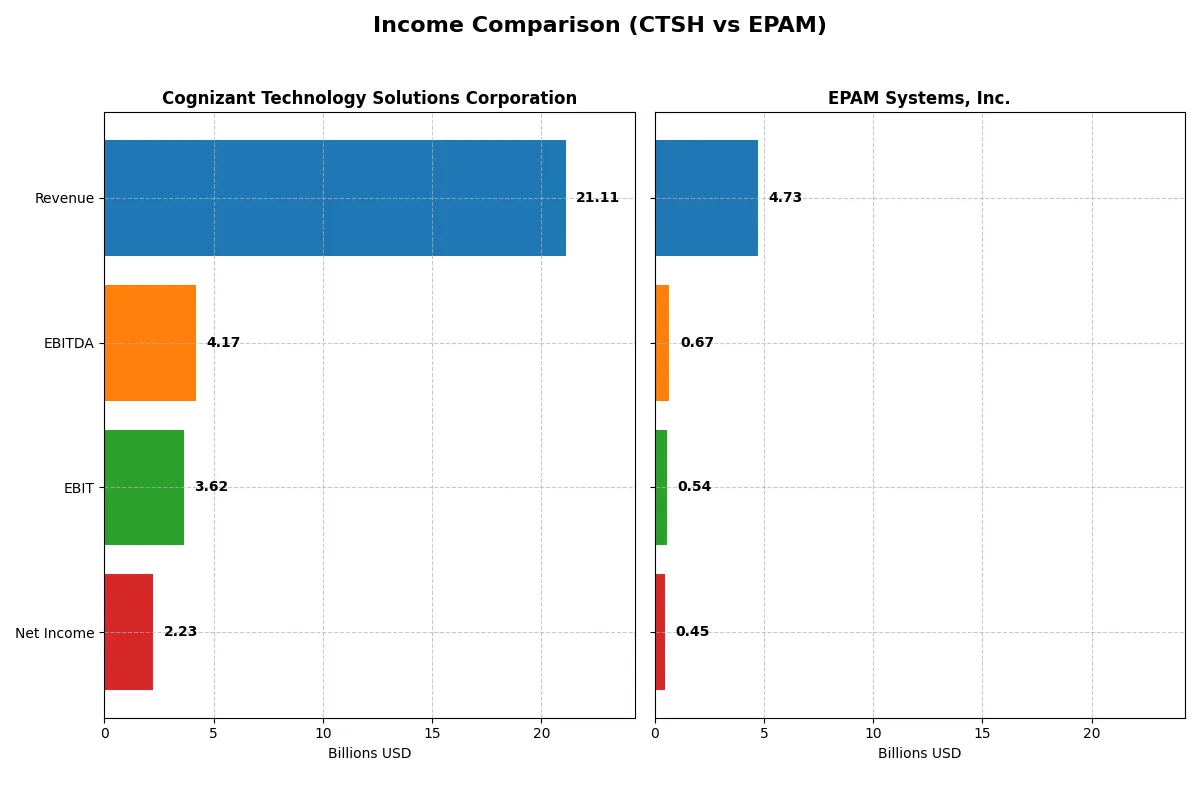
This data dissects the core profitability and scalability of both corporate engines to reveal who dominates the bottom line:
| Metric | Cognizant Technology Solutions Corporation (CTSH) | EPAM Systems, Inc. (EPAM) |
|---|---|---|
| Revenue | 21.1B | 4.7B |
| Cost of Revenue | 14.0B | 3.3B |
| Operating Expenses | 3.6B | 906M |
| Gross Profit | 7.1B | 1.5B |
| EBITDA | 4.2B | 672M |
| EBIT | 3.6B | 545M |
| Interest Expense | 37M | 0 |
| Net Income | 2.2B | 455M |
| EPS | 4.56 | 7.93 |
| Fiscal Year | 2025 | 2024 |
Income Statement Analysis: The Bottom-Line Duel
This income statement comparison reveals which company runs a more efficient and profitable corporate engine through recent financial performance.
Cognizant Technology Solutions Corporation Analysis
Cognizant’s revenue rose steadily from $18.5B in 2021 to $21.1B in 2025, showing a 14% growth over five years. Gross margin remains robust at 33.7%, and EBIT margin climbed to 17.2% in 2025, signaling healthy operational efficiency. However, a slight dip in net margin to 10.6% in 2025 indicates some margin pressure despite revenue growth momentum.
EPAM Systems, Inc. Analysis
EPAM grew revenue aggressively by 78% from 2020 to 2024, reaching $4.7B, but posted just 0.8% revenue growth last year. Its gross margin stands at a solid 30.7%, with EBIT margin at 11.5%, reflecting strong cost control. Net margin improved to 9.6% in 2024, supported by favorable net income and EPS growth, despite overall margin compression over the longer term.
Margin Strength vs. Growth Momentum
Cognizant leads in margin quality with a higher gross and EBIT margin, underpinning superior profitability. EPAM outpaces in revenue and net income growth, demonstrating dynamic expansion but with thinner margins. Investors seeking stable margin power may prefer Cognizant’s profile, while those valuing high growth momentum might lean toward EPAM’s accelerating top-line and earnings gains.
Financial Ratios Comparison
These vital ratios act as a diagnostic tool to expose the underlying fiscal health, valuation premiums, and capital efficiency of the companies analyzed:
| Ratios | Cognizant Technology Solutions Corporation (CTSH) | EPAM Systems, Inc. (EPAM) |
|---|---|---|
| ROE | 14.85% | 12.52% |
| ROIC | 12.31% | 10.67% |
| P/E | 17.90 | 29.47 |
| P/B | 2.66 | 3.69 |
| Current Ratio | 2.34 | 2.96 |
| Quick Ratio | 2.34 | 2.96 |
| D/E | 0.10 | 0.04 |
| Debt-to-Assets | 7.61% | 3.44% |
| Interest Coverage | 95.38 | 0 |
| Asset Turnover | 1.02 | 1.00 |
| Fixed Asset Turnover | 14.02 | 14.07 |
| Payout ratio | 27.35% | 0% |
| Dividend yield | 1.53% | 0% |
| Fiscal Year | 2025 | 2024 |
Efficiency & Valuation Duel: The Vital Signs
Financial ratios act as a company’s DNA, exposing hidden risks and operational strengths crucial for informed investment decisions.
Cognizant Technology Solutions Corporation
Cognizant displays solid profitability with a 14.85% ROE and a favorable 10.56% net margin, signaling efficient operations. Its valuation sits neutrally at a 17.9 P/E and 2.66 P/B, indicating fair pricing. The company returns value with a 1.53% dividend yield, balancing shareholder rewards and steady capital allocation.
EPAM Systems, Inc.
EPAM’s profitability is moderate, with a 12.52% ROE and a neutral 9.61% net margin. However, its valuation appears stretched at a 29.47 P/E and 3.69 P/B, reflecting premium market expectations. EPAM pays no dividend, instead reinvesting aggressively, which suggests a growth-focused capital strategy.
Valuation Discipline vs. Growth Ambition
Cognizant offers a balanced risk-reward profile with efficient profitability and a reasonable valuation. EPAM’s premium multiples and reinvestment approach carry higher risk but potential growth upside. Investors seeking operational safety may prefer Cognizant; growth seekers might lean toward EPAM’s ambitious profile.
Which one offers the Superior Shareholder Reward?
I compare Cognizant Technology Solutions Corporation (CTSH) and EPAM Systems, Inc. (EPAM) on their distribution strategies and shareholder returns. CTSH pays a consistent dividend with a yield around 1.5% and a sustainable payout ratio near 27%, backed by solid free cash flow coverage above 85%. It also runs moderate buybacks, enhancing total shareholder return steadily. EPAM, in contrast, pays no dividends but reinvests heavily in growth, R&D, and acquisitions, supported by a robust free cash flow per share (~9.2) and strong operating cash flow coverage ratios. EPAM’s aggressive reinvestment strategy fuels higher growth potential but lacks immediate income. CTSH’s combination of dividends and buybacks offers a more balanced, sustainable total return. I conclude CTSH provides superior shareholder reward for income-focused investors in 2026, while EPAM suits growth-oriented portfolios willing to forgo dividends.
Comparative Score Analysis: The Strategic Profile
The radar chart unveils the fundamental DNA and trade-offs of Cognizant Technology Solutions Corporation and EPAM Systems, Inc.:
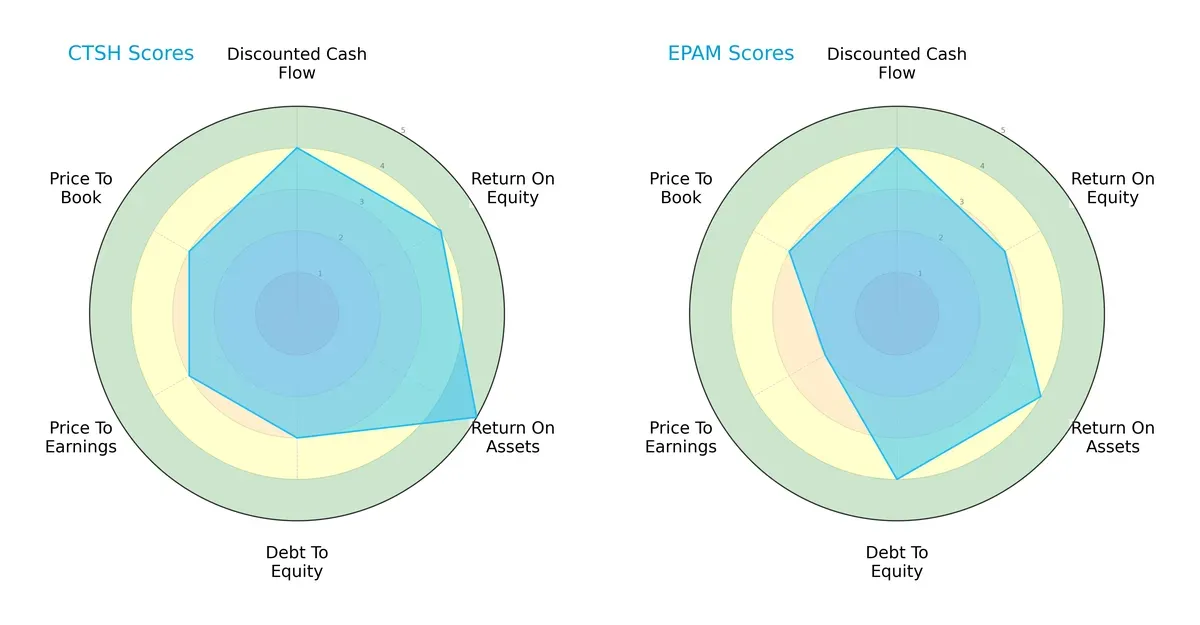
Cognizant leads with a stronger ROE (4 vs. 3) and ROA (5 vs. 4), reflecting superior operational efficiency. EPAM holds an edge in debt management (4 vs. 3), suggesting a more conservative capital structure. Both tie on DCF (4) and P/B (3), but Cognizant’s slightly better P/E score (3 vs. 2) hints at more attractive valuation. Overall, Cognizant offers a balanced profile, while EPAM leans on financial prudence and lower leverage.
Bankruptcy Risk: Solvency Showdown
The Altman Z-Score comparison highlights both firms firmly in the safe zone, with EPAM at 7.99 and Cognizant at 6.85:
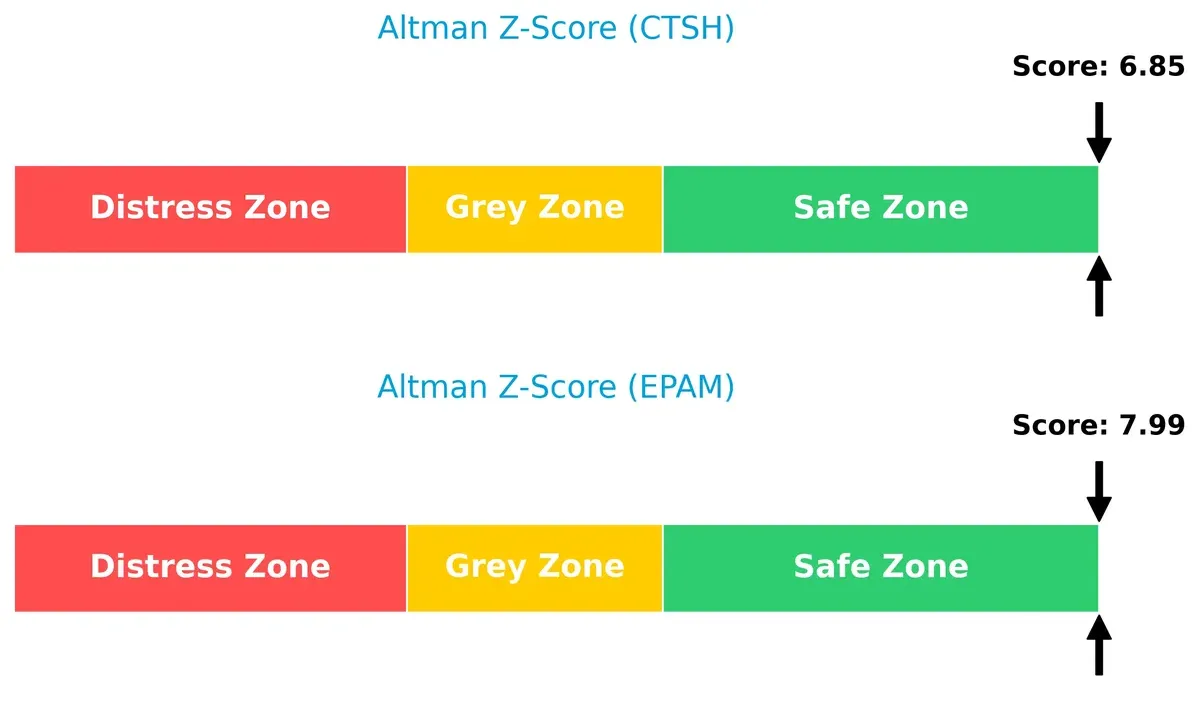
EPAM’s higher score indicates marginally stronger solvency, reducing bankruptcy risk in this volatile cycle. Both companies demonstrate solid financial stability for long-term investors.
Financial Health: Quality of Operations
Cognizant and EPAM share an identical Piotroski F-Score of 7, signaling strong financial health and robust internal metrics:
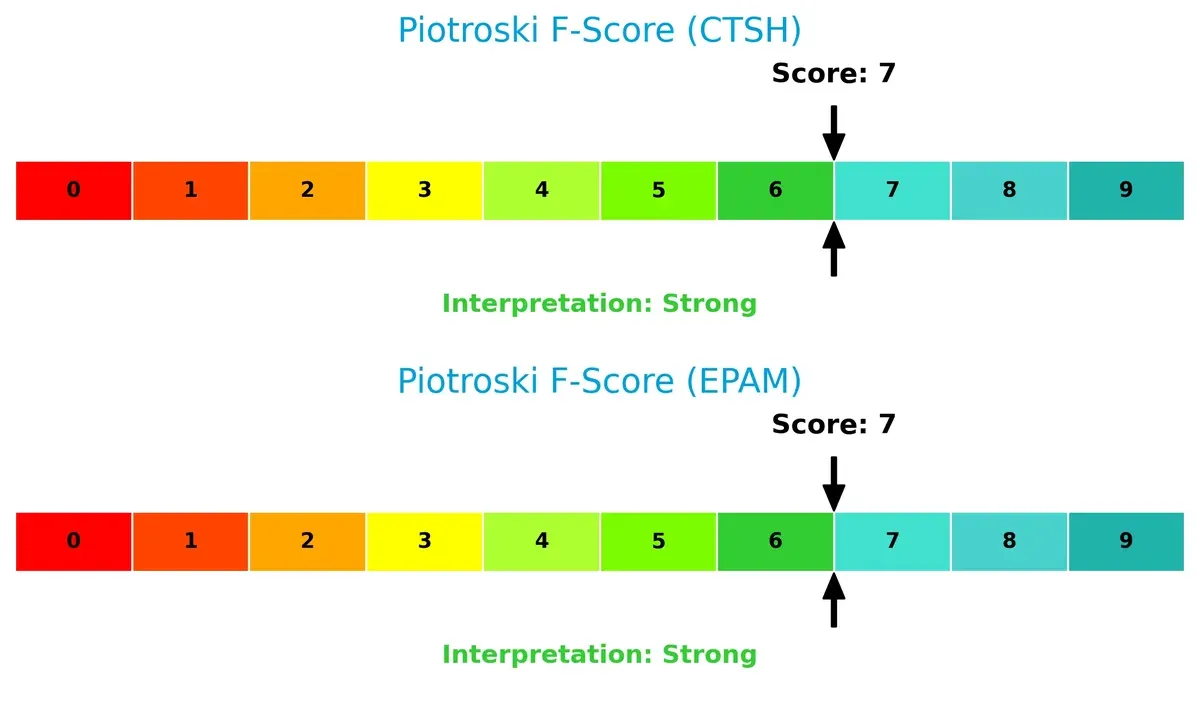
Neither company shows red flags, but this score confirms both firms maintain efficient profitability, liquidity, and operational quality, supporting their investment cases.
How are the two companies positioned?
This section dissects the operational DNA of Cognizant and EPAM by comparing their revenue distribution and internal strengths and weaknesses. The goal is to confront their economic moats and reveal which model offers a more resilient competitive advantage today.
Revenue Segmentation: The Strategic Mix
This comparison dissects how Cognizant Technology Solutions Corporation and EPAM Systems, Inc. diversify income streams and where their primary sector bets lie:
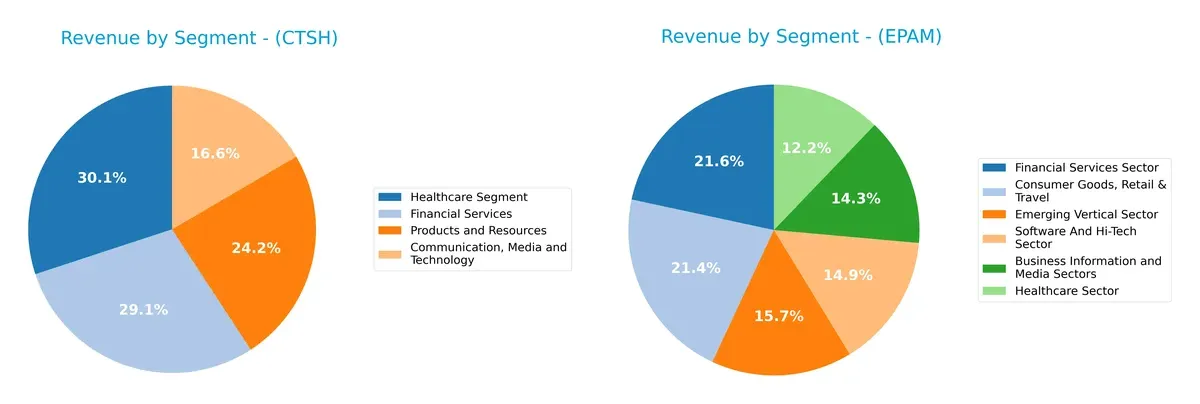
Cognizant anchors revenue in Healthcare ($5.9B) and Financial Services ($5.7B), showing a balanced mix across four large sectors. EPAM generates more evenly spread revenue across six sectors, with no single segment exceeding $1.0B. Cognizant’s focus suggests a stronghold in healthcare and finance ecosystems, while EPAM’s diversified footprint reduces concentration risk but lacks a dominant vertical. This shapes distinct strategic bets: ecosystem lock-in versus broad market agility.
Strengths and Weaknesses Comparison
This table compares the Strengths and Weaknesses of Cognizant Technology Solutions Corporation and EPAM Systems, Inc.:
CTSH Strengths
- Diverse revenue streams across four major sectors
- Favorable profitability with 10.56% net margin
- Strong liquidity with current and quick ratios at 2.34
- Low leverage with debt-to-assets at 7.61%
- High asset turnover indicating efficient use of assets
- Global presence with significant revenues in North America and Europe
EPAM Strengths
- Balanced sector exposure including Financial Services and Hi-Tech
- Favorable liquidity ratios near 3.0
- Very low debt-to-assets at 3.44% and infinite interest coverage
- Strong fixed asset turnover similar to CTSH
- Established North American revenue base near 2.7B
- Geographic diversification including Europe and emerging markets
CTSH Weaknesses
- Neutral return on equity at 14.85% suggests room for improving shareholder returns
- Neutral weighted average cost of capital limiting capital efficiency
- Neutral valuation multiples with PE 17.9 and PB 2.66
- Dividend yield neutral at 1.53%, indicating moderate shareholder returns
EPAM Weaknesses
- Unfavorable return on invested capital below WACC at 10.67% vs 11.74% WACC
- High valuation multiples with PE 29.47 and PB 3.69 signal pricey stock
- Zero dividend yield may deter income-focused investors
- Net margin lower at 9.61%, reflecting less profitability compared to CTSH
Overall, CTSH demonstrates strong financial health and profitability across diverse sectors and geographies, reflecting operational efficiency and prudent leverage. EPAM shows strengths in liquidity and asset management but faces challenges in capital returns and valuation levels, factors that may impact its strategic growth and investor appeal.
The Moat Duel: Analyzing Competitive Defensibility
A structural moat alone protects long-term profits from competition’s relentless erosion and market share dilution:
Cognizant Technology Solutions Corporation: Switching Costs Powerhouse
Cognizant’s moat stems from strong switching costs embedded in long-term client contracts. Its favorable 17% EBIT margin and 4.3% ROIC excess over WACC highlight efficient capital use. However, a 16% ROIC decline signals emerging margin pressure. New AI-driven automation services could deepen its moat if executed well.
EPAM Systems, Inc.: Innovation-Driven but Vulnerable
EPAM relies on intangible assets and engineering excellence as its moat, differentiating through advanced digital platforms. Despite robust revenue growth (+78% over 5 years), its ROIC underperforms WACC by 1%, reflecting value destruction and shrinking profitability. Expansion into AI and virtual reality offers upside but risks remain high.
Switching Costs vs. Innovation: The Moat Showdown
Cognizant’s deeper moat benefits from client lock-in and steady value creation. EPAM’s innovation moat is promising but undermined by declining returns and negative ROIC spread. I see Cognizant better positioned to defend market share amid intensifying sector competition.
Which stock offers better returns?
Over the past 12 months, Cognizant’s stock gained 2.32%, showing accelerating bullish momentum. EPAM’s shares fell sharply by 37.54%, despite a recent rebound in price.
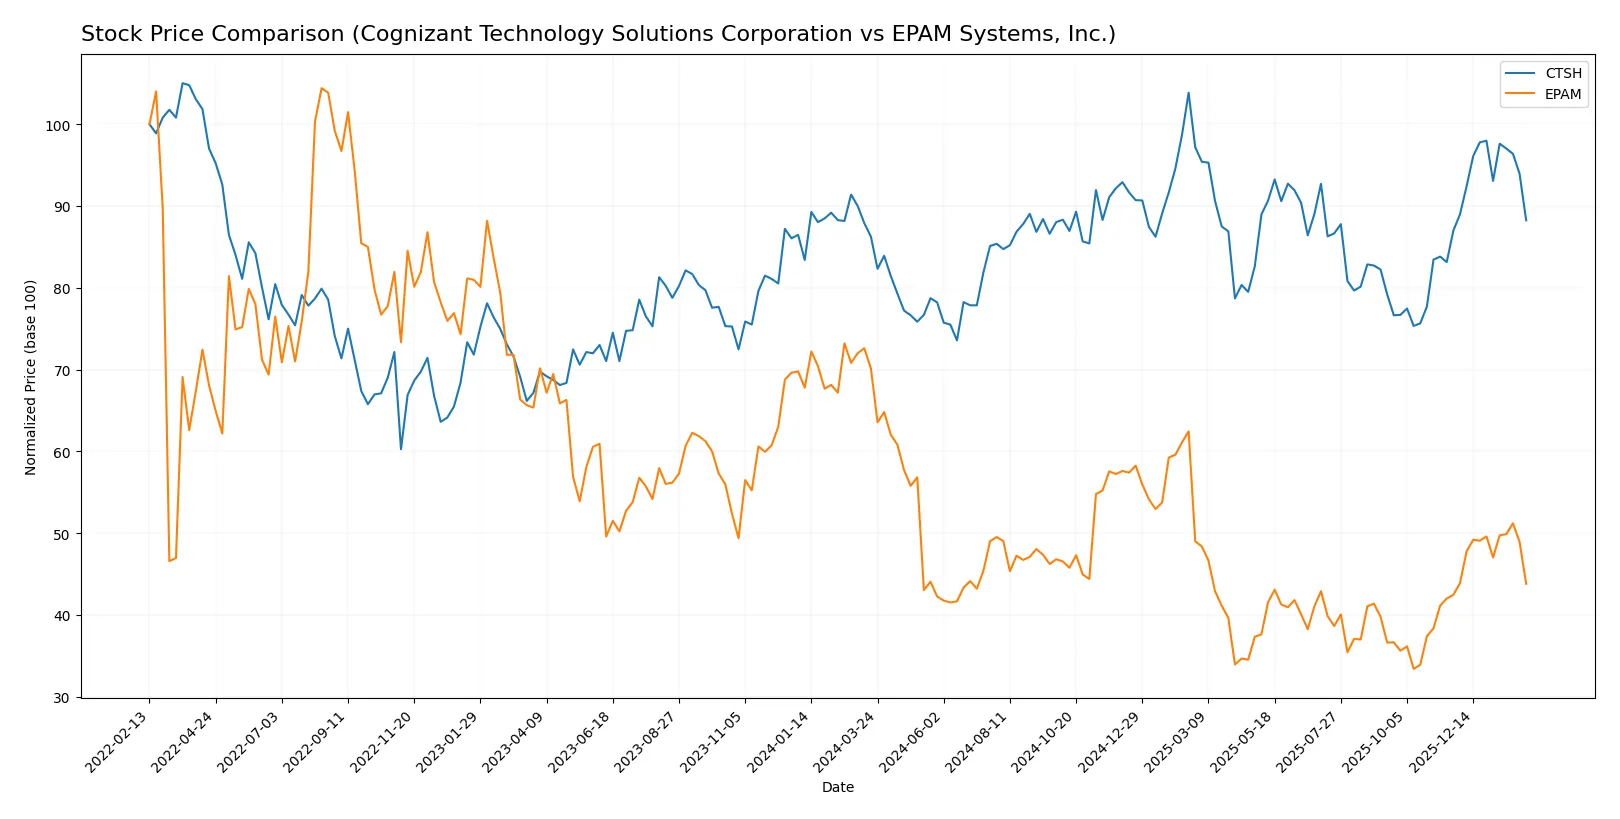
Trend Comparison
Cognizant Technology Solutions Corporation exhibits a 2.32% price rise over 12 months, marking a bullish trend with accelerating momentum and moderate volatility (5.77 std deviation). The stock hit a high of 90.7 and low of 64.26.
EPAM Systems, Inc. shows a -37.54% decline over the same period, signaling a bearish trend with accelerating downside and high volatility (34.35 std deviation). The price ranged from 142.38 to 298.89.
Comparing trends, Cognizant delivers positive market performance over 12 months, outperforming EPAM’s significant negative return despite EPAM’s recent price recovery.
Target Prices
Analysts present a bullish consensus for both Cognizant Technology Solutions Corporation and EPAM Systems, Inc.
| Company | Target Low | Target High | Consensus |
|---|---|---|---|
| Cognizant Technology Solutions Corporation | 82 | 107 | 93.2 |
| EPAM Systems, Inc. | 175 | 247 | 214 |
The consensus targets imply upside of about 21% for Cognizant and 15% for EPAM relative to current prices of $77.08 and $186.68, respectively. Analysts expect steady growth driven by digital transformation demand.

Don’t Let Luck Decide Your Entry Point
Optimize your entry points with our advanced ProRealTime indicators. You’ll get efficient buy signals with precise price targets for maximum performance. Start outperforming now!
How do institutions grade them?
Cognizant Technology Solutions Corporation Grades
The following table summarizes recent institutional grades for Cognizant Technology Solutions Corporation.
| Grading Company | Action | New Grade | Date |
|---|---|---|---|
| TD Cowen | Maintain | Hold | 2026-02-05 |
| Morgan Stanley | Maintain | Equal Weight | 2026-02-05 |
| RBC Capital | Maintain | Sector Perform | 2026-02-05 |
| Guggenheim | Maintain | Buy | 2026-01-28 |
| Citigroup | Maintain | Neutral | 2026-01-22 |
| Wells Fargo | Maintain | Overweight | 2026-01-14 |
| TD Cowen | Maintain | Hold | 2026-01-09 |
| UBS | Maintain | Neutral | 2025-12-08 |
| William Blair | Upgrade | Outperform | 2025-11-21 |
| UBS | Maintain | Neutral | 2025-10-30 |
EPAM Systems, Inc. Grades
The following table summarizes recent institutional grades for EPAM Systems, Inc.
| Grading Company | Action | New Grade | Date |
|---|---|---|---|
| Citigroup | Maintain | Neutral | 2026-01-29 |
| Wells Fargo | Maintain | Overweight | 2026-01-14 |
| TD Cowen | Maintain | Buy | 2026-01-09 |
| Mizuho | Maintain | Outperform | 2025-11-11 |
| JP Morgan | Maintain | Overweight | 2025-11-07 |
| Morgan Stanley | Maintain | Equal Weight | 2025-09-09 |
| JP Morgan | Maintain | Overweight | 2025-08-20 |
| Barclays | Maintain | Overweight | 2025-05-12 |
| Guggenheim | Maintain | Buy | 2025-05-09 |
| Piper Sandler | Maintain | Neutral | 2025-05-09 |
Which company has the best grades?
EPAM Systems, Inc. consistently receives higher grades, including multiple Overweight and Outperform ratings, compared to Cognizant’s mix of Hold and Neutral grades. This indicates stronger institutional confidence in EPAM, potentially attracting more investor interest.
Risks specific to each company
The following categories identify the critical pressure points and systemic threats facing both firms in the 2026 market environment:
1. Market & Competition
Cognizant Technology Solutions Corporation
- Large market cap and diversified segments provide scale advantages but face fierce IT services competition.
EPAM Systems, Inc.
- Smaller market cap with strong digital engineering niche but faces higher competition volatility.
2. Capital Structure & Debt
Cognizant Technology Solutions Corporation
- Conservative leverage with 7.6% debt-to-assets and strong interest coverage protects financial stability.
EPAM Systems, Inc.
- Very low leverage at 3.4% debt-to-assets and infinite interest coverage, signaling low financial risk.
3. Stock Volatility
Cognizant Technology Solutions Corporation
- Beta near 1 (0.957) indicates market-aligned volatility, offering predictability.
EPAM Systems, Inc.
- Higher beta of 1.718 signals greater stock price swings and elevated market risk.
4. Regulatory & Legal
Cognizant Technology Solutions Corporation
- Global operations expose it to complex regulatory regimes but diversified sectors reduce single-point risks.
EPAM Systems, Inc.
- International footprint with digital focus faces regulatory scrutiny in data privacy and export controls.
5. Supply Chain & Operations
Cognizant Technology Solutions Corporation
- Large workforce of 336K supports operational scale but increases complexity and labor cost risks.
EPAM Systems, Inc.
- Smaller workforce (61K) enables agility but may face scale limitations amid rising demand.
6. ESG & Climate Transition
Cognizant Technology Solutions Corporation
- Established ESG programs expected; larger footprint means greater transition risks.
EPAM Systems, Inc.
- Emerging ESG efforts with digital focus may mitigate climate risks but face pressure to scale sustainability.
7. Geopolitical Exposure
Cognizant Technology Solutions Corporation
- Broad international presence exposes it to trade tensions and geopolitical instability.
EPAM Systems, Inc.
- Geographically concentrated with risks stemming from Eastern Europe and US-China tech dynamics.
Which company shows a better risk-adjusted profile?
Cognizant’s conservative capital structure and lower stock volatility anchor a more stable risk profile. EPAM’s higher beta and elevated valuation metrics increase market risk despite excellent debt metrics. Cognizant’s Altman Z-score and Piotroski score demonstrate robust financial health. EPAM’s higher WACC and P/E signal valuation pressure and capital cost challenges. The most impactful risk for Cognizant is operational complexity from its massive workforce. For EPAM, it is stock volatility driven by niche market exposure. Overall, Cognizant offers a superior risk-adjusted profile backed by scale and balance sheet strength.
Final Verdict: Which stock to choose?
Cognizant Technology Solutions Corporation thrives as a cash machine with strong capital efficiency and consistent value creation. Its slight decline in profitability is a point of vigilance. This company fits well within portfolios seeking steady, value-oriented growth with moderate risk tolerance.
EPAM Systems, Inc. commands a strategic moat through its robust balance sheet and operational resilience. While its high valuation and declining ROIC raise caution, it offers better liquidity and safety than Cognizant. EPAM suits investors pursuing growth at a reasonable price with a preference for stability.
If you prioritize consistent value creation and operational efficiency, Cognizant outshines due to its favorable ROIC over WACC and strong financial scores. However, if you seek safer balance sheet metrics and can tolerate premium valuation, EPAM offers better stability despite its value erosion concerns. Both present analytical scenarios for distinct investor profiles.
Disclaimer: Investment carries a risk of loss of initial capital. The past performance is not a reliable indicator of future results. Be sure to understand risks before making an investment decision.
Go Further
I encourage you to read the complete analyses of Cognizant Technology Solutions Corporation and EPAM Systems, Inc. to enhance your investment decisions: