Home > Comparison > Technology > CTSH vs TEAM
The strategic rivalry between Cognizant Technology Solutions Corporation and Atlassian Corporation defines the current trajectory of the technology sector. Cognizant operates as a capital-intensive information technology services provider with global outsourcing capabilities. In contrast, Atlassian excels as a high-margin software application developer focused on collaboration tools. This analysis pits service scale against product innovation to identify which path delivers superior risk-adjusted returns for a diversified portfolio in 2026.
Table of contents
Companies Overview
Cognizant and Atlassian play pivotal roles in the evolving technology landscape, shaping enterprise solutions worldwide.
Cognizant Technology Solutions Corporation: Global IT Services Powerhouse
Cognizant leads in Information Technology Services, generating revenue through consulting, technology, and outsourcing across sectors like healthcare and financial services. In 2026, it focuses on digital transformation, AI-driven automation, and seamless customer experience enhancement to maintain its competitive edge in a diverse, multinational market.
Atlassian Corporation: Collaborative Software Innovator
Atlassian dominates the Software – Application space with products like Jira and Trello that streamline project management and team collaboration. Its 2026 strategy centers on expanding enterprise agility solutions and enhancing cloud security while fostering integration across its comprehensive software portfolio.
Strategic Collision: Similarities & Divergences
Cognizant emphasizes service-driven digital transformation, while Atlassian invests in software that enables agile collaboration. They compete primarily in enterprise technology adoption but with different approaches: one through broad IT services, the other via specialized software ecosystems. Their investment profiles diverge accordingly—Cognizant offers scale and diversification, Atlassian delivers innovation and niche dominance.
Income Statement Comparison
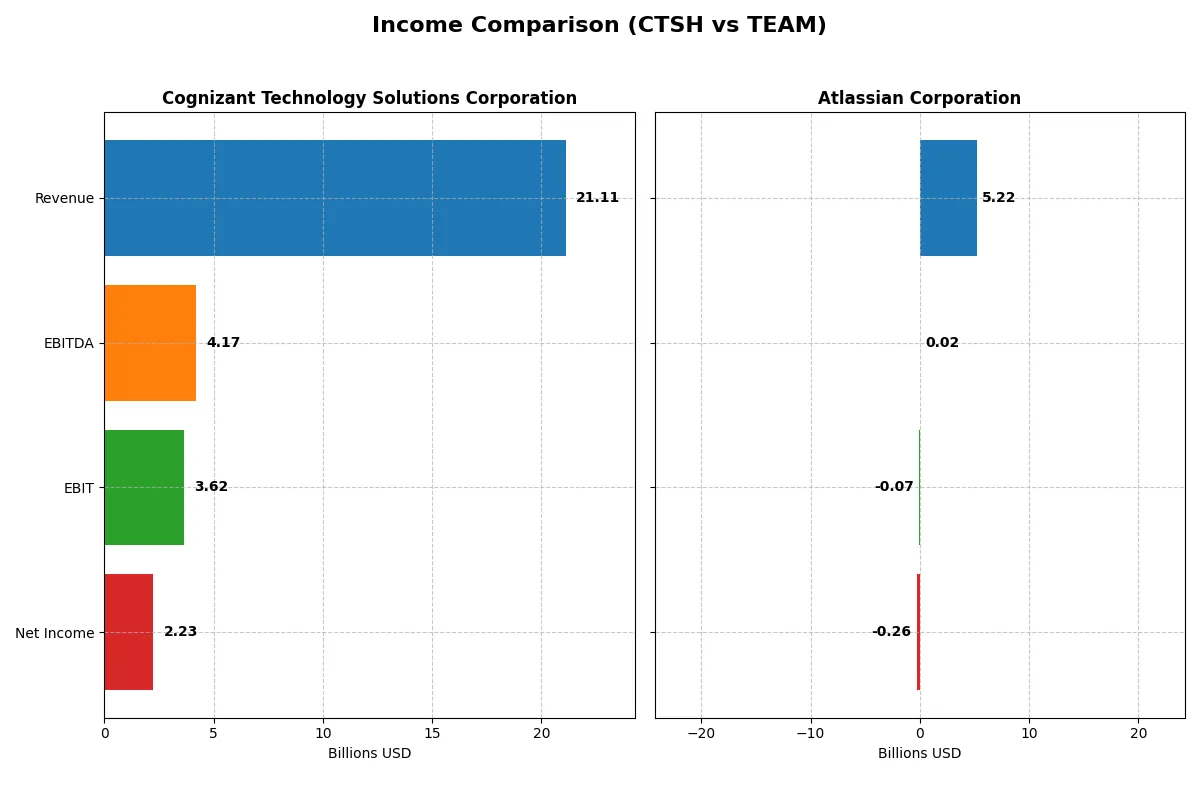
This data dissects the core profitability and scalability of both corporate engines to reveal who dominates the bottom line:
| Metric | Cognizant Technology Solutions Corporation (CTSH) | Atlassian Corporation (TEAM) |
|---|---|---|
| Revenue | 21.1B | 5.2B |
| Cost of Revenue | 14.0B | 895M |
| Operating Expenses | 3.59B | 4.45B |
| Gross Profit | 7.12B | 4.32B |
| EBITDA | 4.17B | 24.0M |
| EBIT | 3.62B | -68.3M |
| Interest Expense | 37.0M | 30.6M |
| Net Income | 2.23B | -257M |
| EPS | 4.56 | -0.98 |
| Fiscal Year | 2025 | 2025 |
Income Statement Analysis: The Bottom-Line Duel
This income statement comparison reveals each company’s true operational efficiency and profitability dynamics over recent years.
Cognizant Technology Solutions Corporation Analysis
Cognizant’s revenue climbed steadily from 18.5B in 2021 to 21.1B in 2025, showing consistent growth. Net income remained stable around 2.1B-2.3B, with a solid net margin near 10.6%. Gross and EBIT margins stand favorable at 33.7% and 17.2%, reflecting efficient cost control and strong operating leverage in 2025.
Atlassian Corporation Analysis
Atlassian’s revenue surged from 2.1B in 2021 to 5.2B in mid-2025, nearly tripling in size. Despite a stellar gross margin above 82%, the company posted negative EBIT and net margins in 2025, indicating heavy operational expenses and unprofitable core operations. However, strong revenue and EPS growth momentum hint at rapid scale-up challenges.
Steady Profits vs. High Growth Struggles
Cognizant delivers consistent profitability with healthy margins and moderate growth, proving operational resilience. Atlassian posts explosive top-line growth but struggles to convert sales into profits. For investors, Cognizant’s profile suits those prioritizing steady earnings, while Atlassian appeals to growth-focused investors willing to endure near-term losses.
Financial Ratios Comparison
These vital ratios act as a diagnostic tool to expose the underlying fiscal health, valuation premiums, and capital efficiency of each company:
| Ratios | Cognizant Technology Solutions Corporation (CTSH) | Atlassian Corporation (TEAM) |
|---|---|---|
| ROE | 14.85% | -19.08% |
| ROIC | 12.31% | -4.40% |
| P/E | 17.90 | -207.13 |
| P/B | 2.66 | 39.51 |
| Current Ratio | 2.34 | 1.22 |
| Quick Ratio | 2.34 | 1.22 |
| D/E (Debt-to-Equity) | 0.10 | 0.92 |
| Debt-to-Assets | 7.61% | 20.51% |
| Interest Coverage | 95.38 | -4.27 |
| Asset Turnover | 1.02 | 0.86 |
| Fixed Asset Turnover | 14.02 | 19.02 |
| Payout ratio | 27.35% | 0% |
| Dividend yield | 1.53% | 0% |
| Fiscal Year | 2025 | 2025 |
Efficiency & Valuation Duel: The Vital Signs
Financial ratios act as a company’s DNA, unveiling hidden risks and highlighting operational strengths essential for informed investing.
Cognizant Technology Solutions Corporation
Cognizant posts solid profitability with a 14.85% ROE and a favorable 10.56% net margin. Its valuation appears balanced, trading at a neutral P/E of 17.9 and a reasonable P/B of 2.66. The company supports shareholders with a 1.53% dividend yield, reflecting steady capital returns alongside efficient asset use and strong liquidity.
Atlassian Corporation
Atlassian struggles with negative profitability metrics, including a -19.08% ROE and -4.92% net margin, signaling operational challenges. Despite an attractive P/E due to losses, its P/B stands stretched at 39.51. The company pays no dividends, focusing on heavy reinvestment in R&D and growth, but financial health flags appear with weak interest coverage and moderate liquidity.
Operational Strength vs. Growth Risk
Cognizant delivers a more stable and efficient financial profile with positive returns and shareholder payouts. Atlassian faces considerable profitability headwinds and valuation risks but pursues aggressive growth. Investors prioritizing stability may favor Cognizant, while those embracing higher risk for growth might consider Atlassian’s profile.
Which one offers the Superior Shareholder Reward?
I compare Cognizant Technology Solutions Corporation (CTSH) and Atlassian Corporation (TEAM) on distribution philosophy, dividend yield, payout ratios, and buybacks. CTSH pays a steady dividend yielding 1.53% with a sustainable payout ratio near 27%. Its free cash flow comfortably covers dividends, signaling prudent capital allocation. CTSH also executes moderate buybacks, enhancing total shareholder return. In contrast, TEAM pays no dividend, reinvesting heavily in R&D and growth, reflected in negative net margins but strong free cash flow and aggressive buybacks boosting share value. TEAM’s high price-to-book and leverage ratios raise sustainability concerns. I find CTSH’s balanced dividend and buyback approach offers a more reliable total return profile in 2026, while TEAM’s growth strategy carries higher risk despite upside potential.
Comparative Score Analysis: The Strategic Profile
The radar chart reveals the fundamental DNA and trade-offs of Cognizant Technology Solutions Corporation and Atlassian Corporation:

Cognizant displays a balanced profile, excelling in ROA (5) and solid scores in DCF (4) and ROE (4). Atlassian relies heavily on a strong DCF score (5) but struggles with profitability and financial risk, reflected in low ROE (1), ROA (1), and Debt/Equity (1) scores. Cognizant’s moderate valuation scores (PE/PB at 3) suggest reasonable pricing, while Atlassian appears overvalued with low valuation scores (1). Overall, Cognizant presents a more stable, diversified strength, whereas Atlassian depends on growth expectations embedded in cash flow.
Bankruptcy Risk: Solvency Showdown
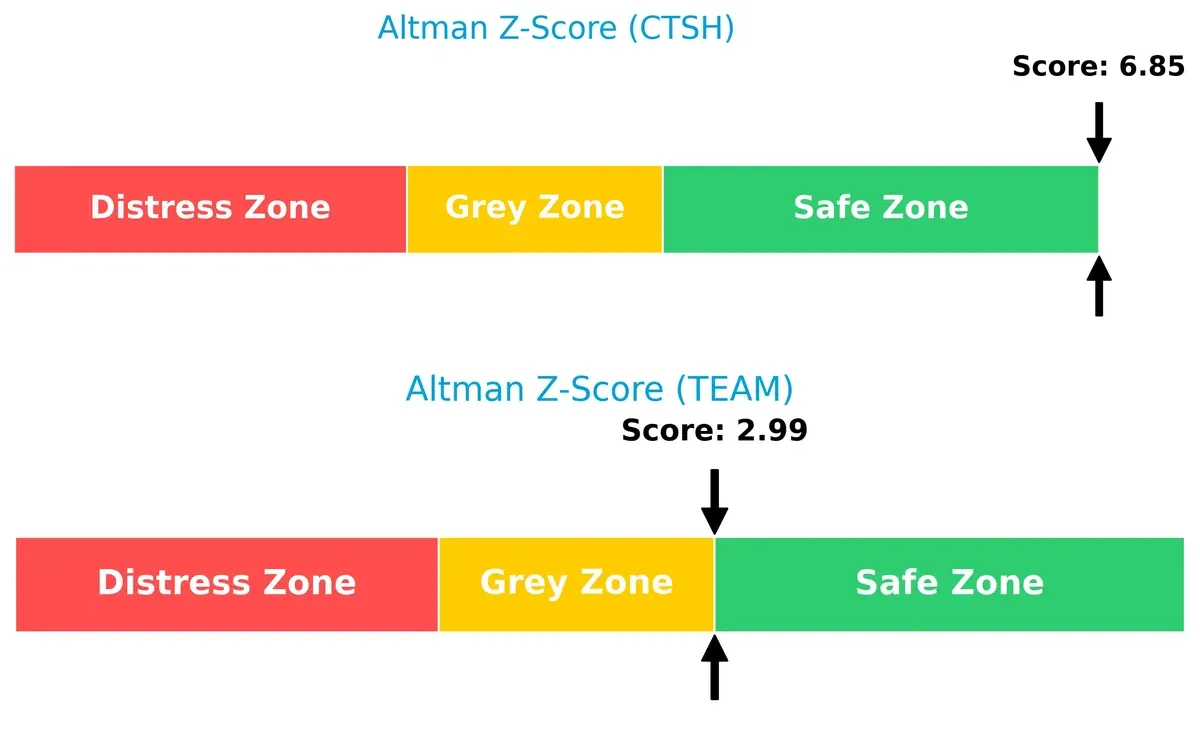
Cognizant’s Altman Z-Score of 6.85 places it firmly in the safe zone, signaling strong financial resilience. Atlassian’s 2.99 score falls in the grey zone, indicating moderate bankruptcy risk amid current market volatility:
Financial Health: Quality of Operations
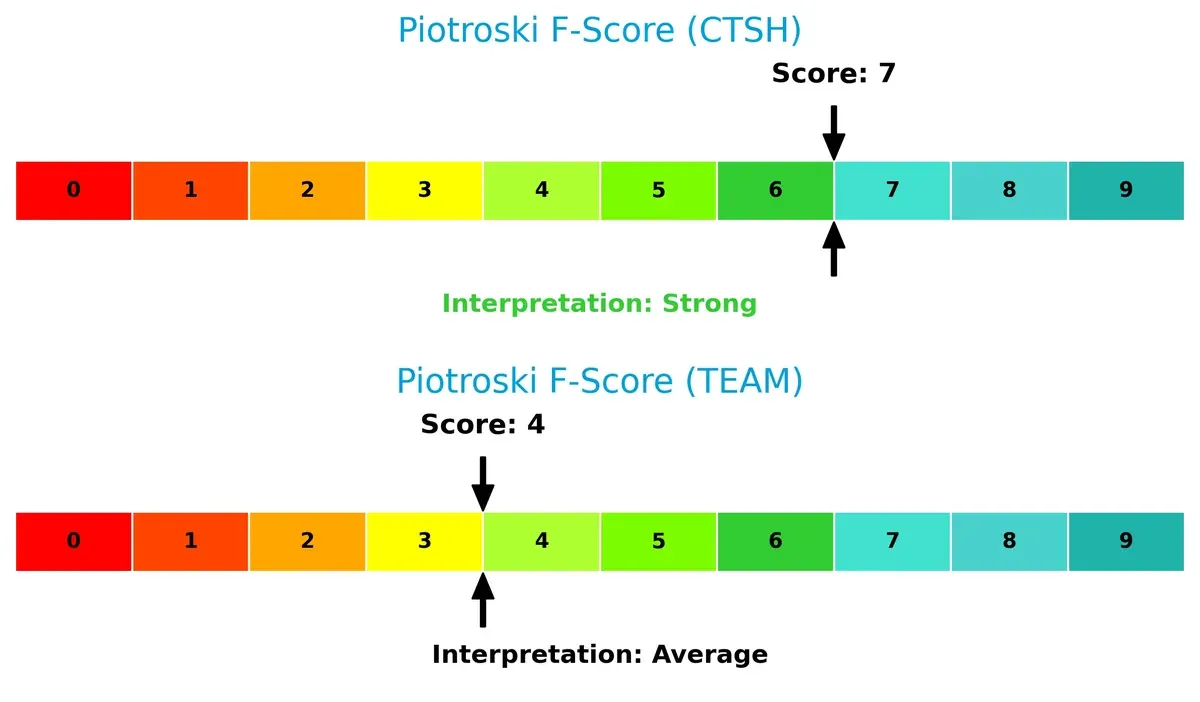
Cognizant’s Piotroski F-Score of 7 signals strong financial health with efficient operations and prudent capital allocation. Atlassian’s score of 4 flags potential internal weaknesses and operational inconsistencies:
How are the two companies positioned?
This section dissects the operational DNA of Cognizant and Atlassian by comparing their revenue distribution and internal dynamics. The goal is to confront their economic moats and identify which model offers the most resilient competitive advantage today.
Revenue Segmentation: The Strategic Mix
The following visual comparison dissects how both firms diversify their income streams and where their primary sector bets lie:

Cognizant Technology Solutions Corporation exhibits a well-balanced revenue mix, with Healthcare ($5.9B) and Financial Services ($5.7B) anchoring its portfolio alongside Communication and Products segments. Atlassian Corporation leans heavily on its License and Service segment ($4.9B), dwarfing smaller categories like Product and Service, Other ($285M). Cognizant’s diversification mitigates sector risk, while Atlassian’s concentration bets on ecosystem lock-in through software licensing. Each approach reflects distinct strategic priorities in their industries.
Strengths and Weaknesses Comparison
This table compares the Strengths and Weaknesses of Cognizant Technology Solutions Corporation and Atlassian Corporation:
CTSH Strengths
- Diversified revenue streams across Communication, Financial Services, Healthcare, and Products sectors
- Strong profitability with favorable net margin (10.56%) and ROIC (12.31%)
- Robust liquidity ratios with current and quick ratios at 2.34
- Low leverage with debt-to-assets at 7.61%
- Global presence spanning North America, Europe, and other regions
- Efficient asset turnover and fixed asset turnover
TEAM Strengths
- Innovation-driven with high fixed asset turnover (19.02)
- Favorable WACC (7.72%) indicates efficient capital cost management
- Moderate liquidity with quick ratio favorable at 1.22
- Expanding global presence in Americas, Asia Pacific, and EMEA
- Revenue growth focused on License and Service segment
- Strong market positioning within software and subscription sectors
CTSH Weaknesses
- Neutral ROE (14.85%) suggests room for improved shareholder returns
- Neutral valuation multiples with PE at 17.9 and PB at 2.66
- Dividend yield neutral at 1.53% may limit income appeal
TEAM Weaknesses
- Negative profitability with net margin (-4.92%), ROE (-19.08%), and ROIC (-4.4%)
- Unfavorable interest coverage (-2.24) signals financial stress
- High price-to-book ratio (39.51) reflects potentially overvalued stock
- No dividend yield reduces income component for investors
- Higher leverage with debt-to-equity at 0.92 and debt-to-assets at 20.51%
Cognizant’s diversified business model and strong financial health underpin its stable strategy. Atlassian, while innovative and expanding globally, faces profitability and leverage challenges that may influence its strategic priorities.
The Moat Duel: Analyzing Competitive Defensibility
A structural moat shields long-term profits from relentless competitive pressure and market disruption. Without it, profit erosion is inevitable:
Cognizant Technology Solutions Corporation: Cost Advantage in IT Services
Cognizant’s moat stems from its scale and operational efficiency, reflected in a favorable 17% EBIT margin and stable gross margins. In 2026, its focus on AI and process automation could bolster this cost advantage but declining ROIC warns of emerging margin pressures.
Atlassian Corporation: Network Effects in Collaborative Software
Atlassian’s competitive edge lies in powerful network effects from its integrated software ecosystem, driving rapid revenue growth (150% over five years). However, negative EBIT margins and rapidly declining ROIC highlight profitability struggles. Expansion into enterprise agility may unlock future upside.
Cost Efficiency vs. Network Effects: Which Moat Endures?
Cognizant’s cost advantage delivers consistent value creation despite margin headwinds. Atlassian’s network effects fuel explosive growth but destroy value with declining returns. Cognizant holds the deeper moat for defending market share with more resilient profitability.
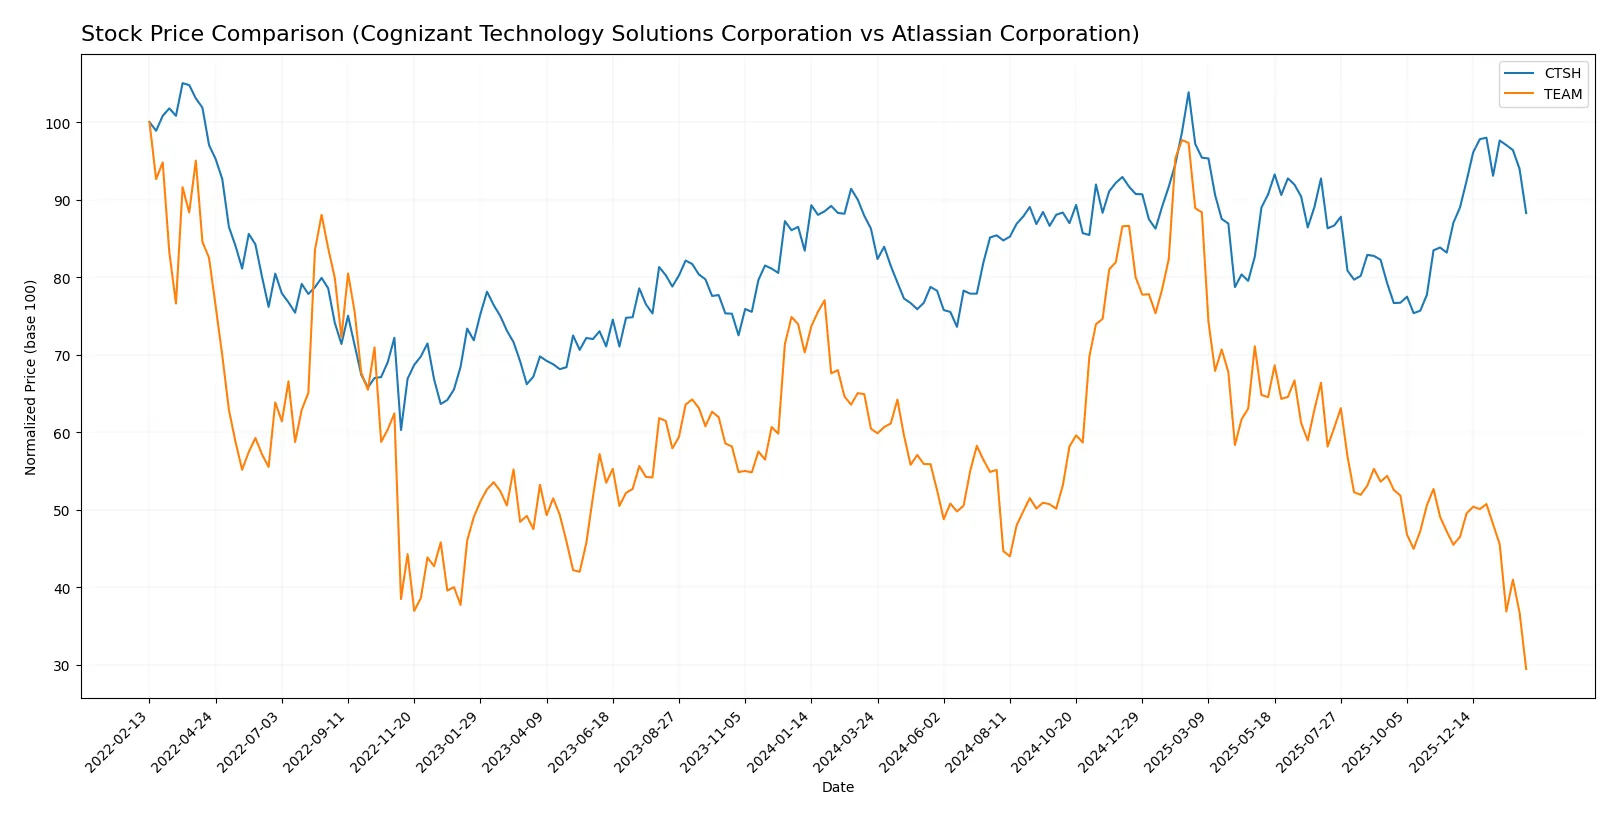
Which stock offers better returns?
The past year shows contrasting dynamics: CTSH gains modestly with steady acceleration, while TEAM suffers a steep decline with sharp deceleration.
Trend Comparison
Cognizant Technology Solutions Corporation (CTSH) posts a 2.32% price increase over 12 months, signaling a bullish trend with accelerating momentum and moderate volatility.
Atlassian Corporation (TEAM) records a -51.28% drop over the same period, marking a bearish trend with deceleration and very high volatility.
CTSH outperformed TEAM, delivering the highest market returns with a stable upward trajectory versus TEAM’s significant depreciation.
Target Prices
Analysts present a broad but optimistic target consensus for Cognizant and Atlassian.
| Company | Target Low | Target High | Consensus |
|---|---|---|---|
| Cognizant Technology Solutions Corporation | 82 | 107 | 93.2 |
| Atlassian Corporation | 105 | 290 | 187.35 |
Cognizant’s consensus target of 93.2 suggests a 21% upside from the current 77.08 price. Atlassian’s 187.35 consensus implies nearly double the current 94.72, reflecting strong growth expectations.

Don’t Let Luck Decide Your Entry Point
Optimize your entry points with our advanced ProRealTime indicators. You’ll get efficient buy signals with precise price targets for maximum performance. Start outperforming now!
How do institutions grade them?
Cognizant Technology Solutions Corporation Grades
Here are the recent grades assigned by reputable financial institutions:
| Grading Company | Action | New Grade | Date |
|---|---|---|---|
| TD Cowen | Maintain | Hold | 2026-02-05 |
| Morgan Stanley | Maintain | Equal Weight | 2026-02-05 |
| RBC Capital | Maintain | Sector Perform | 2026-02-05 |
| Guggenheim | Maintain | Buy | 2026-01-28 |
| Citigroup | Maintain | Neutral | 2026-01-22 |
| Wells Fargo | Maintain | Overweight | 2026-01-14 |
| TD Cowen | Maintain | Hold | 2026-01-09 |
| UBS | Maintain | Neutral | 2025-12-08 |
| William Blair | Upgrade | Outperform | 2025-11-21 |
| UBS | Maintain | Neutral | 2025-10-30 |
Atlassian Corporation Grades
Below are the latest institutional ratings for Atlassian Corporation:
| Grading Company | Action | New Grade | Date |
|---|---|---|---|
| Piper Sandler | Maintain | Overweight | 2026-02-06 |
| Keybanc | Maintain | Overweight | 2026-02-06 |
| Barclays | Maintain | Overweight | 2026-02-06 |
| Macquarie | Maintain | Outperform | 2026-02-06 |
| BTIG | Maintain | Buy | 2026-02-06 |
| Mizuho | Maintain | Outperform | 2026-02-06 |
| Wells Fargo | Maintain | Overweight | 2026-02-06 |
| Guggenheim | Maintain | Buy | 2026-02-06 |
| Oppenheimer | Maintain | Outperform | 2026-02-06 |
| Morgan Stanley | Maintain | Overweight | 2026-02-06 |
Which company has the best grades?
Atlassian consistently receives higher ratings, mainly “Overweight” and “Outperform,” while Cognizant shows more neutral and mixed grades. Investors might interpret Atlassian as having stronger institutional confidence, potentially affecting demand and valuation.
Risks specific to each company
The following categories identify critical pressure points and systemic threats facing Cognizant Technology Solutions Corporation and Atlassian Corporation in the 2026 market environment:
1. Market & Competition
Cognizant Technology Solutions Corporation
- Faces intense competition in IT services with pressure from digital transformation players.
Atlassian Corporation
- Operates in a highly competitive software market with fast innovation cycles and disruptive startups.
2. Capital Structure & Debt
Cognizant Technology Solutions Corporation
- Maintains a conservative capital structure with low debt-to-equity (0.1), reducing financial risk.
Atlassian Corporation
- Higher debt-to-equity ratio (0.92) raises leverage concerns and increases vulnerability to interest rate hikes.
3. Stock Volatility
Cognizant Technology Solutions Corporation
- Exhibits moderate stock volatility with beta near 0.96, reflecting stable market sensitivity.
Atlassian Corporation
- Slightly lower beta (0.88) but wide price range signals episodic volatility and investor uncertainty.
4. Regulatory & Legal
Cognizant Technology Solutions Corporation
- Exposure to global data privacy and outsourcing regulations could increase compliance costs.
Atlassian Corporation
- Faces software licensing, data security, and privacy regulations that could impact growth and liability.
5. Supply Chain & Operations
Cognizant Technology Solutions Corporation
- Complexity in global delivery operations risks disruption from geopolitical tensions and labor markets.
Atlassian Corporation
- Relies heavily on cloud infrastructure; interruptions could affect service quality and customer retention.
6. ESG & Climate Transition
Cognizant Technology Solutions Corporation
- Increasing pressure to improve ESG disclosures and reduce carbon footprint in global operations.
Atlassian Corporation
- Growing demand for sustainable software solutions and transparency in governance standards.
7. Geopolitical Exposure
Cognizant Technology Solutions Corporation
- Significant international footprint exposes it to currency fluctuations and trade tensions, especially US-Europe-Asia.
Atlassian Corporation
- Australian headquarters and global client base create exposure to Asia-Pacific geopolitical risks and regulatory shifts.
Which company shows a better risk-adjusted profile?
Cognizant’s strongest risk lies in global operational complexity, but its conservative debt and robust financial health provide a buffer. Atlassian grapples with weak profitability and high leverage, amplifying financial risks. I observe that Cognizant’s Altman Z-score (6.85) signals solid stability, while Atlassian’s score (2.99) places it in a grey zone. Thus, Cognizant demonstrates a superior risk-adjusted profile amid 2026’s market pressures.
Final Verdict: Which stock to choose?
Cognizant Technology Solutions stands out as a cash-generating powerhouse with a sturdy balance sheet and a solid economic moat. Its consistent value creation, despite a slight dip in profitability, makes it a dependable choice. The main point of vigilance remains its modest growth momentum. It fits well in a portfolio seeking steady, moderate growth with risk control.
Atlassian commands a strategic moat through its cloud software dominance and rapid revenue expansion. However, it currently struggles with profitability and a high valuation multiple, signaling elevated risk. Compared to Cognizant, it offers less financial safety but greater growth potential. It suits investors aiming for GARP—growth at a reasonable price—willing to accept volatility.
If you prioritize resilient value creation and financial stability, Cognizant outshines as the compelling choice due to its robust free cash flow and strong balance sheet. However, if you seek aggressive growth fueled by innovation and market disruption, Atlassian offers superior top-line expansion but with greater risk. Each presents distinct trade-offs aligned with different investor risk appetites.
Disclaimer: Investment carries a risk of loss of initial capital. The past performance is not a reliable indicator of future results. Be sure to understand risks before making an investment decision.
Go Further
I encourage you to read the complete analyses of Cognizant Technology Solutions Corporation and Atlassian Corporation to enhance your investment decisions: