Home > Comparison > Technology > TRMB vs CGNX
The strategic rivalry between Trimble Inc. and Cognex Corporation shapes the evolution of the technology hardware sector. Trimble operates as a diversified technology solutions provider, delivering software and hardware across geospatial, agriculture, construction, and transportation industries. Cognex specializes in machine vision systems that automate manufacturing and distribution processes. This analysis explores their contrasting operational models and growth trajectories to identify which company offers a superior risk-adjusted investment opportunity for a balanced portfolio.
Table of contents
Companies Overview
Trimble Inc. and Cognex Corporation both lead in technology-driven hardware and equipment for industrial markets.
Trimble Inc.: Precision Technology for Field Mobility
Trimble Inc. dominates technology solutions for professionals and mobile workers worldwide. It generates revenue through diverse segments: Buildings and Infrastructure, Geospatial, Resources and Utilities, and Transportation. In 2026, Trimble focuses strategically on integrated software and autonomous systems to optimize construction, agriculture, and logistics workflows, enhancing operational efficiency with advanced data sharing and asset management.
Cognex Corporation: Machine Vision Automation Pioneer
Cognex Corporation specializes in machine vision products that automate manufacturing and distribution. Its core revenue comes from vision systems, sensors, and barcode readers across industries like electronics, automotive, and pharmaceuticals. The company emphasizes expanding its VisionPro software and deep learning capabilities in 2026 to improve automation precision and speed, targeting broader adoption in industrial inspection and robotic guidance.
Strategic Collision: Similarities & Divergences
Both firms excel in hardware for automation but diverge in approach: Trimble integrates broad field mobility solutions, while Cognex builds focused machine vision systems. They compete primarily in industrial automation but serve complementary niches—Trimble in site and asset management, Cognex in visual inspection. This contrast defines their investment profiles: Trimble offers diversified tech exposure; Cognex provides specialized vision-driven innovation.
Income Statement Comparison
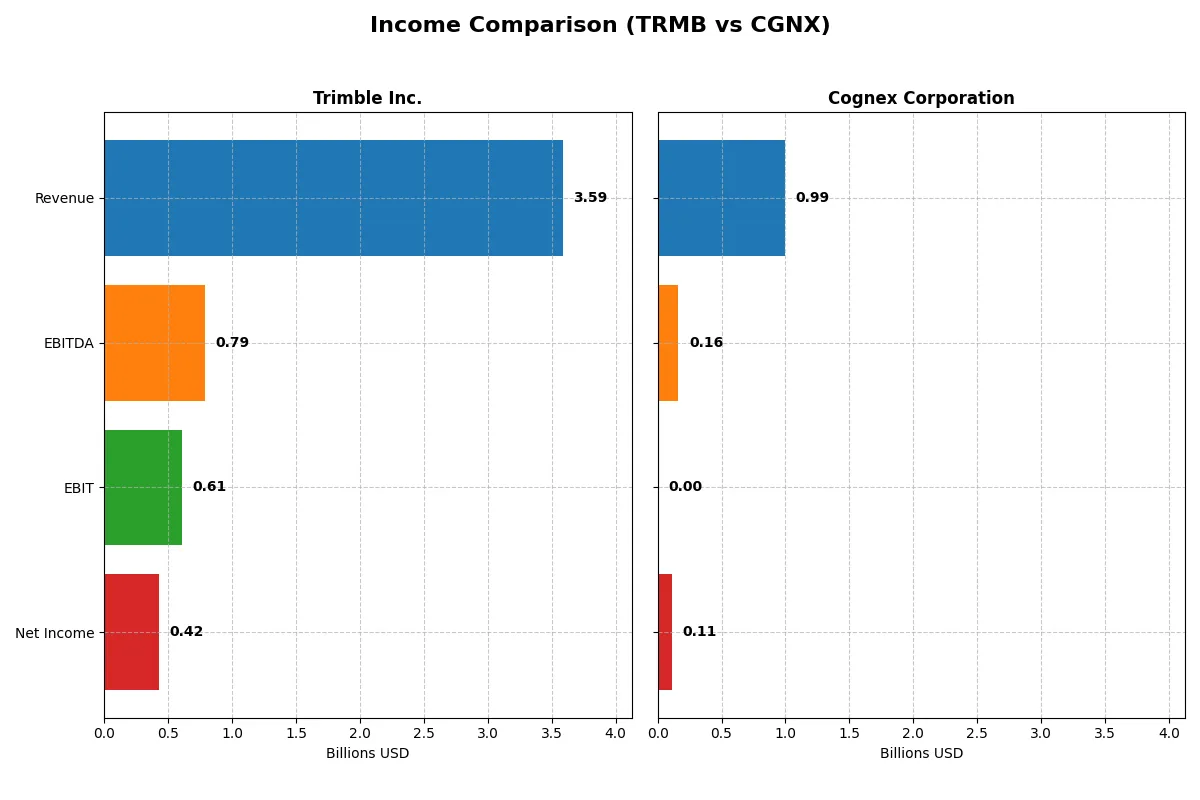
This data dissects the core profitability and scalability of both corporate engines to reveal who dominates the bottom line:
| Metric | Trimble Inc. (TRMB) | Cognex Corporation (CGNX) |
|---|---|---|
| Revenue | 3.59B | 994M |
| Cost of Revenue | 1.14B | 329M |
| Operating Expenses | 1.84B | 503M |
| Gross Profit | 2.45B | 665M |
| EBITDA | 789M | 163M |
| EBIT | 610M | 0 |
| Interest Expense | 74M | 0 |
| Net Income | 424M | 114M |
| EPS | 1.77 | 0.68 |
| Fiscal Year | 2025 | 2025 |
Income Statement Analysis: The Bottom-Line Duel
This income statement comparison reveals which company drives its business engine with superior efficiency and margin discipline.
Trimble Inc. Analysis
Trimble’s revenue slightly declined by 2.6% in 2025 to $3.59B, while net income slid 71% to $424M. Its gross margin remains strong at 68.3%, reflecting solid cost control. However, the sharp net margin contraction to 11.8% highlights pressure on profitability and a steep decline in operating income momentum.
Cognex Corporation Analysis
Cognex boosted revenue 8.7% to $994M in 2025, with net income rising modestly to $114M. Gross margin stands at 66.9%, close to Trimble’s level, but EBIT margin dropped to zero, indicating operational challenges. Despite net margin stability, the company faces a significant EBIT collapse, signaling margin compression.
Margin Strength vs. Revenue Growth
Trimble maintains superior margin ratios but suffers a severe profit drop, while Cognex grows revenue yet struggles with zero EBIT margin. Trimble’s scale and margin power dominate, but Cognex’s top-line momentum offers a different risk-return profile. Investors seeking margin resilience may favor Trimble; those prioritizing growth might watch Cognex’s recovery closely.
Financial Ratios Comparison
These vital ratios act as a diagnostic tool to expose the underlying fiscal health, valuation premiums, and capital efficiency of the companies compared below:
| Ratios | Trimble Inc. (TRMB) | Cognex Corporation (CGNX) |
|---|---|---|
| ROE | 7.3% (2025) | 7.7% (2025) |
| ROIC | 6.5% (2025) | 5.5% (2025) |
| P/E | 43.9 (2025) | 52.8 (2025) |
| P/B | 3.19 (2025) | 4.05 (2025) |
| Current Ratio | 1.09 (2025) | 3.80 (2025) |
| Quick Ratio | 0.96 (2025) | 3.05 (2025) |
| D/E | 0.24 (2025) | 0.05 (2025) |
| Debt-to-Assets | 15.0% (2025) | 3.8% (2025) |
| Interest Coverage | 8.2 (2025) | 0 (2025) |
| Asset Turnover | 0.39 (2025) | 0.49 (2025) |
| Fixed Asset Turnover | 19.6 (2025) | 6.28 (2025) |
| Payout Ratio | 0% (2025) | 48% (2025) |
| Dividend Yield | 0% (2025) | 0.9% (2025) |
| Fiscal Year | 2025 | 2025 |
Efficiency & Valuation Duel: The Vital Signs
Financial ratios serve as a company’s DNA, uncovering hidden risks and revealing operational strengths essential for informed investing.
Trimble Inc.
Trimble posts a solid net margin of 11.82%, but its ROE at 7.27% lags behind industry expectations, signaling moderate profitability. The stock trades expensive with a P/E of 43.87 and a P/B of 3.19, reflecting stretched valuation. Absence of dividends suggests reinvestment focuses on R&D, supporting future growth potential.
Cognex Corporation
Cognex shows a comparable net margin of 11.51% and a slightly better ROE of 7.67%, yet it carries a higher P/E of 52.83 and P/B of 4.05, indicating a more stretched valuation. Despite a modest 0.9% dividend yield, its unfavorable interest coverage raises caution over financial leverage.
Premium Valuation vs. Operational Safety
Trimble and Cognex both face stretched valuations, but Trimble’s stronger interest coverage and prudent debt levels offer better operational safety. Cognex’s higher leverage and weaker coverage increase risk despite a small dividend. Investors favoring stability might lean toward Trimble’s profile, while those seeking yield face more uncertainty with Cognex.
Which one offers the Superior Shareholder Reward?
I observe that Trimble Inc. (TRMB) pays no dividends but aggressively reinvests in growth, supported by strong free cash flow of 2.03/share and capex coverage of 15.8x. Cognex Corporation (CGNX) offers a modest dividend yield near 0.9%, with a payout ratio around 48%, balancing income with buybacks. TRMB’s buyback intensity is higher, driving capital return without dividend strain. CGNX’s dividend payout is sustainable, but its elevated P/E (~53) limits upside. I conclude TRMB’s reinvestment and buyback strategy delivers a superior total return profile in 2026, favoring long-term value creation over CGNX’s income focus.
Comparative Score Analysis: The Strategic Profile
The radar chart reveals the fundamental DNA and trade-offs of Trimble Inc. and Cognex Corporation, illustrating their core financial strengths and vulnerabilities:

Cognex leads with a more balanced profile, scoring favorably in ROA (4) and debt-to-equity (4), signaling efficient asset use and lower financial risk. Trimble shows moderate operational returns but weaker debt management (2) and valuation scores (P/E at 1). Trimble relies on moderate profitability but carries more financial leverage risk. Cognex’s profile suggests steadier capital allocation and resilience.
Bankruptcy Risk: Solvency Showdown
The Altman Z-Score gap favors Cognex significantly, indicating a stronger solvency position and lower bankruptcy risk in this cycle:
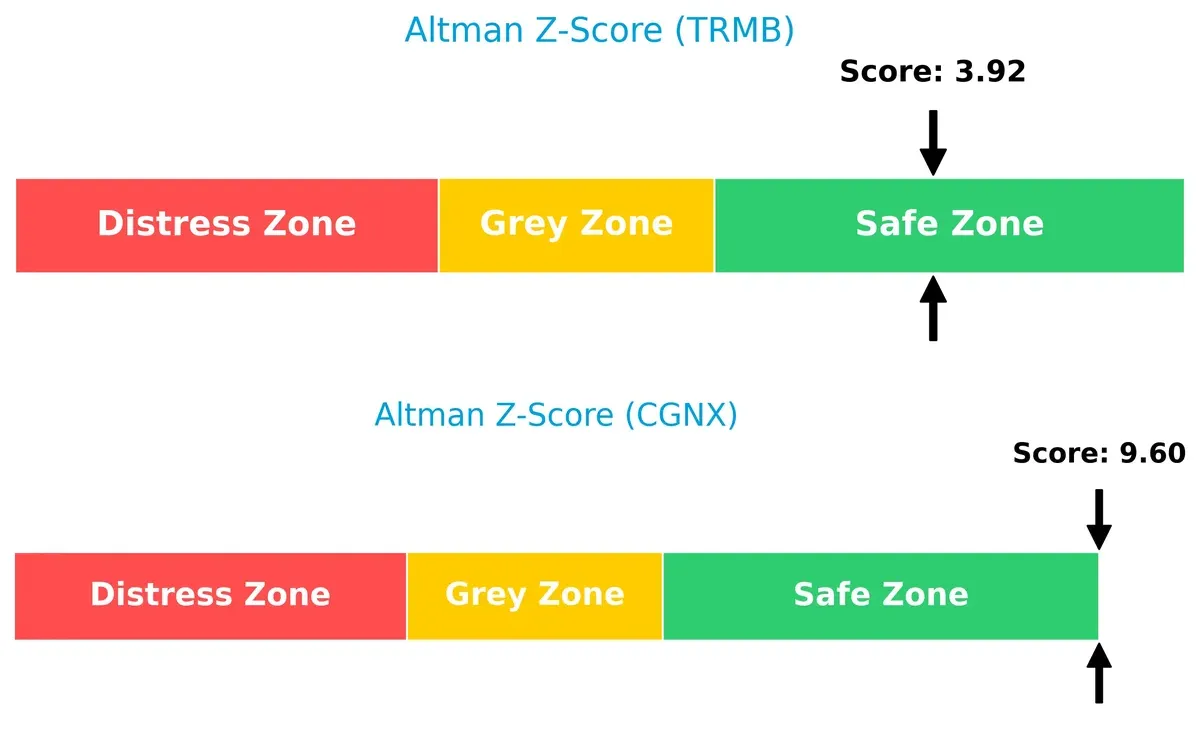
Trimble’s score of 3.92 places it safely above distress thresholds, but Cognex’s 9.6 score implies exceptional financial stability, underscoring its robust balance sheet and long-term survival prospects.
Financial Health: Quality of Operations
Cognex edges out Trimble on Piotroski F-Score, reflecting stronger operational quality and fewer red flags in its internal metrics:
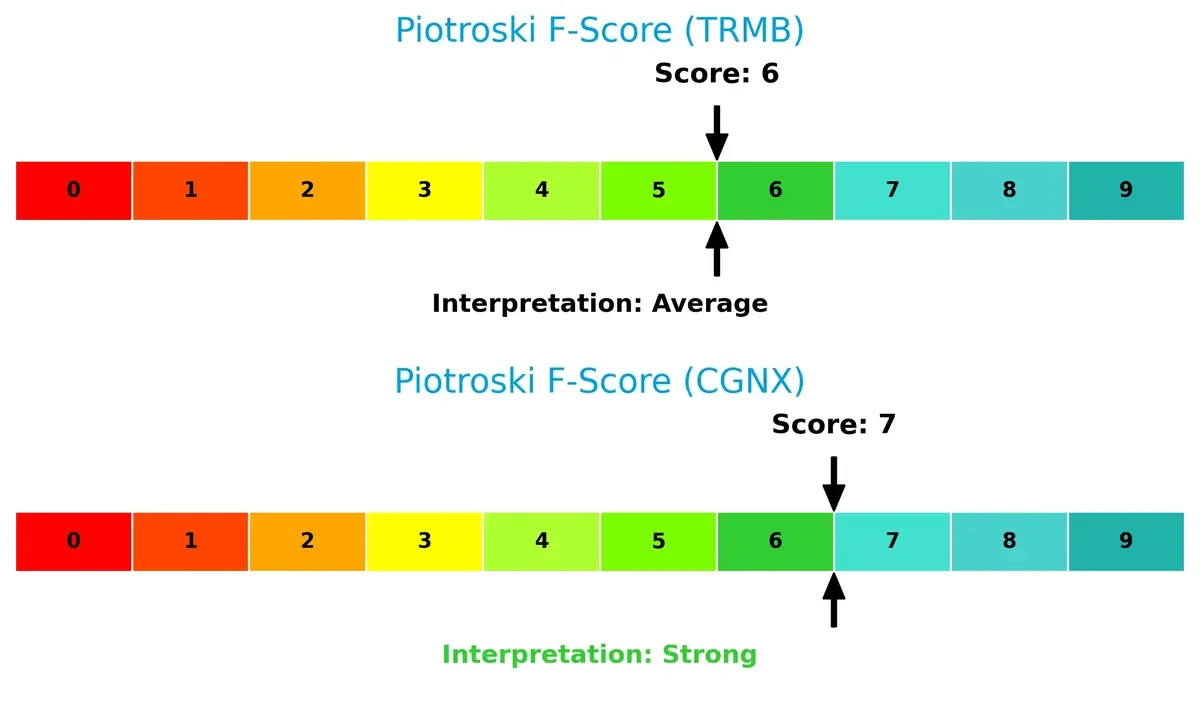
With a score of 7, Cognex demonstrates solid profitability, liquidity, and efficiency. Trimble’s 6, while decent, suggests room for improvement in financial strength and internal controls compared to its peer. Investors should note this subtle but meaningful operational difference.
How are the two companies positioned?
This section dissects the operational DNA of Trimble and Cognex by comparing their revenue distribution and internal dynamics, including strengths and weaknesses. The goal is to confront their economic moats and identify the more resilient, sustainable competitive advantage in today’s market.
Revenue Segmentation: The Strategic Mix
This comparison dissects how Trimble Inc. and Cognex Corporation diversify their income streams and highlights each company’s primary sector bets:
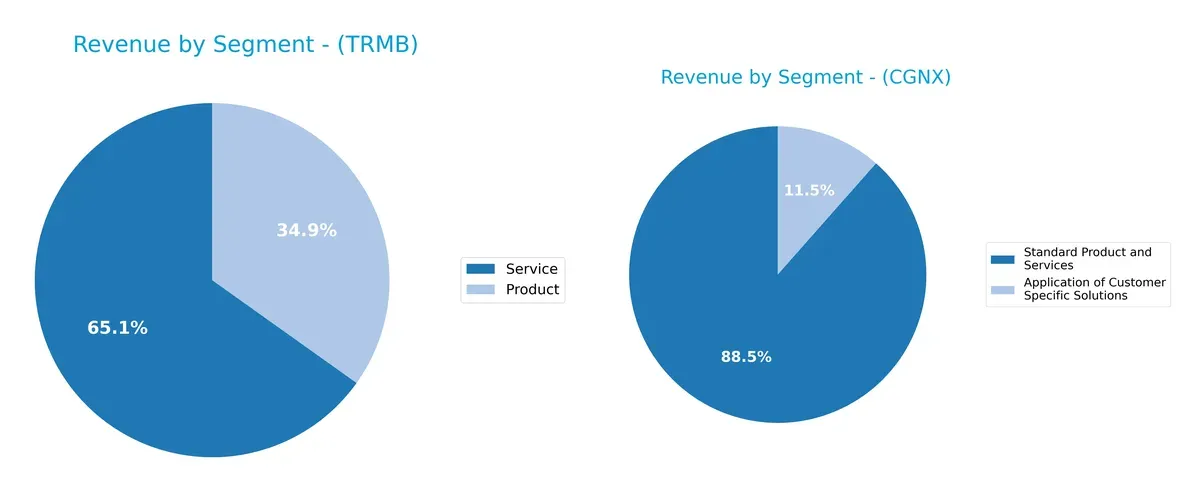
Trimble pivots between product ($1.28B) and service ($2.40B) revenues, balancing infrastructure and geospatial sectors. Cognex anchors its income in standard products ($880M) with a smaller, stable customer-specific segment ($114M). Trimble’s broader mix reduces concentration risk, promoting ecosystem lock-in. Cognex’s reliance on standard products signals infrastructure dominance but exposes it to market cyclicality. This contrast reveals distinct strategic approaches to revenue stability and growth.
Strengths and Weaknesses Comparison
This table compares the Strengths and Weaknesses of Trimble Inc. and Cognex Corporation:
Trimble Inc. Strengths
- Diversified revenue across multiple sectors and geographies
- Favorable net margin at 11.82%
- Low debt-to-equity ratio at 0.24
- Strong interest coverage at 8.19
- Robust fixed asset turnover at 19.62
Cognex Corporation Strengths
- Favorable net margin at 11.51%
- Very low debt-to-equity ratio at 0.05
- High quick ratio at 3.05 indicating liquidity
- Global presence with diversified geographic sales
- Favorable fixed asset turnover at 6.28
Trimble Inc. Weaknesses
- Unfavorable ROE at 7.27% below cost of capital
- WACC at 10.51% exceeds ROIC at 6.48%
- High price multiples (PE 43.87, PB 3.19)
- Neutral current and quick ratios near 1
- No dividend yield
- Unfavorable asset turnover at 0.39
Cognex Corporation Weaknesses
- Unfavorable ROE at 7.67% below WACC
- WACC at 10.79% exceeds ROIC at 5.52%
- Very high price multiples (PE 52.83, PB 4.05)
- Poor current ratio at 3.8 yet interest coverage is zero
- Unfavorable asset turnover at 0.49
- Dividend yield low at 0.9%
Trimble shows strength in diversified revenue and balance sheet stability, while Cognex benefits from liquidity and low leverage. Both face challenges with returns below cost of capital and stretched valuation metrics, impacting strategic capital allocation considerations.
The Moat Duel: Analyzing Competitive Defensibility
A structural moat is the only shield protecting long-term profits from relentless competition erosion. Let’s dissect the competitive moats of two tech hardware players:
Trimble Inc.: Diverse Integration Moat
Trimble’s moat stems from its broad integrated solutions across construction, agriculture, and transportation. High gross margins near 68% reflect pricing power. Yet, its declining ROIC warns of eroding capital efficiency. New markets in autonomous agriculture could deepen this moat if execution improves.
Cognex Corporation: Specialized Vision Tech Moat
Cognex leverages patented machine vision tech, creating high switching costs in automated manufacturing. Unlike Trimble, Cognex’s revenue growth is positive, but its zero EBIT margin signals margin pressure. Expansion into AI-driven vision software offers potential to widen its niche moat.
Verdict: Integration Breadth vs. Specialized Innovation
Both firms show declining ROICs and value destruction, but Trimble’s diversified platform presents a wider moat than Cognex’s narrower, innovation-dependent moat. Trimble stands better poised to defend market share if it reverses profitability trends.
Which stock offers better returns?
The past year reveals contrasting dynamics: Trimble Inc. shows mild overall gains but recent weakness, while Cognex Corporation exhibits strong accelerating growth and buyer dominance.
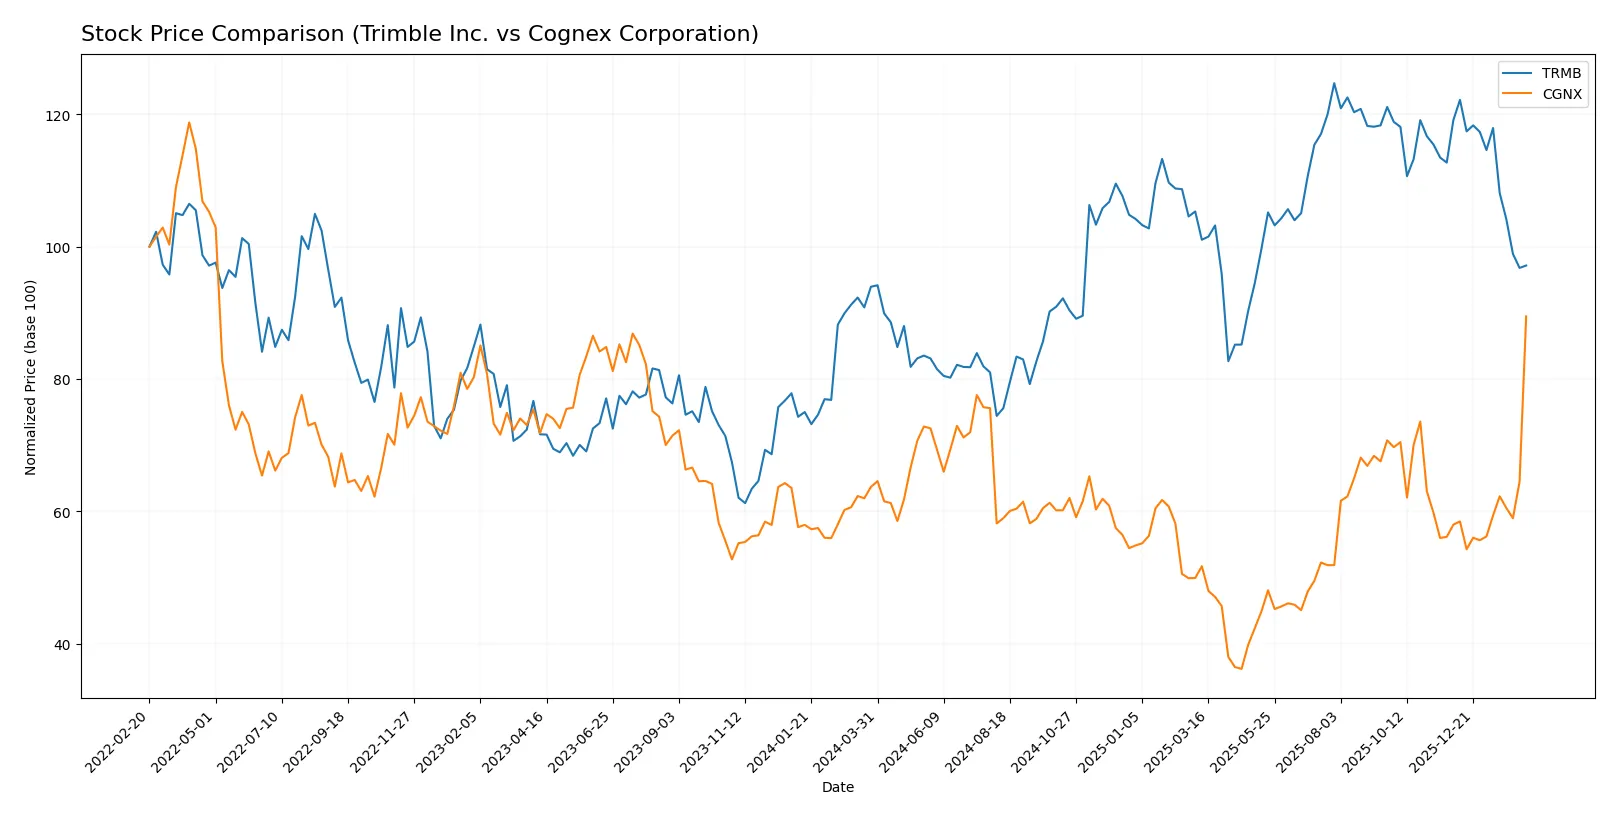
Trend Comparison
Trimble Inc. posts a 3.43% price increase over 12 months, indicating a bullish but decelerating trend, with a high volatility of 9.67% and a recent 18.45% decline.
Cognex Corporation gains 40.48% during the same period, maintaining a bullish accelerating trend with moderate volatility at 6.25%, and a recent 54.3% surge.
Cognex clearly outperforms Trimble in market returns, driven by sustained acceleration and stronger buyer dominance over the past year.
Target Prices
Analysts present a mixed but promising target consensus for Trimble Inc. and Cognex Corporation.
| Company | Target Low | Target High | Consensus |
|---|---|---|---|
| Trimble Inc. | 86 | 101 | 95 |
| Cognex Corporation | 38 | 70 | 54.88 |
Trimble’s target consensus at 95 suggests significant upside from the current 66.4 price. Cognex’s consensus near 55 matches closely its current 58.79 price, indicating more modest near-term gains.

Don’t Let Luck Decide Your Entry Point
Optimize your entry points with our advanced ProRealTime indicators. You’ll get efficient buy signals with precise price targets for maximum performance. Start outperforming now!
How do institutions grade them?
Here is a comparison of the latest institutional grades for Trimble Inc. and Cognex Corporation:
Trimble Inc. Grades
This table summarizes recent grades from reputable financial institutions for Trimble Inc.
| Grading Company | Action | New Grade | Date |
|---|---|---|---|
| Wells Fargo | Maintain | Overweight | 2026-02-12 |
| Barclays | Maintain | Overweight | 2026-01-12 |
| Keybanc | Upgrade | Overweight | 2025-12-16 |
| Piper Sandler | Maintain | Overweight | 2025-11-07 |
| JP Morgan | Maintain | Overweight | 2025-09-19 |
| Raymond James | Maintain | Outperform | 2025-08-07 |
| JP Morgan | Maintain | Overweight | 2025-08-07 |
| Oppenheimer | Maintain | Outperform | 2025-08-07 |
| Oppenheimer | Maintain | Outperform | 2025-07-17 |
| JP Morgan | Maintain | Overweight | 2025-07-10 |
Cognex Corporation Grades
Below is a summary of the most recent grades given to Cognex Corporation by verified grading firms.
| Grading Company | Action | New Grade | Date |
|---|---|---|---|
| Keybanc | Maintain | Overweight | 2026-02-13 |
| Barclays | Maintain | Overweight | 2026-02-13 |
| Needham | Maintain | Buy | 2026-02-12 |
| Barclays | Maintain | Overweight | 2026-01-12 |
| Truist Securities | Maintain | Hold | 2025-12-18 |
| Goldman Sachs | Upgrade | Buy | 2025-12-16 |
| JP Morgan | Downgrade | Underweight | 2025-12-03 |
| DA Davidson | Maintain | Neutral | 2025-11-03 |
| Baird | Maintain | Neutral | 2025-10-31 |
| Needham | Maintain | Buy | 2025-10-31 |
Which company has the best grades?
Trimble Inc. consistently holds “Overweight” and “Outperform” grades from multiple leading institutions. Cognex Corporation shows mixed ratings, including upgrades but also significant downgrades. This contrast suggests Trimble receives stronger institutional confidence, potentially affecting investor perception and demand.
Risks specific to each company
The following categories identify critical pressure points and systemic threats facing both Trimble Inc. and Cognex Corporation in the 2026 market environment:
1. Market & Competition
Trimble Inc.
- Operates in diverse tech segments with moderate asset turnover, facing intense hardware competition.
Cognex Corporation
- Focuses on machine vision with strong niche but highly competitive market and higher asset turnover.
2. Capital Structure & Debt
Trimble Inc.
- Low debt-to-equity (0.24) and strong interest coverage (8.19) indicate sound balance sheet.
Cognex Corporation
- Very low debt (0.05 D/E) but zero interest coverage suggests potential earnings stress.
3. Stock Volatility
Trimble Inc.
- Beta 1.576 signals above-market volatility.
Cognex Corporation
- Beta 1.534 also indicates high volatility, slightly less than Trimble.
4. Regulatory & Legal
Trimble Inc.
- Exposure to global construction and agriculture tech regulations; moderate risk.
Cognex Corporation
- Faces regulatory scrutiny in manufacturing automation and data compliance sectors.
5. Supply Chain & Operations
Trimble Inc.
- Complex supply chain across multiple industries; vulnerable to component shortages.
Cognex Corporation
- Concentrated supply chain for vision systems; sensitive to semiconductor availability.
6. ESG & Climate Transition
Trimble Inc.
- Increasing focus on sustainable infrastructure solutions; moderate ESG risks.
Cognex Corporation
- ESG efforts focused on energy efficiency in manufacturing; risks tied to evolving standards.
7. Geopolitical Exposure
Trimble Inc.
- Global footprint exposes it to trade tensions and regional instability.
Cognex Corporation
- Similar global exposure, with potential impact from international manufacturing disruptions.
Which company shows a better risk-adjusted profile?
Trimble’s strongest risk is its unfavorable valuation metrics and moderate liquidity ratios, signaling financial prudence concerns. Cognex, while financially sound in leverage, suffers from zero interest coverage, signaling earnings risk. Cognex’s stronger Altman Z-Score and Piotroski Score indicate better financial health. However, Trimble’s diversified operations and robust interest coverage provide a more balanced risk profile. Recent data shows Cognex’s higher P/E (52.8) and weaker liquidity contrast with Trimble’s steadier capital structure. Overall, Trimble edges out as the safer, more risk-adjusted choice despite volatility.
Final Verdict: Which stock to choose?
Trimble Inc. (TRMB) excels as a cash-efficient innovator with solid operational control and a strong balance sheet. Its point of vigilance lies in declining profitability and shrinking returns on invested capital. TRMB suits portfolios aiming for disciplined, aggressive growth tempered by operational expertise.
Cognex Corporation (CGNX) boasts a strategic moat in its specialized vision technology and recurring revenue base. It carries a safer liquidity profile than TRMB, with stronger financial health scores. CGNX fits well in GARP portfolios seeking steady growth with a reasonable risk buffer.
If you prioritize operational efficiency and aggressive innovation, TRMB is the compelling choice due to its cash conversion capabilities despite profitability challenges. However, if you seek stability with a clear technological moat and healthier liquidity, CGNX offers better stability and smoother growth prospects, albeit at a premium.
Disclaimer: Investment carries a risk of loss of initial capital. The past performance is not a reliable indicator of future results. Be sure to understand risks before making an investment decision.
Go Further
I encourage you to read the complete analyses of Trimble Inc. and Cognex Corporation to enhance your investment decisions: