Home > Comparison > Technology > TDY vs CGNX
The strategic rivalry between Teledyne Technologies Incorporated and Cognex Corporation shapes the trajectory of the technology hardware sector. Teledyne operates as a diversified industrial technology powerhouse, integrating aerospace and defense electronics, while Cognex specializes in high-margin machine vision systems for manufacturing automation. This analysis contrasts their operational models and growth prospects to identify which company offers a superior risk-adjusted return potential for a diversified portfolio.
Table of contents
Companies Overview
Teledyne Technologies and Cognex Corporation stand as pivotal players in the industrial hardware and machine vision markets.
Teledyne Technologies Incorporated: Enabling Industrial Growth with Advanced Instrumentation
Teledyne Technologies dominates the industrial hardware sector, generating revenue through instrumentation, digital imaging, aerospace, and engineered systems. Its strategic focus in 2026 emphasizes expanding sensor networks, advanced imaging technologies, and defense electronics. The company leverages a diversified portfolio to serve environmental, medical, and aerospace markets globally.
Cognex Corporation: Innovator in Machine Vision Automation
Cognex leads in machine vision solutions that automate manufacturing and distribution globally. Its revenue stems from vision software, sensors, and image-based barcode readers, targeting sectors like automotive and pharmaceuticals. In 2026, Cognex prioritizes deep learning vision software and user-friendly programming tools to enhance automation efficiency and accuracy in discrete manufacturing.
Strategic Collision: Similar Technologies, Divergent Market Approaches
Teledyne pursues a broad, integrated systems approach across multiple industrial sectors, while Cognex specializes in precision machine vision software and sensors. Their primary battleground lies in manufacturing automation, where Teledyne’s hardware depth contrasts with Cognex’s software-centric innovation. Investors face distinct profiles: Teledyne offers diversified industrial exposure, whereas Cognex presents targeted growth in vision technology.
Income Statement Comparison
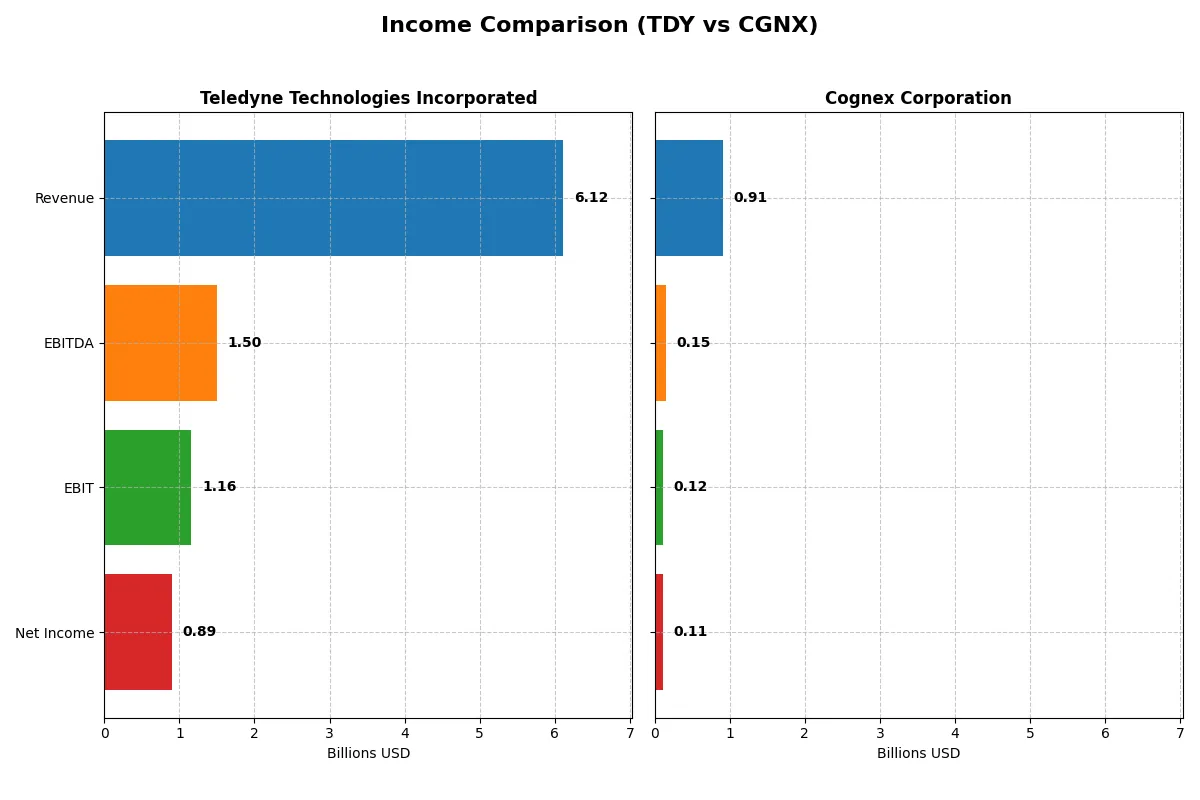
The following data dissects the core profitability and scalability of both corporate engines to reveal who dominates the bottom line:
| Metric | Teledyne Technologies (TDY) | Cognex Corporation (CGNX) |
|---|---|---|
| Revenue | 6.12B | 915M |
| Cost of Revenue | 3.72B | 289M |
| Operating Expenses | 1.25B | 511M |
| Gross Profit | 2.40B | 626M |
| EBITDA | 1.50B | 148M |
| EBIT | 1.16B | 115M |
| Interest Expense | 60M | 0 |
| Net Income | 895M | 106M |
| EPS | 18.88 | 0.62 |
| Fiscal Year | 2025 | 2024 |
Income Statement Analysis: The Bottom-Line Duel
This income statement comparison reveals how efficiently each company converts revenue into profit and sustains margin strength amid market shifts.
Teledyne Technologies Incorporated Analysis
Teledyne grew revenue by 7.9% in 2025 to $6.1B, nearly doubling net income over five years to $895M. Its gross margin hovers around 39%, while net margin stands at a robust 14.6%, reflecting disciplined cost controls. The firm boosted EBIT by 16.6% last year, signaling improving operating efficiency and solid earnings momentum.
Cognex Corporation Analysis
Cognex posted 9.2% revenue growth in 2024 to $915M but saw net income decline to $106M, down 40% over five years. Its gross margin is high at 68.4%, though net margin at 11.6% contracted recently. EBIT fell 6.2% last year, indicating margin pressure despite top-line gains and signaling challenges in sustaining profitability.
Margin Resilience vs. Earnings Growth
Teledyne clearly outperforms Cognex in bottom-line growth and margin expansion. While Cognex commands superior gross margins, its declining net income and EBIT highlight operational headwinds. Teledyne’s balanced growth and improving margins present a fundamentally stronger profile for investors prioritizing earnings quality and momentum.
Financial Ratios Comparison
These vital ratios act as a diagnostic tool to expose the underlying fiscal health, valuation premiums, and capital efficiency of the companies compared below:
| Ratios | Teledyne Technologies (TDY) | Cognex Corporation (CGNX) |
|---|---|---|
| ROE | 8.5% | 7.0% |
| ROIC | 6.8% | 5.1% |
| P/E | 27.3 | 57.9 |
| P/B | 2.33 | 4.05 |
| Current Ratio | 1.64 | 3.62 |
| Quick Ratio | 1.08 | 2.69 |
| D/E | 0.24 | 0.05 |
| Debt-to-Assets | 16.2% | 3.5% |
| Interest Coverage | 19.3 | 0 |
| Asset Turnover | 0.40 | 0.46 |
| Fixed Asset Turnover | 7.29 | 5.52 |
| Payout Ratio | 0% | 49.3% |
| Dividend Yield | 0% | 0.85% |
| Fiscal Year | 2025 | 2024 |
Efficiency & Valuation Duel: The Vital Signs
Financial ratios act as a company’s DNA, revealing hidden risks and operational excellence behind headline figures.
Teledyne Technologies Incorporated
Teledyne posts a solid 14.63% net margin but a modest 8.51% ROE, trailing its 8.22% WACC, signaling subdued profitability. The stock trades at a stretched 27.35 P/E, reflecting cautious investor appetite. With no dividend payout, Teledyne reinvests heavily in R&D, aiming for long-term growth and operational efficiency.
Cognex Corporation
Cognex shows a favorable 11.61% net margin but a weaker 7.0% ROE below its 10.88% WACC, indicating limited capital returns. Its valuation is expensive, with a 57.9 P/E and 4.05 P/B ratios stretching investor expectations. The small 0.85% dividend suggests modest shareholder returns amid ongoing growth investments.
Premium Valuation vs. Operational Safety
Teledyne balances moderate profitability with a reasonable valuation and strong liquidity, offering a more stable risk profile. Cognex’s high valuation and weaker returns increase risk despite solid margins. Investors seeking operational safety may prefer Teledyne, while growth-focused profiles might tolerate Cognex’s premium pricing.
Which one offers the Superior Shareholder Reward?
Teledyne Technologies (TDY) pays no dividends but generates robust free cash flow of $23.7/share in 2025, fueling substantial buybacks that enhance shareholder value sustainably. Cognex (CGNX) offers a modest 0.85% dividend yield with a 49% payout ratio, limiting reinvestment capacity. I see TDY’s aggressive buyback strategy and strong cash flow coverage as more attractive for total return in 2026.
Comparative Score Analysis: The Strategic Profile
The radar chart reveals the fundamental DNA and trade-offs of Teledyne Technologies and Cognex Corporation, highlighting their core financial strengths and vulnerabilities:
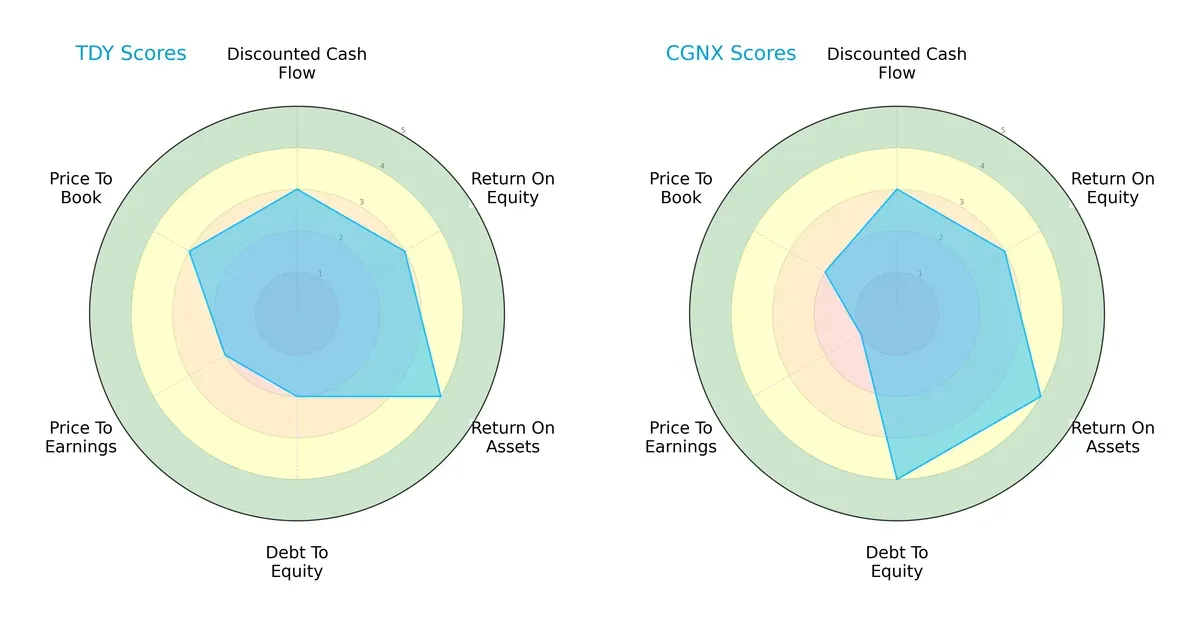
Both companies share moderate overall, DCF, and ROE scores, signaling comparable earnings quality and valuation discipline. Teledyne edges slightly in asset efficiency (ROA score 4 vs. 4) but shows weaker balance sheet strength (debt/equity score 2 vs. 4). Cognex’s low P/E score (1) signals potential overvaluation risk, contrasting Teledyne’s more balanced valuation metrics. Overall, Teledyne maintains a balanced profile, while Cognex leverages a robust capital structure but faces valuation pressure.
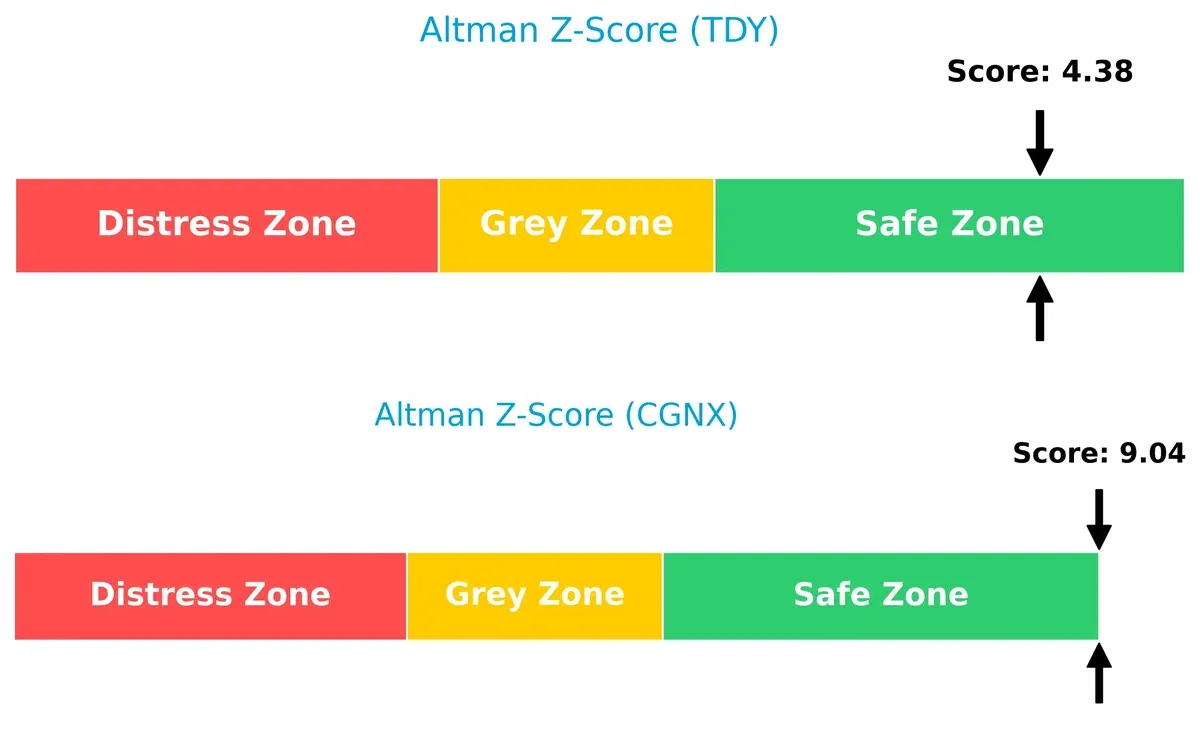
Bankruptcy Risk: Solvency Showdown
The Altman Z-Score gap favors Cognex (9.0) over Teledyne (4.4), both safely above distress thresholds, reflecting lower bankruptcy risk for Cognex in this cycle:
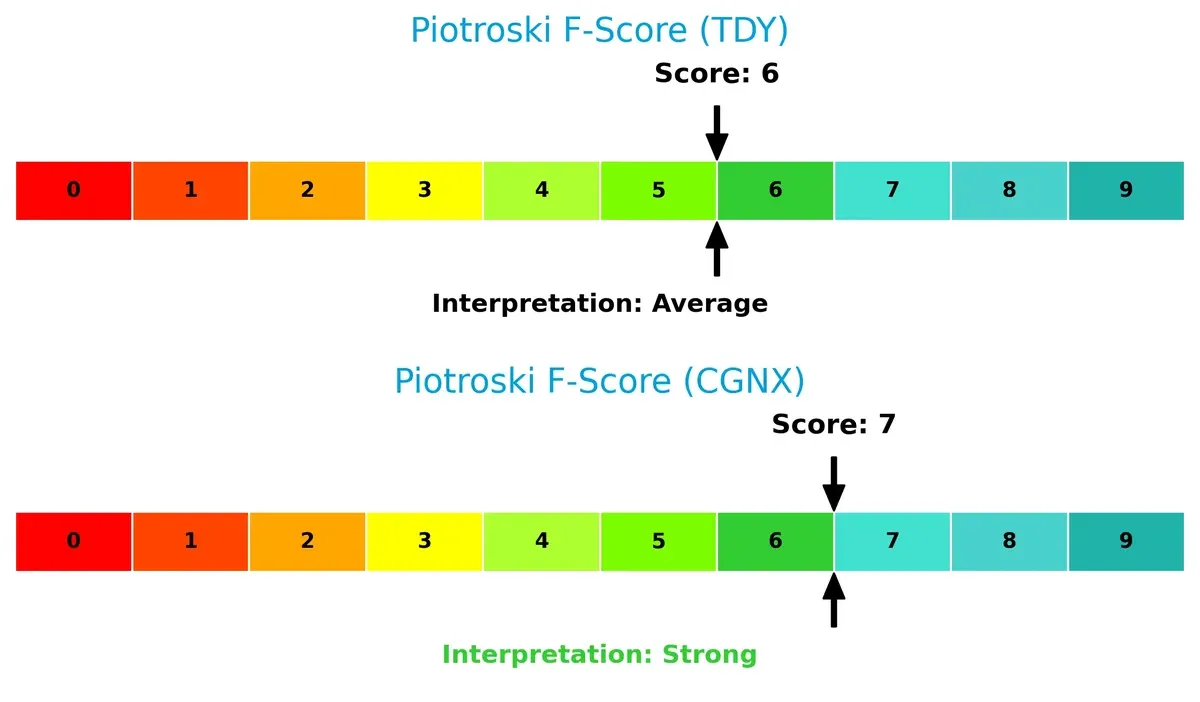
Financial Health: Quality of Operations
Cognex’s Piotroski score of 7 outperforms Teledyne’s 6, indicating stronger internal financial health and operational quality, with Teledyne showing minor red flags in efficiency or leverage metrics:
How are the two companies positioned?
This section dissects the operational DNA of TDY and CGNX by analyzing their revenue distribution across segments and evaluating their core strengths and weaknesses. The goal is to confront their economic moats and determine which business model delivers the most resilient, sustainable competitive advantage in today’s market environment.
Revenue Segmentation: The Strategic Mix
This visual comparison dissects how Teledyne Technologies and Cognex Corporation diversify their income streams and where their primary sector bets lie:
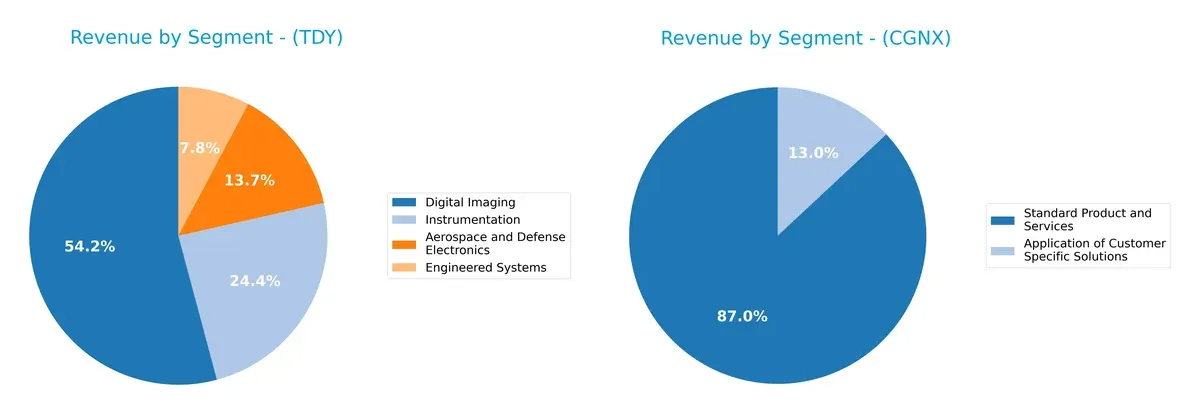
Teledyne Technologies anchors its revenue in Digital Imaging at $3.07B, supported by strong Instrumentation ($1.38B) and Aerospace & Defense Electronics ($777M). This mix shows a balanced diversification across high-tech sectors. Conversely, Cognex relies heavily on Standard Products and Services at $795M, with much smaller contributions from Customer-Specific Solutions ($119M). Teledyne’s broader portfolio reduces concentration risk, while Cognex’s focus signals reliance on core automation markets but exposes it to sector cyclicality.
Strengths and Weaknesses Comparison
This table compares the strengths and weaknesses of Teledyne Technologies Incorporated and Cognex Corporation:
TDY Strengths
- Diversified revenue across Aerospace, Digital Imaging, Instrumentation, and Engineered Systems
- Favorable net margin at 14.63%
- Strong current and quick ratios indicate solid liquidity
- Low debt-to-equity ratio at 0.24 and high interest coverage ratio
- Significant global presence with strong US and Europe sales
CGNX Strengths
- Favorable net margin at 11.61%
- Very low debt-to-equity ratio at 0.05
- Strong interest coverage with infinite ratio
- High quick ratio at 2.69
- Focused revenue from customer-specific and standard products, showing niche strength
TDY Weaknesses
- Unfavorable return on equity at 8.51% below WACC of 8.22%
- Price-to-earnings ratio of 27.35 considered high
- Asset turnover low at 0.4 indicates less efficient asset use
- No dividend yield may deter income investors
- Moderate unfavorable ratios overall (28.57%)
CGNX Weaknesses
- Unfavorable return on equity at 7.0% and higher WACC at 10.88%
- Very high price-to-earnings ratio of 57.9 and price-to-book of 4.05
- Unfavorable current ratio at 3.62 despite strong quick ratio
- Dividend yield low at 0.85% considered unfavorable
- Higher proportion of unfavorable ratios (50.0%)
Teledyne shows strength in diversification and liquidity but faces challenges in equity returns and valuation. Cognex demonstrates strong balance sheet metrics and niche market focus but struggles with valuation and return metrics. Both companies must navigate these factors within their strategic execution.
The Moat Duel: Analyzing Competitive Defensibility
A durable structural moat shields long-term profits from relentless competitive pressure. Here’s how Teledyne Technologies and Cognex stack up in 2026:
Teledyne Technologies Incorporated: Diversified Engineering Moat
Teledyne’s moat arises from its broad aerospace and industrial technology portfolio. Despite a slightly unfavorable ROIC vs. WACC, growing ROIC signals improving capital efficiency. Expansion into defense and energy markets could deepen its competitive edge.
Cognex Corporation: Machine Vision Software Moat
Cognex relies on patented vision software and barcode technologies, a narrower but specialized moat. Its declining ROIC and profitability warn of weakening competitive strength. New AI-driven vision tools offer potential but face fierce market disruption risks.
Verdict: Diversification vs. Specialization in Moat Resilience
Teledyne’s diversified industrial moat shows more durability with improving profitability, while Cognex’s specialized software moat struggles under margin pressure. I see Teledyne better positioned to defend and grow its market share in 2026.
Which stock offers better returns?
The past year reveals starkly divergent price dynamics between Teledyne Technologies and Cognex Corporation, highlighting Teledyne’s sharp growth against Cognex’s decline and recent mild recovery.
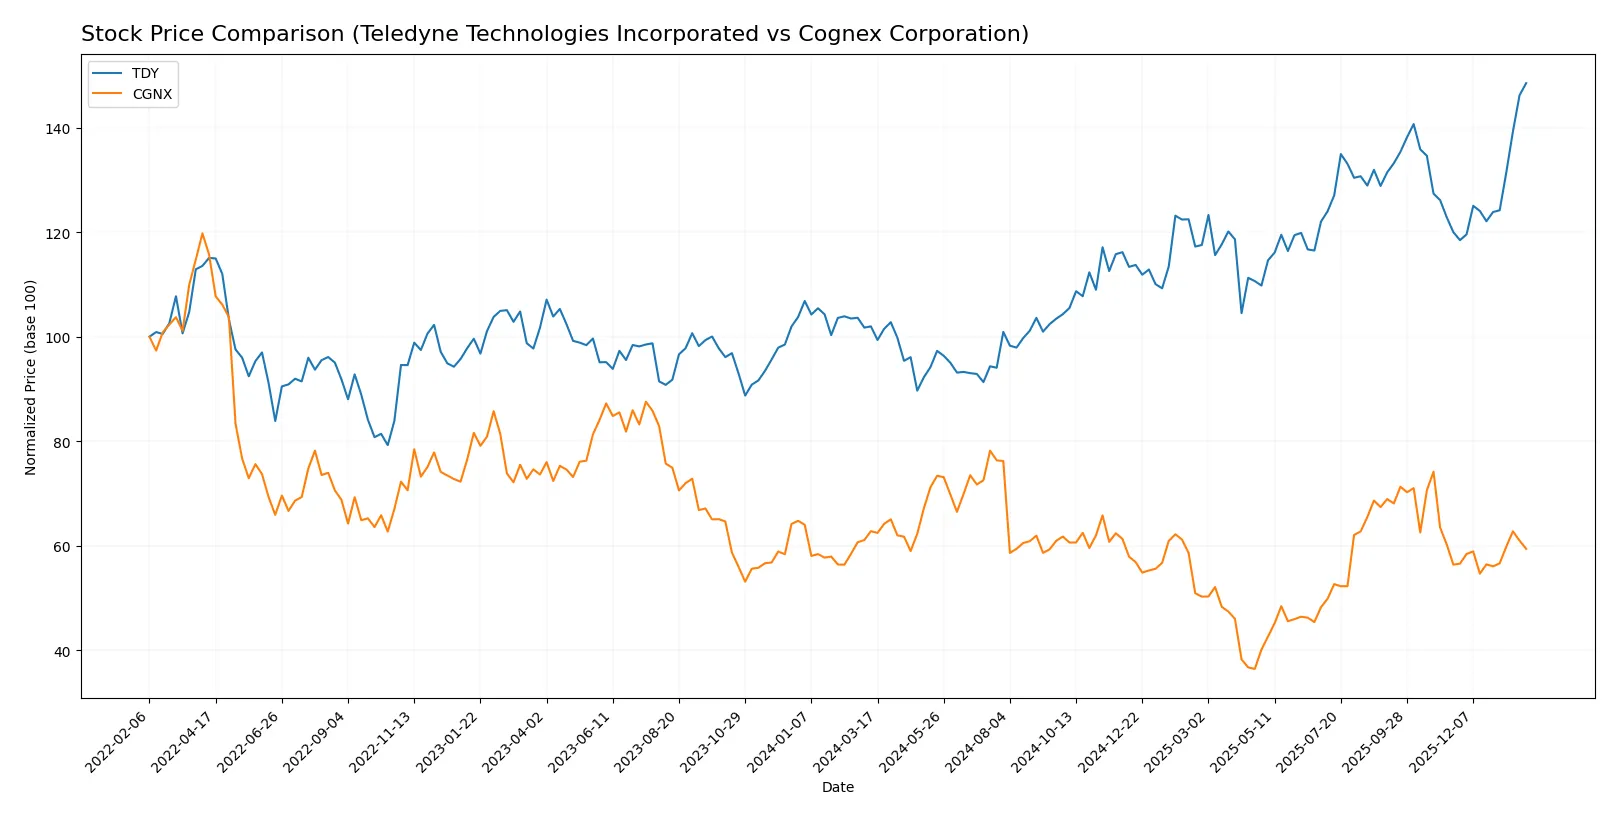
Trend Comparison
Teledyne Technologies posted a 45.62% price gain over the past 12 months, signaling a strong bullish trend with accelerating momentum and a high volatility level (std dev 58.2). The stock hit a peak of 620.3 and a trough of 374.64, reflecting robust upward movement.
Cognex Corporation experienced a 5.37% decline over the same period, marking a bearish trend despite recent acceleration and a slight rebound of 5.36% in the last 2.5 months. The stock showed low volatility (std dev 5.92) with a high at 50.98 and a low at 23.77.
Teledyne’s stock significantly outperformed Cognex, delivering the highest market gain and stronger momentum over the past year.
Target Prices
Analysts show a mixed but generally positive outlook on Teledyne Technologies and Cognex based on current target prices.
| Company | Target Low | Target High | Consensus |
|---|---|---|---|
| Teledyne Technologies Incorporated | 599 | 720 | 638.5 |
| Cognex Corporation | 38 | 58 | 48.14 |
Teledyne’s consensus target of 638.5 slightly exceeds its current price of 620.3, indicating moderate upside potential. Cognex’s consensus target of 48.14 stands well above its current 38.74 price, suggesting stronger expected growth.

Don’t Let Luck Decide Your Entry Point
Optimize your entry points with our advanced ProRealTime indicators. You’ll get efficient buy signals with precise price targets for maximum performance. Start outperforming now!
How do institutions grade them?
Teledyne Technologies Incorporated Grades
The following table summarizes recent institutional grades for Teledyne Technologies Incorporated.
| Grading Company | Action | New Grade | Date |
|---|---|---|---|
| Needham | Maintain | Buy | 2026-01-22 |
| Barclays | Maintain | Equal Weight | 2026-01-22 |
| Stifel | Maintain | Buy | 2026-01-22 |
| Citigroup | Maintain | Neutral | 2026-01-13 |
| Barclays | Maintain | Equal Weight | 2026-01-12 |
| Barclays | Maintain | Equal Weight | 2025-10-23 |
| Needham | Maintain | Buy | 2025-10-23 |
| Stifel | Maintain | Buy | 2025-10-23 |
| Morgan Stanley | Maintain | Equal Weight | 2025-10-15 |
| UBS | Maintain | Buy | 2025-07-24 |
Cognex Corporation Grades
The following table summarizes recent institutional grades for Cognex Corporation.
| Grading Company | Action | New Grade | Date |
|---|---|---|---|
| Barclays | Maintain | Overweight | 2026-01-12 |
| Truist Securities | Maintain | Hold | 2025-12-18 |
| Goldman Sachs | Upgrade | Buy | 2025-12-16 |
| JP Morgan | Downgrade | Underweight | 2025-12-03 |
| DA Davidson | Maintain | Neutral | 2025-11-03 |
| Barclays | Maintain | Overweight | 2025-10-31 |
| Baird | Maintain | Neutral | 2025-10-31 |
| Needham | Maintain | Buy | 2025-10-31 |
| Truist Securities | Maintain | Hold | 2025-10-08 |
| Goldman Sachs | Maintain | Sell | 2025-09-16 |
Which company has the best grades?
Teledyne Technologies holds consistently positive grades, mostly Buy and Equal Weight. Cognex shows mixed ratings, including upgrades and downgrades. Investors may view Teledyne’s steadier grades as a sign of consensus stability.
Risks specific to each company
The following categories identify the critical pressure points and systemic threats facing both firms in the 2026 market environment:
1. Market & Competition
Teledyne Technologies Incorporated
- Operates in diverse industrial tech markets with moderate beta (1.03), facing competition from established aerospace and defense suppliers.
Cognex Corporation
- Focuses on machine vision products with high beta (1.52), exposed to rapid tech shifts and aggressive competitors in automation.
2. Capital Structure & Debt
Teledyne Technologies Incorporated
- Maintains a conservative debt-to-equity ratio of 0.24 and strong interest coverage of 19.5x, indicating low financial risk.
Cognex Corporation
- Shows very low leverage (debt-to-equity 0.05) and infinite interest coverage, reflecting solid balance sheet but with less capital cushion.
3. Stock Volatility
Teledyne Technologies Incorporated
- Beta near market average (1.03) implies typical sensitivity to market swings, with historical price range of 419-631.
Cognex Corporation
- Higher beta (1.52) signals greater stock price volatility, with wider range 23-50, increasing trading risk for investors.
4. Regulatory & Legal
Teledyne Technologies Incorporated
- Aerospace and defense focus subjects TDY to stringent government regulations and export controls, a persistent compliance challenge.
Cognex Corporation
- Machine vision solutions face evolving product safety and data privacy laws, requiring ongoing adaptation to regulatory environments.
5. Supply Chain & Operations
Teledyne Technologies Incorporated
- Global industrial footprint exposes TDY to supply chain disruptions and rising input costs, especially in electronics components.
Cognex Corporation
- Dependent on semiconductor and optical component suppliers, CGNX faces risks from chip shortages and logistics delays.
6. ESG & Climate Transition
Teledyne Technologies Incorporated
- Increasing pressure to reduce emissions and improve sustainability in manufacturing and defense applications could raise compliance costs.
Cognex Corporation
- ESG risks include energy use in operations and supply chain scrutiny, with opportunities in enabling greener automation technologies.
7. Geopolitical Exposure
Teledyne Technologies Incorporated
- Significant sales in US, Canada, UK, and Europe expose TDY to trade tensions and geopolitical uncertainty impacting defense budgets.
Cognex Corporation
- Global customer base links CGNX to risks from international trade disputes and regional economic slowdowns affecting capital spending.
Which company shows a better risk-adjusted profile?
Teledyne’s largest risk lies in regulatory and geopolitical pressures typical for aerospace and defense firms. Cognex faces pronounced market volatility and supply chain fragility in a fast-evolving tech niche. Teledyne’s stronger capital structure and moderate beta offer a more balanced risk-adjusted profile. Cognex’s higher beta and stretched valuation raise caution. Notably, Cognex’s P/E ratio near 58 versus Teledyne’s 27 signals overvaluation risks amid competitive pressures, underscoring my guarded stance on CGNX’s risk-return tradeoff.
Final Verdict: Which stock to choose?
Teledyne Technologies (TDY) boasts a superpower in its operational efficiency and strong cash flow generation, underpinning steady profitability growth. Its point of vigilance lies in value destruction indicated by ROIC below WACC, signaling cautious capital allocation. TDY suits portfolios aiming for disciplined, long-term industrial growth with moderate risk.
Cognex Corporation (CGNX) commands a strategic moat through its advanced vision technology and recurring revenue streams, offering a safety cushion in volatile markets. Despite a concerning decline in profitability and higher valuation multiples, CGNX appeals to investors prioritizing innovation exposure with a tolerance for earnings volatility. It fits a GARP (Growth at a Reasonable Price) profile with cautious optimism.
If you prioritize operational resilience and improving profitability, TDY outshines due to its growing cash flow and stable income statement. However, if you seek exposure to cutting-edge tech with recurring revenue and can accept earnings headwinds, CGNX offers better strategic positioning despite current financial challenges. Both present distinct analytical scenarios depending on your risk appetite and growth thesis.
Disclaimer: Investment carries a risk of loss of initial capital. The past performance is not a reliable indicator of future results. Be sure to understand risks before making an investment decision.
Go Further
I encourage you to read the complete analyses of Teledyne Technologies Incorporated and Cognex Corporation to enhance your investment decisions: