Home > Comparison > Technology > TEL vs CGNX
The strategic rivalry between TE Connectivity Ltd. and Cognex Corporation shapes the hardware, equipment, and parts industry’s future. TE Connectivity operates as a capital-intensive industrial giant, delivering connectivity and sensor solutions globally. Cognex, by contrast, specializes in high-tech machine vision products, automating manufacturing processes with precision. This head-to-head pits scale and diversification against cutting-edge innovation. This analysis will reveal which trajectory offers superior risk-adjusted returns for a diversified portfolio in 2026.
Table of contents
Companies Overview
TE Connectivity and Cognex Corporation each play pivotal roles in the hardware and equipment sectors, shaping industrial automation and connectivity worldwide.
TE Connectivity Ltd.: Global Connectivity Leader
TE Connectivity commands a market position as a global manufacturer of connectivity and sensor solutions. Its core revenue derives from three segments: Transportation, Industrial, and Communications Solutions, serving diverse markets from automotive to medical. In 2026, the company focuses strategically on expanding its sensor technologies and enhancing system integration across 140 countries.
Cognex Corporation: Machine Vision Innovator
Cognex specializes in machine vision systems that automate manufacturing and distribution processes. Its revenue engine is built on patented vision software and sensors that inspect and guide products across industries like electronics and pharmaceuticals. The 2026 strategy emphasizes advancing deep learning vision software and expanding barcode reading technology to increase automation efficiency.
Strategic Collision: Similarities & Divergences
Both firms operate in hardware but diverge sharply in philosophy; TE Connectivity pursues broad-based connectivity solutions, while Cognex focuses narrowly on visual automation. Their primary battleground lies in industrial automation, where connectivity and vision systems increasingly converge. Investors face distinct profiles: TE offers diversified product exposure, while Cognex delivers specialized innovation in machine vision.
Income Statement Comparison
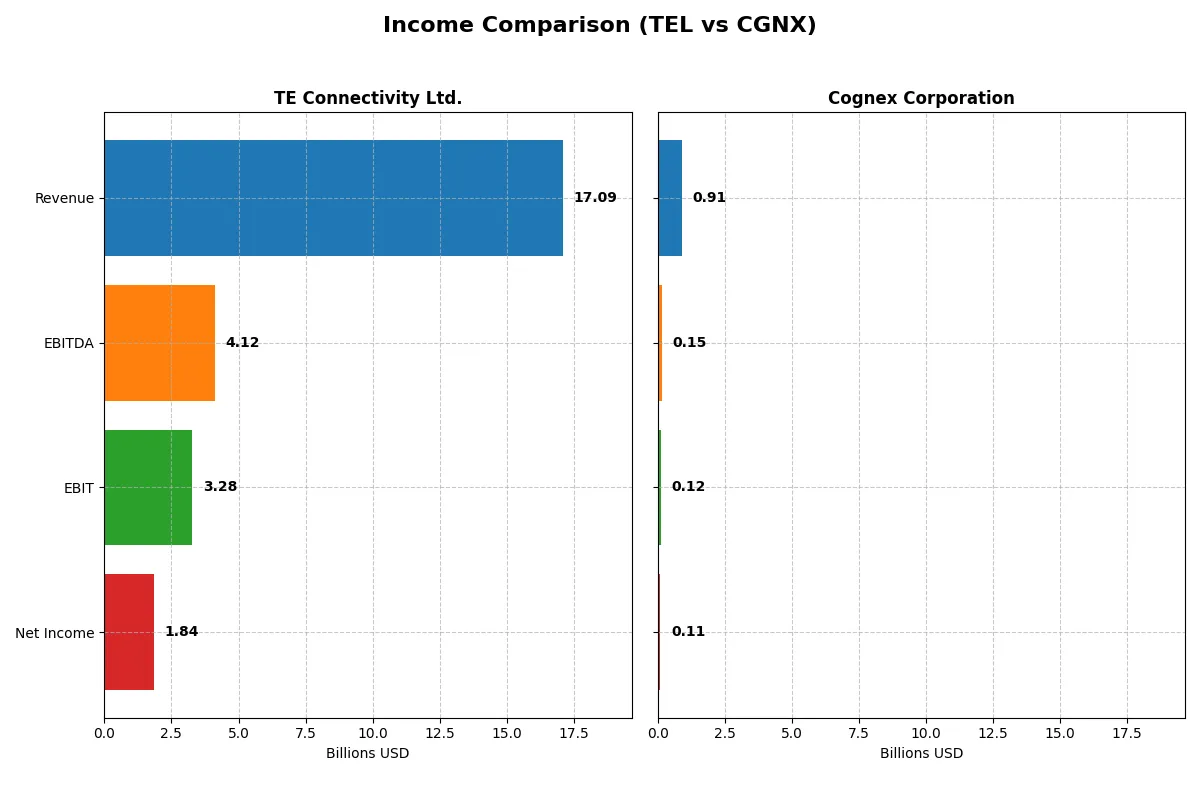
This data dissects the core profitability and scalability of both corporate engines to reveal who dominates the bottom line:
| Metric | TE Connectivity Ltd. (TEL) | Cognex Corporation (CGNX) |
|---|---|---|
| Revenue | 17B | 915M |
| Cost of Revenue | 11.18B | 289M |
| Operating Expenses | 2.7B | 511M |
| Gross Profit | 5.91B | 626M |
| EBITDA | 4.12B | 148M |
| EBIT | 3.28B | 115M |
| Interest Expense | 77M | 0 |
| Net Income | 1.84B | 106M |
| EPS | 6.2 | 0.62 |
| Fiscal Year | 2025 | 2024 |
Income Statement Analysis: The Bottom-Line Duel
This income statement comparison reveals the true efficiency of each company’s profit engine through their revenue, margins, and net income trends.
TE Connectivity Ltd. Analysis
TE Connectivity’s revenue grew steadily from $14.9B in 2021 to $17.1B in 2025, showing a 14.5% increase overall. Its gross margin holds favorably at 34.6%, supporting a solid EBIT margin near 19.2%. Despite a 46.5% net margin decline in the latest year, TE maintains strong operational discipline, reflected in a 14.4% EBIT growth momentum.
Cognex Corporation Analysis
Cognex posted revenue growth from $811M in 2020 to $915M in 2024, a 12.8% rise, with an impressive gross margin of 68.4%. However, EBIT and net income both declined recently, with net margin slipping 14.1%. Though operating expenses scaled efficiently with revenue, profitability contraction marks a cautionary trend for the latest fiscal year.
Margin Strength vs. Profit Sustainability
TE Connectivity outpaces Cognex with higher absolute revenue and stronger EBIT margin expansion. Cognex boasts superior gross margins but faces sharper net margin erosion and declining profitability. TE’s profile suits investors prioritizing stable profit growth, while Cognex’s margin power needs to translate into sustainable bottom-line gains for long-term appeal.
Financial Ratios Comparison
These vital ratios act as a diagnostic tool to expose the underlying fiscal health, valuation premiums, and capital efficiency of the companies compared below:
| Ratios | TE Connectivity Ltd. (TEL) | Cognex Corporation (CGNX) |
|---|---|---|
| ROE | 14.64% | 6.99% |
| ROIC | 8.82% | 5.07% |
| P/E | 35.0 | 57.9 |
| P/B | 5.12 | 4.05 |
| Current Ratio | 1.56 | 3.62 |
| Quick Ratio | 1.03 | 2.69 |
| D/E | 0.52 | 0.05 |
| Debt-to-Assets | 26.1% | 3.5% |
| Interest Coverage | 41.7 | 0 |
| Asset Turnover | 0.68 | 0.46 |
| Fixed Asset Turnover | 3.96 | 5.52 |
| Payout ratio | 43.6% | 49.3% |
| Dividend yield | 1.25% | 0.85% |
| Fiscal Year | 2025 | 2024 |
Efficiency & Valuation Duel: The Vital Signs
Financial ratios act as a company’s DNA, uncovering hidden risks and operational strengths that numbers alone can’t reveal.
TE Connectivity Ltd.
TE Connectivity displays solid operational efficiency with a neutral ROE of 14.6% and net margin at a favorable 10.8%. However, its valuation looks stretched, with a high P/E of 35 and a P/B of 5.12, suggesting investor optimism. The company balances modest 1.25% dividends with continued reinvestment in R&D, supporting sustained growth.
Cognex Corporation
Cognex’s profitability metrics lag, showing an unfavorable ROE of 7.0% despite a favorable net margin of 11.6%. Its valuation appears highly stretched, with a P/E near 58 and P/B of 4.05. The firm maintains strong liquidity and low debt, but reinvests heavily in R&D rather than returning cash via dividends, reflecting a growth-focused strategy.
Valuation Stretch vs. Operational Strength
TE Connectivity offers a more balanced risk-reward profile by combining operational efficiency with reasonable shareholder returns despite elevated valuation. Cognex presents greater valuation risk with weaker returns but a growth-oriented capital allocation. Investors seeking stability may prefer TE, while growth seekers might tolerate Cognex’s stretched multiples.
Which one offers the Superior Shareholder Reward?
TE Connectivity (TEL) pays a 1.25% dividend yield with a 44% payout ratio, supported by robust free cash flow (FCF) coverage above 2.3x. Its share buybacks are steady, enhancing total returns sustainably. Cognex (CGNX) yields only 0.85%, with a near 49% payout ratio but far higher valuation multiples (P/E ~58x vs. TEL’s ~35x). CGNX’s free cash flow supports dividends but trades at a premium, limiting capital return upside. TEL’s balanced dividend and buyback strategy offers the superior, more sustainable total shareholder reward in 2026.
Comparative Score Analysis: The Strategic Profile
The radar chart reveals the fundamental DNA and trade-offs of TE Connectivity Ltd. and Cognex Corporation, highlighting their financial strengths and vulnerabilities:
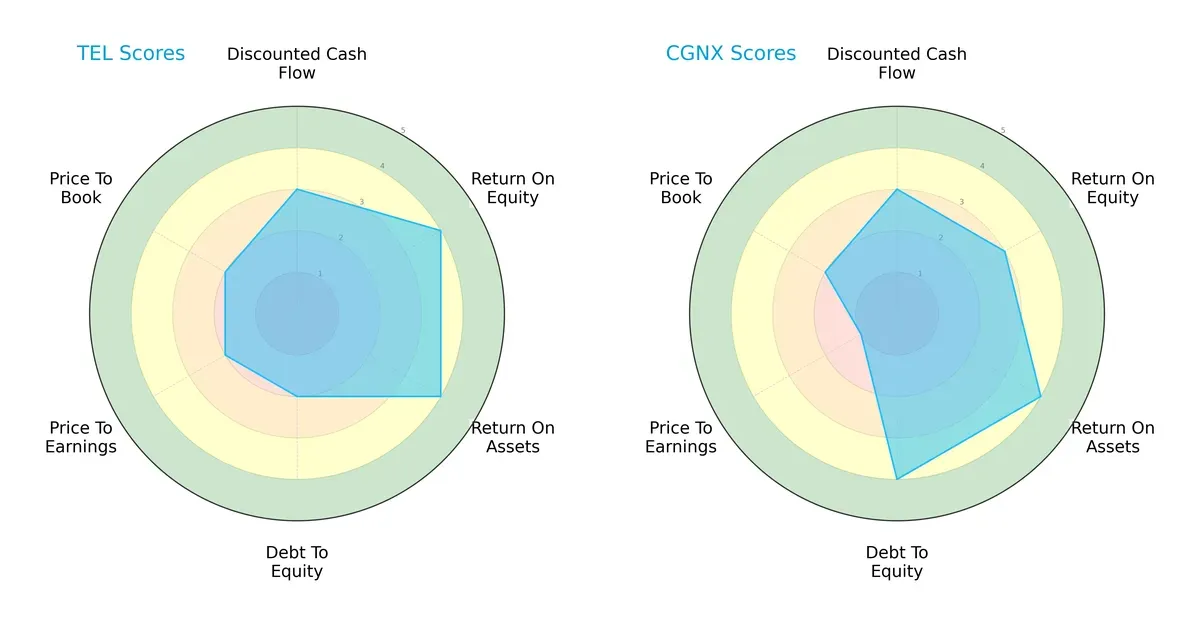
TE Connectivity displays a more balanced profile with favorable ROE and ROA scores (4 each), but moderate leverage and valuation metrics. Cognex relies on a strong balance sheet with a superior debt-to-equity score (4), yet it shows a weaker ROE (3) and a very unfavorable P/E score (1). TE’s diversified strengths suggest steadier operational efficiency, while Cognex leans on financial stability to offset valuation concerns.
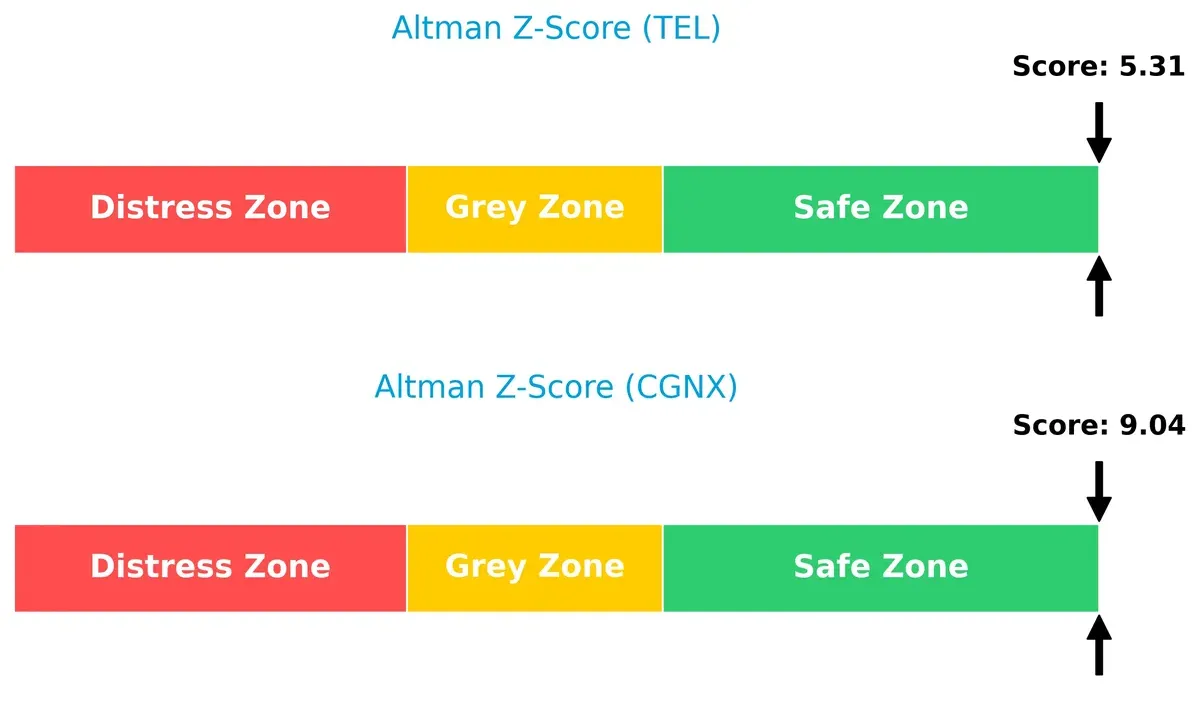
Bankruptcy Risk: Solvency Showdown
The Altman Z-Score gap shows that both firms are comfortably in the safe zone, though Cognex’s higher score signals even stronger solvency and lower bankruptcy risk in this cycle:
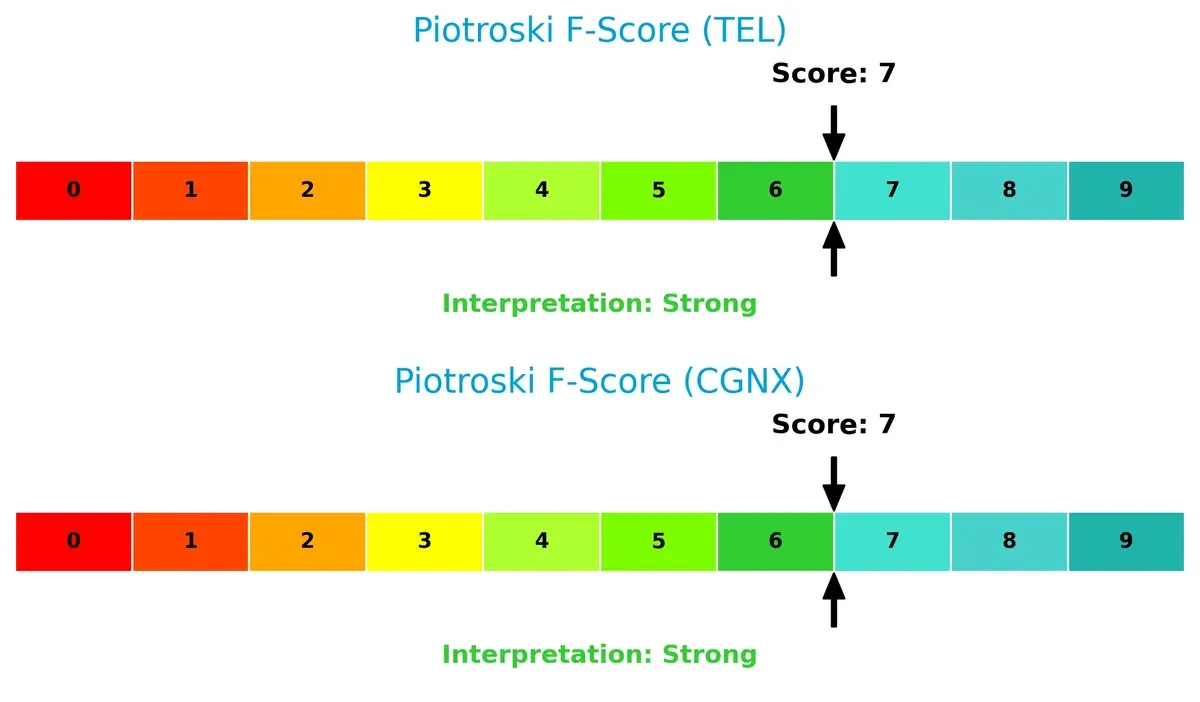
Financial Health: Quality of Operations
Both TE Connectivity and Cognex score 7 on the Piotroski F-Score, indicating strong financial health. Neither shows red flags, suggesting solid profitability, liquidity, and operational efficiency:
How are the two companies positioned?
This section dissects TEL and CGNX’s operational DNA by comparing revenue distribution and internal dynamics. The goal is to confront their economic moats and identify the most resilient competitive advantage.
Revenue Segmentation: The Strategic Mix
This visual comparison dissects how TE Connectivity Ltd. and Cognex Corporation diversify income streams and where their primary sector bets lie:
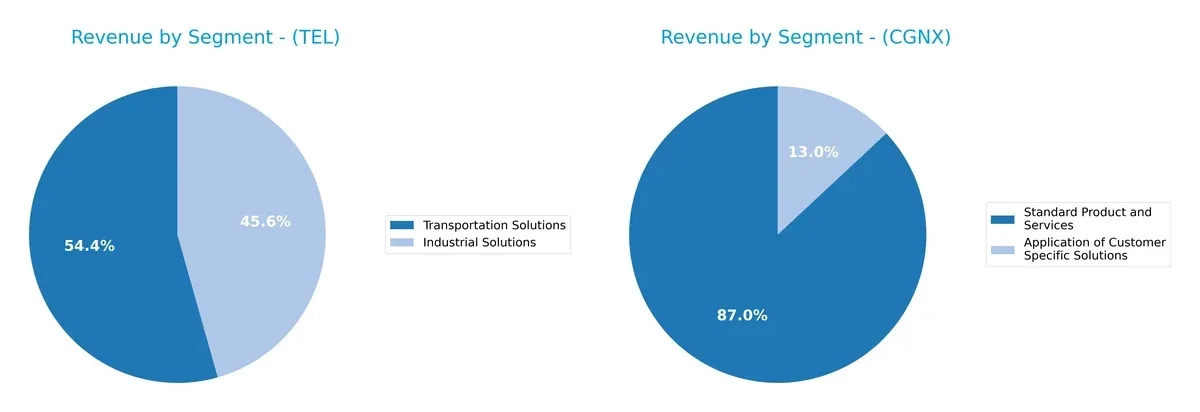
TE Connectivity leans heavily on two dominant segments: Transportation Solutions at $9.4B and Industrial Solutions at $7.9B, anchoring its revenue in infrastructure-related markets. Cognex pivots around Standard Product and Services at $795M, with a smaller $119M from Customer Specific Solutions, showing a less diversified but focused portfolio. TE’s dual-segment strength signals ecosystem lock-in, while Cognex faces concentration risk but benefits from specialized product focus.
Strengths and Weaknesses Comparison
This table compares the Strengths and Weaknesses of TE Connectivity Ltd. and Cognex Corporation:
TEL Strengths
- Diverse industrial and transportation product segments
- Strong presence in China, US, and Asia-Pacific
- Favorable net margin and debt metrics
- Solid interest coverage and fixed asset turnover
CGNX Strengths
- Focused high-margin product lines
- Favorable net margin and low debt-to-assets
- Excellent interest coverage with infinite value
- High fixed asset turnover indicating efficiency
TEL Weaknesses
- Unfavorable valuation ratios (PE 35, PB 5.12)
- Neutral ROE and ROIC below WACC
- Moderate asset turnover
- Dividend yield neutral
CGNX Weaknesses
- High PE (57.9) and unfavorable ROE
- Unfavorable WACC and some liquidity concerns
- Lower asset turnover compared to TEL
- Dividend yield unfavorable despite solid profitability
Both companies show strong profitability and debt management but face valuation and efficiency challenges. TEL’s broad diversification contrasts with CGNX’s focused product approach, shaping distinct strategic imperatives.
The Moat Duel: Analyzing Competitive Defensibility
A structural moat alone shields long-term profits from relentless competition and margin erosion. Let’s dissect two firms’ moats in 2026:
TE Connectivity Ltd.: Scale and Diversification Moat
TE Connectivity leans on scale and diversified end markets as its moat. It sustains margin stability despite a declining ROIC trend. Expanding automotive sensors could deepen its competitive edge.
Cognex Corporation: Technology-Driven Niche Moat
Cognex’s moat stems from patented machine vision technology, contrasting TE’s broad diversification. Its high gross margins reflect pricing power but a shrinking ROIC signals emerging pressures. Deep learning software offers growth avenues.
Verdict: Scale Diversity vs. Tech Specialization
Both firms face declining ROICs, signaling value erosion. TE’s wider moat derives from diversified markets and scale, better cushioning it against disruption. Cognex’s narrower tech moat faces tougher sustainability challenges. TE is better positioned to defend market share.
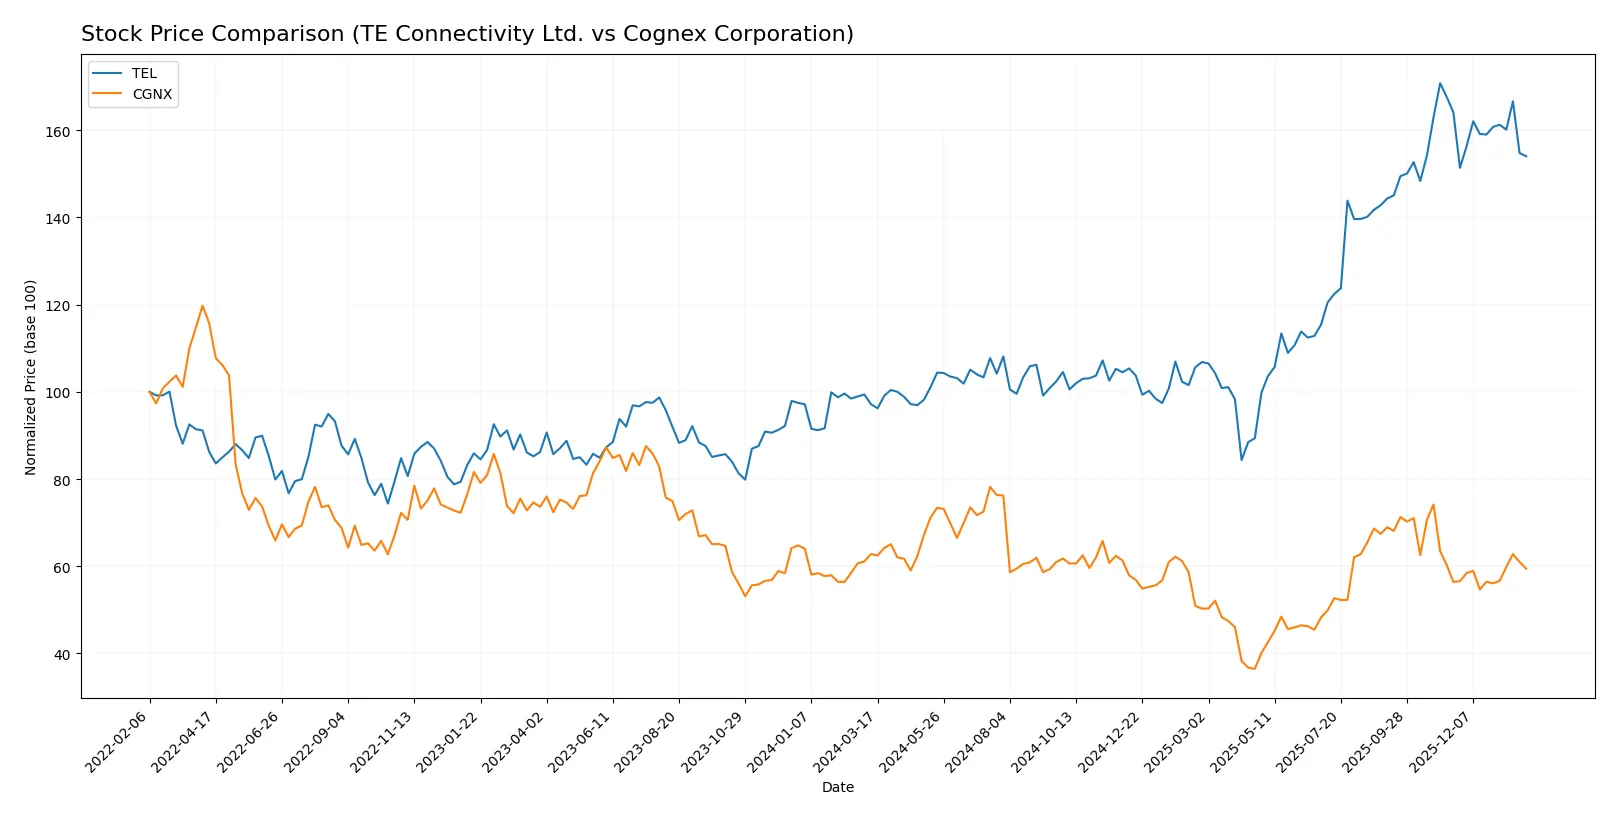
Which stock offers better returns?
Over the past 12 months, TE Connectivity’s stock gained 58.53% with a decelerating uptrend, while Cognex saw a 5.37% decline despite recent upward momentum.
Trend Comparison
TE Connectivity’s stock rose 58.53% over the past year, marking a strong bullish trend with high volatility and a recent deceleration phase.
Cognex’s stock fell 5.37% over the same period, showing a bearish trend but with signs of recent acceleration and a modest recovery.
TE Connectivity outperformed Cognex by a wide margin, delivering the highest market performance over the 12-month span.
Target Prices
Analysts present a cautiously optimistic consensus for TE Connectivity Ltd. and Cognex Corporation.
| Company | Target Low | Target High | Consensus |
|---|---|---|---|
| TE Connectivity Ltd. | 238 | 306 | 270.29 |
| Cognex Corporation | 38 | 58 | 48.14 |
TE Connectivity’s target consensus sits about 21% above its current price of 223, indicating potential upside. Cognex’s consensus target exceeds its current price by roughly 24%, reflecting moderate analyst confidence.

Don’t Let Luck Decide Your Entry Point
Optimize your entry points with our advanced ProRealTime indicators. You’ll get efficient buy signals with precise price targets for maximum performance. Start outperforming now!
How do institutions grade them?
TE Connectivity Ltd. Grades
The following table summarizes recent grade changes and maintenances for TE Connectivity Ltd.:
| Grading Company | Action | New Grade | Date |
|---|---|---|---|
| Oppenheimer | Upgrade | Outperform | 2026-01-27 |
| Barclays | Maintain | Overweight | 2026-01-23 |
| Wells Fargo | Maintain | Equal Weight | 2026-01-22 |
| Truist Securities | Maintain | Hold | 2026-01-22 |
| UBS | Maintain | Buy | 2026-01-14 |
| Truist Securities | Maintain | Hold | 2025-12-19 |
| Wells Fargo | Maintain | Equal Weight | 2025-12-09 |
| Barclays | Maintain | Overweight | 2025-11-21 |
| Truist Securities | Maintain | Hold | 2025-11-21 |
| TD Cowen | Maintain | Buy | 2025-11-17 |
Cognex Corporation Grades
The following table summarizes recent grade changes and maintenances for Cognex Corporation:
| Grading Company | Action | New Grade | Date |
|---|---|---|---|
| Barclays | Maintain | Overweight | 2026-01-12 |
| Truist Securities | Maintain | Hold | 2025-12-18 |
| Goldman Sachs | Upgrade | Buy | 2025-12-16 |
| JP Morgan | Downgrade | Underweight | 2025-12-03 |
| DA Davidson | Maintain | Neutral | 2025-11-03 |
| Barclays | Maintain | Overweight | 2025-10-31 |
| Baird | Maintain | Neutral | 2025-10-31 |
| Needham | Maintain | Buy | 2025-10-31 |
| Truist Securities | Maintain | Hold | 2025-10-08 |
| Goldman Sachs | Maintain | Sell | 2025-09-16 |
Which company has the best grades?
TE Connectivity Ltd. holds generally stronger and more consistent buy and outperform ratings than Cognex Corporation. This may encourage investor confidence and suggest better market perception.
Risks specific to each company
The following categories identify critical pressure points and systemic threats facing both TE Connectivity Ltd. and Cognex Corporation in the 2026 market environment:
1. Market & Competition
TE Connectivity Ltd.
- Established global presence with diversified industrial segments; faces intense competition in hardware and sensor markets.
Cognex Corporation
- Focused on machine vision niche; higher beta indicates greater sensitivity to market swings and competitive pressure in automation sector.
2. Capital Structure & Debt
TE Connectivity Ltd.
- Moderate debt-to-equity ratio (0.52) with strong interest coverage (42.6x) signals stable leverage management.
Cognex Corporation
- Minimal debt (0.05 D/E) greatly reduces financial risk; near infinite interest coverage shows no immediate solvency concerns.
3. Stock Volatility
TE Connectivity Ltd.
- Beta of 1.24 suggests moderate volatility, aligned with industry norms.
Cognex Corporation
- Higher beta of 1.52 reflects greater stock price fluctuation and market sensitivity.
4. Regulatory & Legal
TE Connectivity Ltd.
- Operates globally, exposing it to complex international regulatory environments and compliance costs.
Cognex Corporation
- Primarily US-based, regulatory risks concentrated domestically but less diversified internationally.
5. Supply Chain & Operations
TE Connectivity Ltd.
- Large, complex supply chain across 140 countries increases exposure to disruption risks.
Cognex Corporation
- Smaller scale and focused product range may reduce supply chain complexity but increase dependency on key suppliers.
6. ESG & Climate Transition
TE Connectivity Ltd.
- As a diversified industrial, faces pressure to meet broad ESG standards and decarbonization targets.
Cognex Corporation
- Technology-focused firm with less direct environmental footprint but increasing scrutiny on product lifecycle impacts.
7. Geopolitical Exposure
TE Connectivity Ltd.
- Swiss base and global footprint imply exposure to geopolitical tensions, currency risks, and trade policy shifts.
Cognex Corporation
- US-centric operations limit geographic risks but increase vulnerability to domestic political and policy changes.
Which company shows a better risk-adjusted profile?
TE Connectivity’s largest risk lies in its complex global supply chain and geopolitical exposure, which can disrupt operations and margins. Cognex faces elevated stock volatility and valuation risks, with a high P/E ratio signaling market exuberance. Despite higher leverage, TE Connectivity’s stable capital structure and diversified markets provide a more balanced risk profile. Cognex’s minimal debt reduces financial risk but its valuation and competitive niche volatility raise concerns. The recent strong interest coverage of TE Connectivity reassures me about its ability to service debt amid market uncertainties, reinforcing its superior risk-adjusted stance.
Final Verdict: Which stock to choose?
TE Connectivity Ltd. (TEL) stands out for its operational muscle and robust cash generation, positioning it as a reliable industrial powerhouse. However, its declining profitability and value destruction signal a point of vigilance. TEL suits portfolios targeting steady industrial exposure with a tolerance for mid-cycle volatility.
Cognex Corporation (CGNX) commands a strategic moat through its specialized automation and vision technology, delivering recurring revenue safety. It offers a stronger balance sheet and lower financial risk compared to TEL. CGNX aligns well with investors seeking Growth at a Reasonable Price (GARP) in tech-driven innovation.
If you prioritize operational resilience and industrial leverage, TEL is the compelling choice due to its cash flow strength despite margin pressures. However, if you seek a tech moat with safer balance sheet metrics, CGNX offers better stability and strategic positioning, albeit at a premium valuation and slower growth. Both present distinct scenarios for discerning investors.
Disclaimer: Investment carries a risk of loss of initial capital. The past performance is not a reliable indicator of future results. Be sure to understand risks before making an investment decision.
Go Further
I encourage you to read the complete analyses of TE Connectivity Ltd. and Cognex Corporation to enhance your investment decisions: