Home > Comparison > Technology > SANM vs CGNX
The strategic rivalry between Sanmina Corporation and Cognex Corporation shapes the hardware equipment sector’s evolution. Sanmina operates as a capital-intensive integrated manufacturing solutions provider, while Cognex excels as a niche machine vision technology innovator. This contrast highlights a battle between scale-driven manufacturing breadth and specialized technological precision. This analysis will identify which approach offers superior risk-adjusted returns for diversified investors navigating the complex technology landscape.
Table of contents
Companies Overview
Sanmina Corporation and Cognex Corporation hold prominent roles in the hardware and equipment sector.
Sanmina Corporation: Integrated Manufacturing Powerhouse
Sanmina dominates as a global provider of integrated manufacturing solutions. It generates revenue through product design, component manufacturing, logistics, and after-market services. In 2026, Sanmina sharpens its focus on serving industrial, medical, aerospace, and cloud solution clients with end-to-end manufacturing and supply chain expertise.
Cognex Corporation: Vision Automation Specialist
Cognex leads in machine vision technology, automating manufacturing and distribution through visual data analysis. Its revenue stems from advanced vision software, sensors, and barcode readers tailored for electronics, automotive, and pharmaceuticals. The company prioritizes innovation in deep learning vision systems and user-friendly application development this year.
Strategic Collision: Similarities & Divergences
Sanmina and Cognex share a commitment to hardware innovation but diverge in approach: Sanmina integrates manufacturing end-to-end while Cognex specializes in visual automation tools. Their primary battle lies in advancing industrial automation capabilities. Sanmina offers a broad manufacturing platform; Cognex presents a niche, high-tech vision software profile—each appealing to distinct investor appetites.
Income Statement Comparison
This data dissects the core profitability and scalability of both corporate engines to reveal who dominates the bottom line:

| Metric | Sanmina Corporation (SANM) | Cognex Corporation (CGNX) |
|---|---|---|
| Revenue | 8.13B | 914.52M |
| Cost of Revenue | 7.41B | 288.72M |
| Operating Expenses | 362M | 511M |
| Gross Profit | 716M | 626M |
| EBITDA | 463M | 148M |
| EBIT | 344M | 115M |
| Interest Expense | 4.30M | 0 |
| Net Income | 246M | 106M |
| EPS | 4.56 | 0.62 |
| Fiscal Year | 2025 | 2024 |
Income Statement Analysis: The Bottom-Line Duel
This income statement comparison exposes which company operates with superior efficiency and profitability in their core business engines.
Sanmina Corporation Analysis
Sanmina’s revenue rose steadily from $6.7B in 2021 to $8.1B in 2025, showing a 7.4% growth last year. Net income, however, fluctuated and declined slightly over five years, ending at $246M in 2025. Gross margin remained stable near 8.8%, while net margin held around 3%, reflecting moderate profitability. Recent gross profit growth of 11.9% contrasts with a slight EBIT decline, indicating some cost pressures.
Cognex Corporation Analysis
Cognex’s revenue increased from $811M in 2020 to $915M in 2024, with a solid 9.2% rise last year. Net income dropped sharply by nearly 40% over five years, finishing at $106M in 2024. Margins impress with a gross margin above 68% and net margin at 11.6%, far exceeding Sanmina’s. Despite a recent dip in EBIT and net margin growth, Cognex sustains strong operational leverage and expense control.
Margin Strength vs. Revenue Scale
Sanmina commands scale with $8B+ revenue but struggles to convert top-line gains into consistent net income growth. Cognex excels in profitability and margin quality despite smaller revenue. For investors prioritizing margin robustness and operational efficiency, Cognex presents a more attractive profile. Sanmina appeals more to those focused on revenue expansion but faces margin and earnings pressure risks.
Financial Ratios Comparison
These vital ratios act as a diagnostic tool to expose the underlying fiscal health, valuation premiums, and capital efficiency of the companies compared below:
| Ratios | Sanmina Corporation (SANM) | Cognex Corporation (CGNX) |
|---|---|---|
| ROE | 10.4% | 7.0% |
| ROIC | 9.0% | 5.1% |
| P/E | 25.6 | 57.9 |
| P/B | 2.67 | 4.05 |
| Current Ratio | 1.72 | 3.62 |
| Quick Ratio | 1.02 | 2.69 |
| D/E | 0.17 | 0.05 |
| Debt-to-Assets | 6.7% | 3.5% |
| Interest Coverage | 82.5 | 0 (not reported) |
| Asset Turnover | 1.39 | 0.46 |
| Fixed Asset Turnover | 11.9 | 5.52 |
| Payout ratio | 0% | 49.3% |
| Dividend yield | 0% | 0.85% |
| Fiscal Year | 2025 | 2024 |
Efficiency & Valuation Duel: The Vital Signs
Financial ratios act as the company’s DNA, exposing hidden risks and operational excellence beyond surface-level metrics.
Sanmina Corporation
Sanmina shows neutral ROE at 10.45% with a modest 3.03% net margin, suggesting moderate profitability. Its P/E ratio of 25.59 appears stretched relative to sector norms. The firm lacks dividends but reinvests modestly in R&D (0.38% of revenue), balancing shareholder returns with growth initiatives.
Cognex Corporation
Cognex delivers a strong net margin of 11.61%, but a weak 7% ROE and high WACC at 10.88% raise concerns. Valuation is expensive, with a P/E of 57.9 and PB of 4.05, indicating stretched multiples. The company pays a small dividend (0.85%), yet heavily invests in R&D (15.29% of revenue) to fuel long-term growth.
Premium Valuation vs. Operational Safety
Sanmina offers a more balanced risk profile with healthier leverage and operational efficiency despite modest profitability. Cognex’s high valuation and cost of capital raise caution despite superior margins. Risk-tolerant investors seeking innovation may prefer Cognex, while those favoring operational safety may lean toward Sanmina.
Which one offers the Superior Shareholder Reward?
I compare Sanmina Corporation (SANM) and Cognex Corporation (CGNX) on their shareholder return strategies. SANM pays no dividends, focusing on reinvestment with zero payout but solid free cash flow of 8.6/share and moderate buybacks. CGNX offers a 0.85% dividend yield, covered at nearly 90% by free cash flow, combined with aggressive buybacks. Historically, CGNX’s distribution combines steady dividends and significant share repurchases, supporting a higher total return profile. SANM’s no-dividend stance hinges on reinvestment in operations, with lower margins and slower capital return. For 2026, I favor CGNX’s balanced, sustainable model, delivering superior shareholder reward through dividends and buybacks aligned with strong profitability.
Comparative Score Analysis: The Strategic Profile
The radar chart reveals the fundamental DNA and trade-offs of Sanmina Corporation and Cognex Corporation, highlighting their distinct financial strengths and weaknesses:
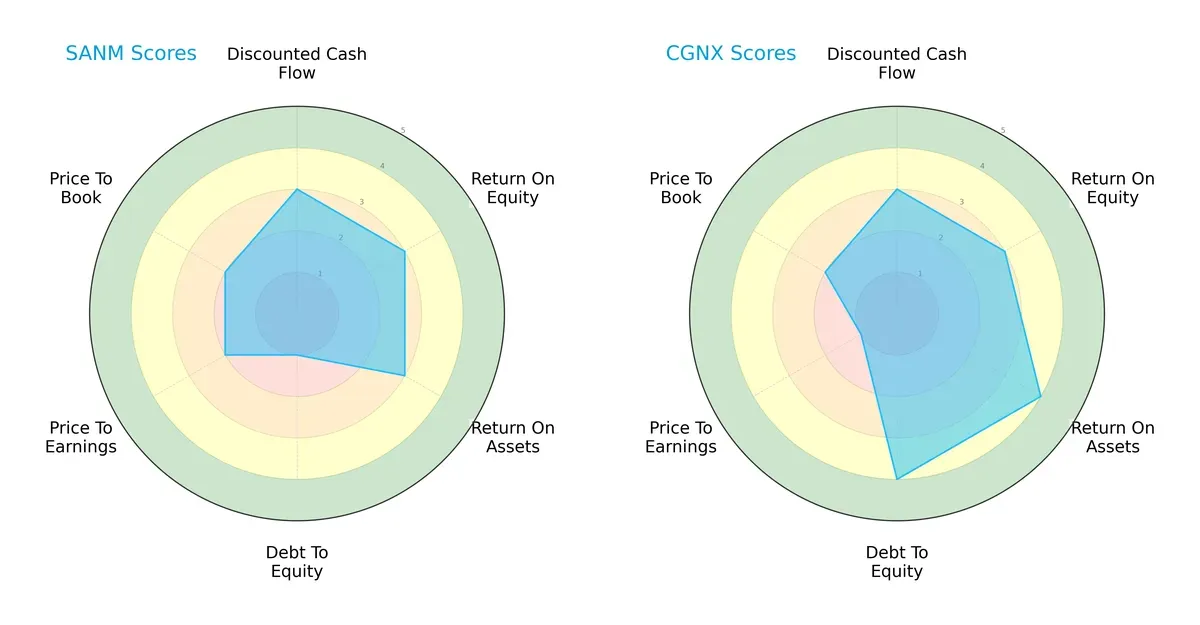
Sanmina shows moderate scores in DCF, ROE, and ROA but suffers from a very unfavorable debt-to-equity score, signaling high leverage risk. Cognex, by contrast, balances strong asset efficiency and a robust balance sheet, yet its valuation via P/E is very unfavorable. Overall, Cognex presents a more balanced profile, while Sanmina leans heavily on operational returns despite financial risk.
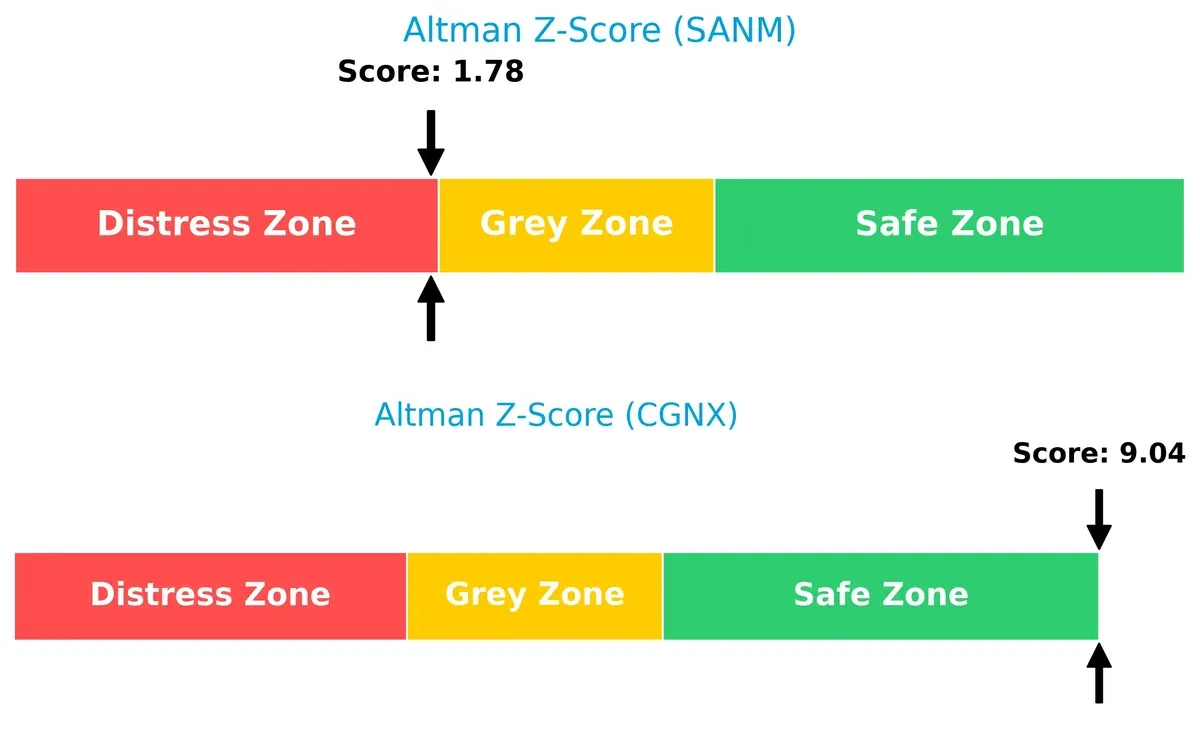
Bankruptcy Risk: Solvency Showdown
The Altman Z-Score gap exposes a stark contrast: Sanmina sits in the distress zone, indicating elevated bankruptcy risk, whereas Cognex remains securely in the safe zone, suggesting strong long-term survival prospects in this cycle:
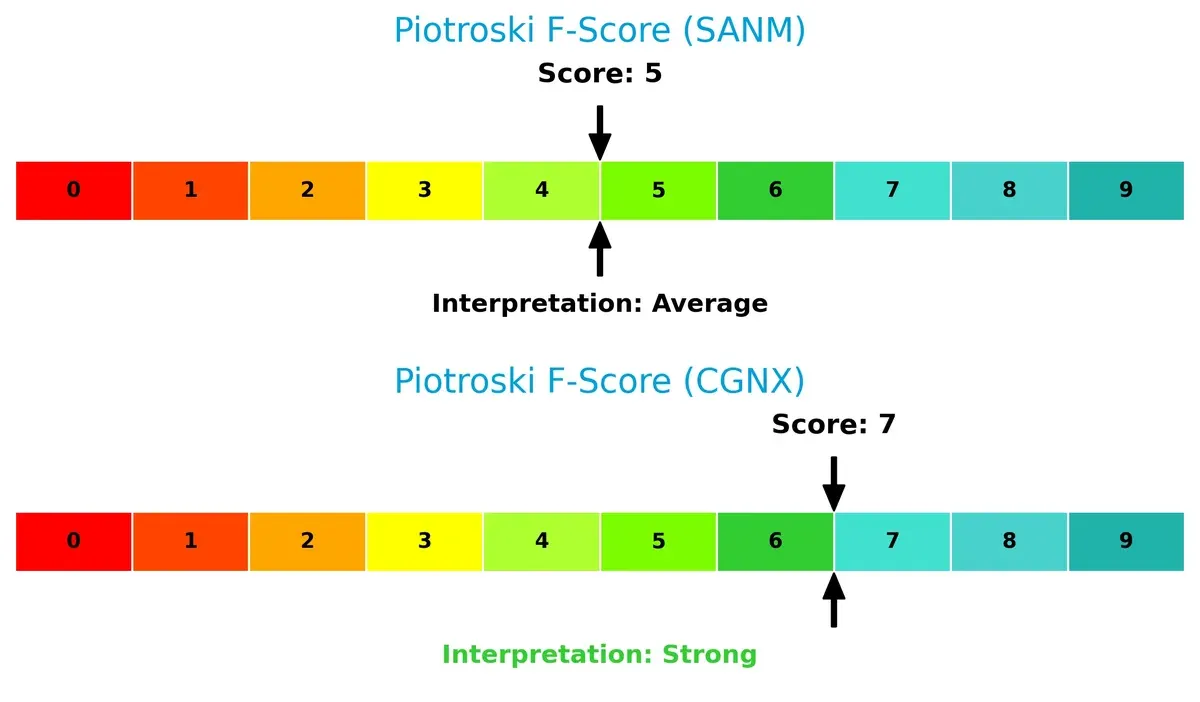
Financial Health: Quality of Operations
Cognex’s Piotroski F-Score of 7 signals strong internal financial metrics and operational health. Sanmina’s score of 5 is average, implying caution as some internal weaknesses persist:
How are the two companies positioned?
This section dissects the operational DNA of Sanmina and Cognex by comparing their revenue distribution by segment and internal dynamics. The goal is to confront their economic moats to identify which model offers the most resilient, sustainable competitive advantage today.
Revenue Segmentation: The Strategic Mix
This visual comparison dissects how Sanmina Corporation and Cognex Corporation diversify their income streams and where their primary sector bets lie:
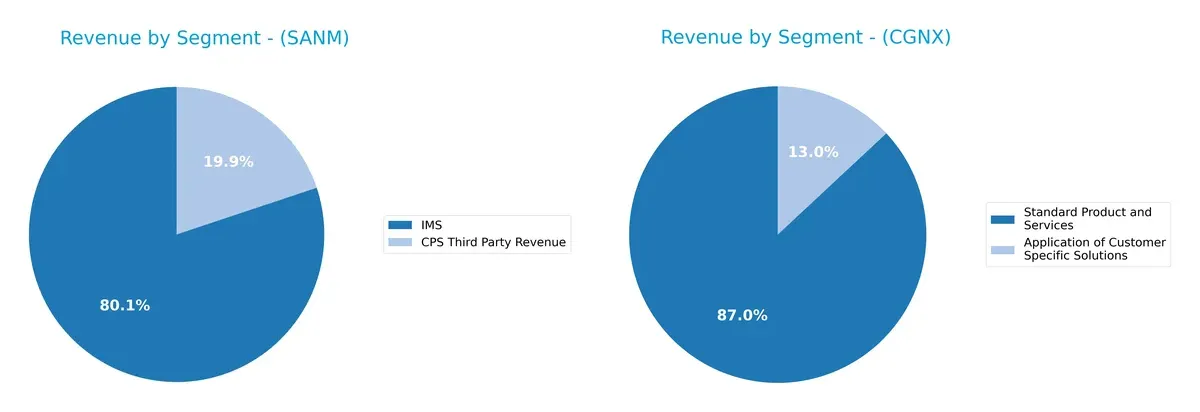
Sanmina anchors its revenue in IMS with $6.5B in 2025, complemented by $1.6B from CPS Third Party Revenue, showing moderate diversification. Cognex relies heavily on Standard Product and Services with $795M, while Application of Customer Specific Solutions contributes a smaller $119M. Sanmina’s broader segment mix reduces concentration risk, leveraging infrastructure dominance. Cognex’s dependence on one main segment may heighten vulnerability but reflects specialization in vision technology.
Strengths and Weaknesses Comparison
This table compares the strengths and weaknesses of Sanmina Corporation and Cognex Corporation based on key financial and market metrics:
Sanmina Corporation Strengths
- Favorable liquidity ratios support operational flexibility
- Low debt-to-assets ratio reduces financial risk
- Strong asset turnover indicates efficient use of assets
- Global presence across Americas, Asia Pacific, and EMEA regions
Cognex Corporation Strengths
- High net margin reflects solid profitability
- Very low debt-to-assets ratio supports conservative balance sheet
- Infinite interest coverage eliminates bankruptcy risk
- Favorable fixed asset turnover shows efficient capital use
Sanmina Corporation Weaknesses
- Low net margin limits profitability
- PE ratio higher than sector average signals valuation risk
- No dividend yield restricts income appeal
- Neutral ROE and ROIC suggest moderate capital efficiency
Cognex Corporation Weaknesses
- Unfavorable ROE and WACC imply capital return concerns
- Overvalued PE and PB ratios reduce margin of safety
- High current ratio may indicate inefficient asset use
- Low asset turnover points to underutilized assets
Sanmina’s strengths lie in solid liquidity and asset efficiency, while its profitability metrics remain subdued. Cognex excels in profitability and low leverage but faces valuation and efficiency challenges. These contrasting profiles suggest differing strategic priorities in capital allocation and market positioning.
The Moat Duel: Analyzing Competitive Defensibility
A structural moat is the only reliable barrier protecting long-term profits from relentless competitive erosion. Let’s dissect how these firms defend their turf:
Sanmina Corporation: Operational Scale & Supply Chain Integration
Sanmina’s moat stems from cost advantage via integrated manufacturing and supply chain scale. It maintains stable margins and a modest ROIC, but profitability slightly declines. Expansion into cloud-based manufacturing could deepen this moat in 2026.
Cognex Corporation: Technological Intangibles & High Margins
Cognex leverages intangible assets—patented machine vision software and hardware—yielding superior gross and net margins. Despite a steep ROIC decline, its technological edge supports premium pricing and global reach, with AI-driven vision systems poised for growth.
Verdict: Cost Leadership vs. Technological Intangibles
Sanmina’s broader operational scale offers a more stable, if modest, moat. Cognex’s superior margins highlight a deeper but currently eroding moat. Sanmina appears better positioned to defend market share amid pressure on profitability.
Which stock offers better returns?
The past year shows Sanmina Corporation’s stock surging significantly before recent deceleration, while Cognex Corporation’s shares declined overall but gained modestly in the latest months.
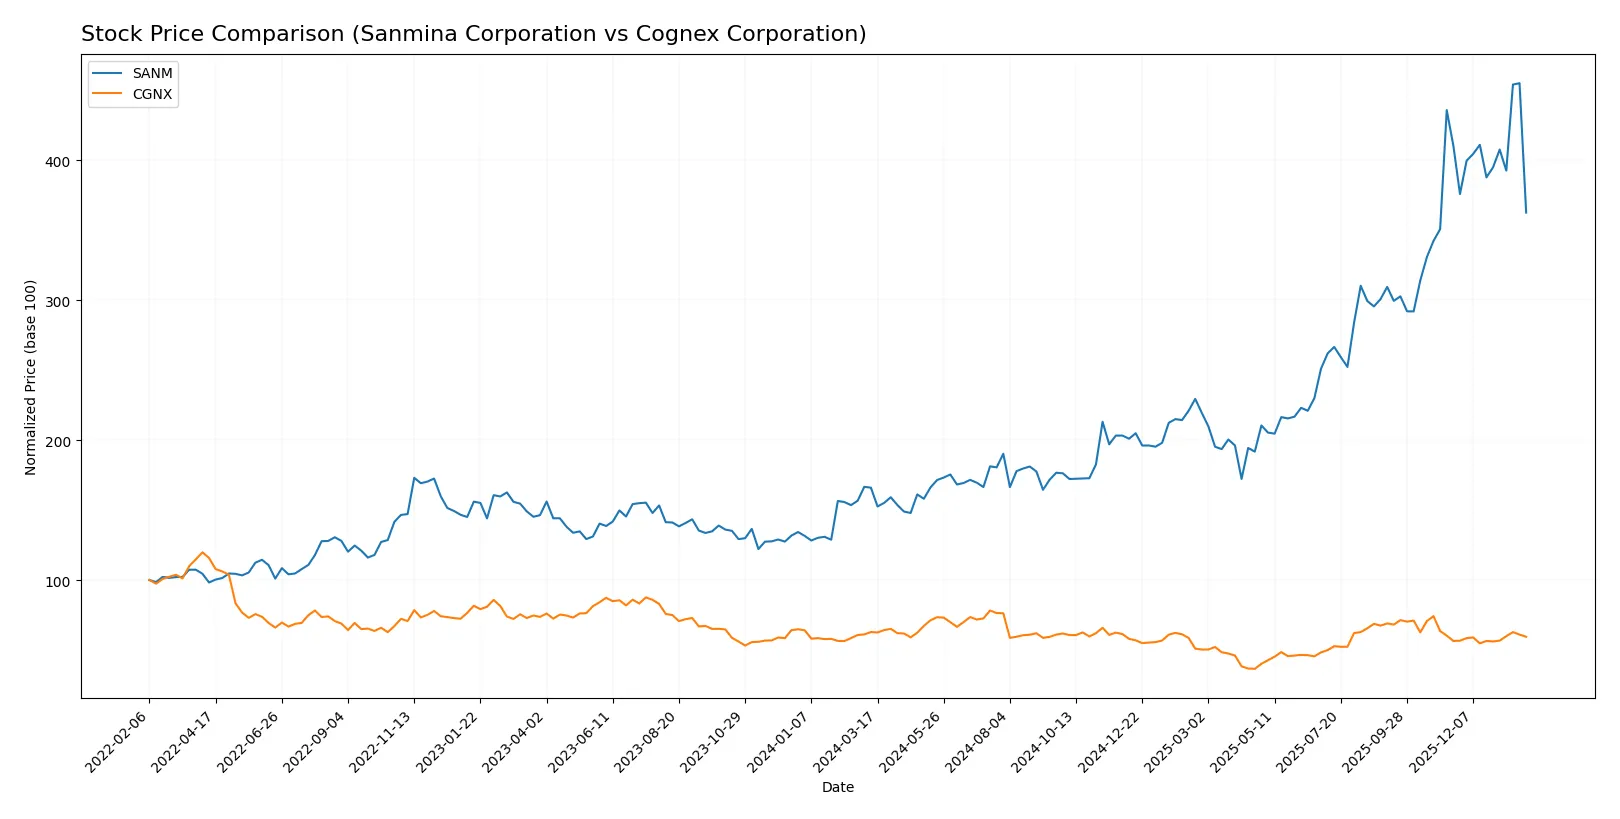
Trend Comparison
Sanmina’s stock soared 118.44% over the past year, a strong bullish trend despite recent deceleration and an 11.65% dip from November 2025 to February 2026. Volatility remains high at a 31.84 standard deviation.
Cognex’s stock fell 5.37% across the year, marking a bearish trend with accelerating decline. However, recent months saw a 5.36% price rebound, accompanied by low volatility at 5.92 standard deviation.
Sanmina outperformed Cognex over the 12-month period, delivering the highest market returns despite a recent slowdown. Cognex ended with a negative yearly return but showed short-term recovery.
Target Prices
Analysts present a clear consensus on target prices for Sanmina Corporation and Cognex Corporation.
| Company | Target Low | Target High | Consensus |
|---|---|---|---|
| Sanmina Corporation | 200 | 200 | 200 |
| Cognex Corporation | 38 | 58 | 48.14 |
Sanmina’s target of $200 implies a 41% upside from its $141.68 price, signaling strong analyst confidence. Cognex’s $48.14 consensus suggests a 24% rise from $38.74, reflecting moderate optimism.

Don’t Let Luck Decide Your Entry Point
Optimize your entry points with our advanced ProRealTime indicators. You’ll get efficient buy signals with precise price targets for maximum performance. Start outperforming now!
How do institutions grade them?
Here is a comparison of recent institutional grades for Sanmina Corporation and Cognex Corporation:
Sanmina Corporation Grades
The table below lists recent grades from recognized grading firms for Sanmina Corporation.
| Grading Company | Action | New Grade | Date |
|---|---|---|---|
| Argus Research | Maintain | Buy | 2026-01-28 |
| B of A Securities | Maintain | Neutral | 2025-07-11 |
| B of A Securities | Maintain | Neutral | 2025-06-09 |
| B of A Securities | Upgrade | Neutral | 2025-01-29 |
| Craig-Hallum | Maintain | Hold | 2024-11-05 |
Cognex Corporation Grades
The table below compiles recent grades from reputable firms for Cognex Corporation.
| Grading Company | Action | New Grade | Date |
|---|---|---|---|
| Barclays | Maintain | Overweight | 2026-01-12 |
| Truist Securities | Maintain | Hold | 2025-12-18 |
| Goldman Sachs | Upgrade | Buy | 2025-12-16 |
| JP Morgan | Downgrade | Underweight | 2025-12-03 |
| DA Davidson | Maintain | Neutral | 2025-11-03 |
Which company has the best grades?
Cognex Corporation generally receives higher grades like Overweight and Buy from prominent institutions. Sanmina’s grades mostly range from Neutral to Buy. Investors may view Cognex’s stronger grades as a signal of greater institutional confidence.
Risks specific to each company
The following categories identify the critical pressure points and systemic threats facing both firms in the 2026 market environment:
1. Market & Competition
Sanmina Corporation
- Faces intense competition in hardware manufacturing, pressured by low net margin and moderate ROIC.
Cognex Corporation
- Operates in niche machine vision with strong net margin but high P/E, indicating overvaluation risk.
2. Capital Structure & Debt
Sanmina Corporation
- Maintains low debt-to-equity (0.17) and high interest coverage, signaling solid balance sheet.
Cognex Corporation
- Even lower debt-to-equity (0.05) and infinite interest coverage, reflecting very conservative leverage.
3. Stock Volatility
Sanmina Corporation
- Beta near 1.05 suggests average market volatility, with a recent -8.3% price drop.
Cognex Corporation
- Higher beta at 1.52 indicates elevated price swings, though price decline is milder at -0.9%.
4. Regulatory & Legal
Sanmina Corporation
- Exposure to industrial and defense sectors could amplify regulatory scrutiny.
Cognex Corporation
- Machine vision products face evolving standards, especially in medical and automotive industries.
5. Supply Chain & Operations
Sanmina Corporation
- Integrated manufacturing depends heavily on global supply chains, vulnerable to disruptions.
Cognex Corporation
- Smaller scale and specialized production reduce broad supply chain risks but heighten component dependence.
6. ESG & Climate Transition
Sanmina Corporation
- Larger footprint and manufacturing intensity increase ESG transition pressures.
Cognex Corporation
- Focus on automation and software may ease transition but demands continuous innovation.
7. Geopolitical Exposure
Sanmina Corporation
- Global operations in sensitive sectors (defense, aerospace) increase geopolitical risk.
Cognex Corporation
- Mostly US-based with global distribution; geopolitical risks more contained but present.
Which company shows a better risk-adjusted profile?
Sanmina’s critical risk lies in its thin net margin amid competitive pressures, despite solid capital structure. Cognex faces valuation risk and higher volatility but boasts stronger profitability and financial safety. Cognex’s Altman Z-score in the safe zone and stronger Piotroski score suggest better financial resilience. However, its elevated beta and high P/E ratio raise caution. Sanmina’s lower beta and favorable leverage partially offset operational risks, yet its distress-zone Altman Z-score signals vulnerability. Overall, Cognex presents a superior risk-adjusted profile thanks to financial strength and profitability, despite market volatility and valuation concerns.
Final Verdict: Which stock to choose?
Sanmina Corporation’s superpower lies in its operational efficiency and solid balance sheet management. It maintains strong liquidity and low leverage, which supports resilience amid market fluctuations. A point of vigilance is its declining ROIC relative to WACC, signaling potential challenges in value creation. Sanmina fits well in an Aggressive Growth portfolio seeking operational leverage with moderate risk tolerance.
Cognex Corporation benefits from a strategic moat rooted in its specialized technology and recurring revenue streams. Its strong liquidity and low debt enhance its safety profile compared to Sanmina, though it trades at a premium valuation with a stretched price-to-earnings ratio. Cognex suits a GARP (Growth at a Reasonable Price) investor focused on market leadership and stability.
If you prioritize operational efficiency and a stable financial footing with growth potential, Sanmina is the compelling choice due to its disciplined capital structure and improving cash flows. However, if you seek technological moat and balance sheet safety with a tolerance for valuation risk, Cognex offers better stability despite its premium price. Both present distinct risk-return profiles aligned with different investor strategies.
Disclaimer: Investment carries a risk of loss of initial capital. The past performance is not a reliable indicator of future results. Be sure to understand risks before making an investment decision.
Go Further
I encourage you to read the complete analyses of Sanmina Corporation and Cognex Corporation to enhance your investment decisions: