Home > Comparison > Technology > SNDK vs CGNX
The strategic rivalry between Sandisk Corporation and Cognex Corporation shapes critical dynamics in the technology sector. Sandisk operates as a capital-intensive hardware manufacturer specializing in NAND flash storage devices. In contrast, Cognex focuses on high-margin machine vision systems that automate manufacturing processes. This analysis pits Sandisk’s scale-driven model against Cognex’s innovation-led approach to identify the superior risk-adjusted opportunity for a diversified portfolio in hardware and automation technology.
Table of contents
Companies Overview
Sandisk Corporation and Cognex Corporation stand as pivotal players in the technology hardware sector, shaping critical facets of digital innovation and automation.
Sandisk Corporation: Leader in Flash Storage Solutions
Sandisk dominates the NAND flash technology storage market, generating revenue primarily through solid state drives, embedded products, and removable memory cards. In 2026, the company sharpens its focus on expanding its product portfolio and scaling manufacturing capabilities to meet rising global demand for high-performance storage devices.
Cognex Corporation: Innovator in Machine Vision
Cognex specializes in machine vision systems that automate manufacturing and distribution through visual inspection and barcode reading. Its strategic emphasis lies in enhancing its VisionPro software suite and deep learning capabilities to boost automation efficiency across diverse industries including automotive and pharmaceuticals.
Strategic Collision: Similarities & Divergences
Both companies operate in technology hardware but diverge sharply: Sandisk prioritizes storage innovation while Cognex bets on visual automation. Their battleground intersects in industrial tech adoption, where smart manufacturing demands both reliable data storage and precise visual inspection. These differences define distinct investment profiles, balancing high-growth storage markets against steady automation-driven industrial applications.
Income Statement Comparison
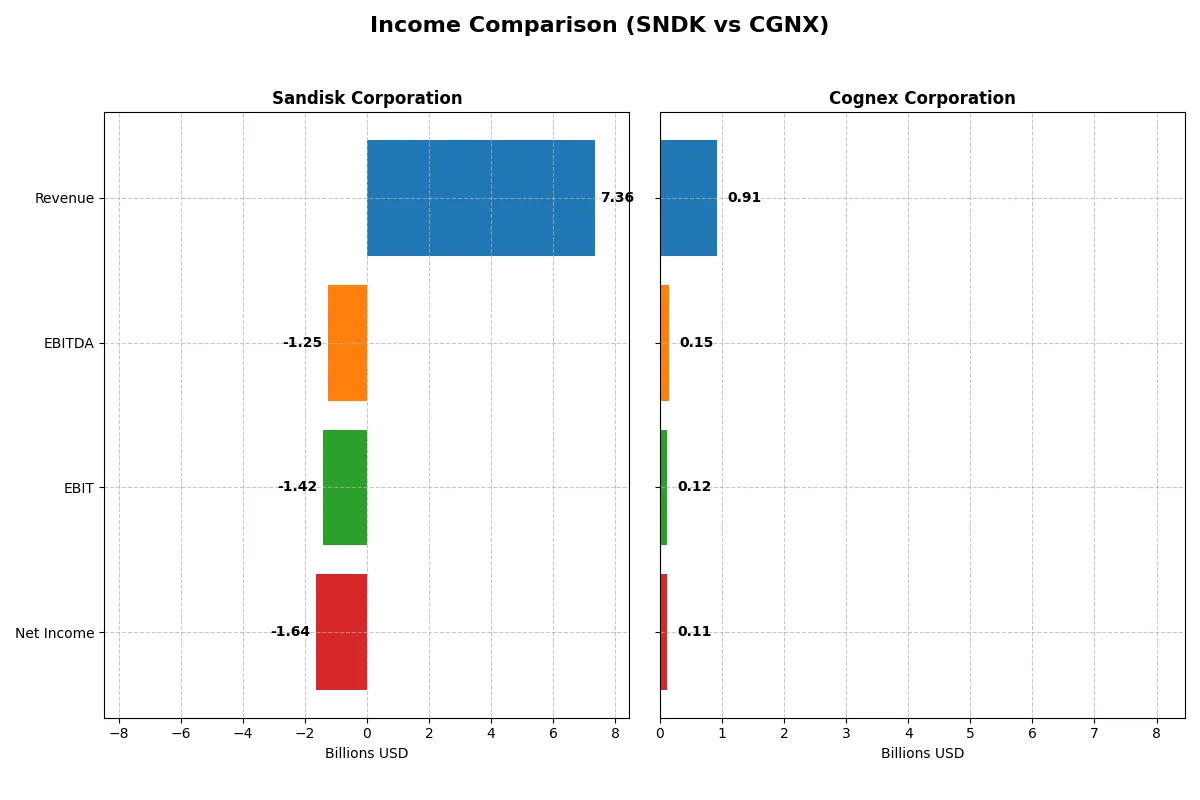
This data dissects the core profitability and scalability of both corporate engines to reveal who dominates the bottom line:
| Metric | Sandisk Corporation (SNDK) | Cognex Corporation (CGNX) |
|---|---|---|
| Revenue | 7.36B | 915M |
| Cost of Revenue | 5.14B | 289M |
| Operating Expenses | 3.59B | 511M |
| Gross Profit | 2.21B | 626M |
| EBITDA | -1.25B | 148M |
| EBIT | -1.42B | 115M |
| Interest Expense | 63M | 0 |
| Net Income | -1.64B | 106M |
| EPS | -11.32 | 0.62 |
| Fiscal Year | 2025 | 2024 |
Income Statement Analysis: The Bottom-Line Duel
This income statement comparison unveils which company runs its business engine more efficiently and sustainably in recent years.
Sandisk Corporation Analysis
Sandisk’s revenue declines 25% from 2022 to 2025, with a partial rebound of 10% in the last year. Net income turns deeply negative, dropping from 1.06B in 2022 to -1.64B in 2025. Gross margin stays moderate at 30%, but negative EBIT and net margins highlight deteriorating operational efficiency and mounting losses in 2025.
Cognex Corporation Analysis
Cognex’s revenue trends upward by 13% over five years, reaching $915M in 2024. Net income falls by 40% over the period but remains positive at $106M in 2024. Gross margin is robust at 68%, supporting an EBIT margin over 12%. Despite a slight recent dip in net margin, Cognex maintains profitable operations with controlled expenses.
Margin Strength vs. Revenue Scale
Cognex demonstrates superior profitability and margin stability compared to Sandisk’s shrinking top line and heavy losses. While Sandisk shows some revenue growth momentum recently, its negative EBIT and net margins indicate severe operational challenges. For investors prioritizing sustainable profit generation, Cognex’s profile appears more attractive.
Financial Ratios Comparison
These vital ratios act as a diagnostic tool to expose the underlying fiscal health, valuation premiums, and capital efficiency of the companies compared below:
| Ratios | Sandisk Corporation (SNDK) | Cognex Corporation (CGNX) |
|---|---|---|
| ROE | -17.8% (2025) | 7.0% (2024) |
| ROIC | -11.9% (2025) | 5.1% (2024) |
| P/E | -4.17 (2025) | 57.9 (2024) |
| P/B | 0.74 (2025) | 4.05 (2024) |
| Current Ratio | 3.56 (2025) | 3.62 (2024) |
| Quick Ratio | 2.11 (2025) | 2.69 (2024) |
| D/E | 0.22 (2025) | 0.05 (2024) |
| Debt-to-Assets | 15.7% (2025) | 3.5% (2024) |
| Interest Coverage | -21.9 (2025) | 0 (2024) |
| Asset Turnover | 0.57 (2025) | 0.46 (2024) |
| Fixed Asset Turnover | 11.9 (2025) | 5.52 (2024) |
| Payout ratio | 0% (2025) | 49.3% (2024) |
| Dividend yield | 0% (2025) | 0.85% (2024) |
| Fiscal Year | 2025 | 2024 |
Efficiency & Valuation Duel: The Vital Signs
Financial ratios serve as a company’s DNA, exposing hidden risks and operational strengths that shape investor confidence.
Sandisk Corporation
Sandisk shows deeply negative profitability with ROE at -17.8% and margins shrinking, signaling operational struggles. Its valuation metrics reflect a cheap stock with a P/E at -4.17 and a P/B of 0.74, suggesting market skepticism. The company pays no dividends, instead channeling funds aggressively into R&D, which accounts for 15.4% of revenue.
Cognex Corporation
Cognex maintains modest profitability, boasting an 11.6% net margin but a lower ROE of 7%, reflecting moderate capital efficiency. It trades at a steep premium with a P/E of 57.9 and P/B of 4.05, indicating stretched valuation. The modest 0.85% dividend yield contrasts with sustained reinvestment in R&D at 15.3% of revenue.
Premium Valuation vs. Operational Weakness
Both firms carry slightly unfavorable ratio profiles, but Sandisk’s deep losses and negative returns raise red flags despite attractive valuation. Cognex’s premium valuation prices in growth and operational stability. Risk-tolerant investors seeking growth may lean toward Cognex, while value-seekers face a tougher call with Sandisk’s operational challenges.
Which one offers the Superior Shareholder Reward?
I compare Sandisk Corporation (SNDK) and Cognex Corporation (CGNX) on shareholder rewards by examining dividends, payout ratios, and buyback programs. Sandisk pays no dividends, struggles with negative free cash flow, and has no buyback activity, undermining sustainable returns. Conversely, Cognex distributes a modest dividend yield near 0.7%, maintains a payout ratio around 43%, and consistently generates positive free cash flow near 0.78 per share. Cognex’s moderate buyback intensity coupled with robust operating margins and cash flow coverage supports a sustainable shareholder return. I find Cognex offers a superior total return profile in 2026 due to its balanced capital allocation and consistent shareholder distributions.
Comparative Score Analysis: The Strategic Profile
The radar chart reveals the fundamental DNA and trade-offs of Sandisk Corporation and Cognex Corporation, highlighting their distinct financial strengths and weaknesses:
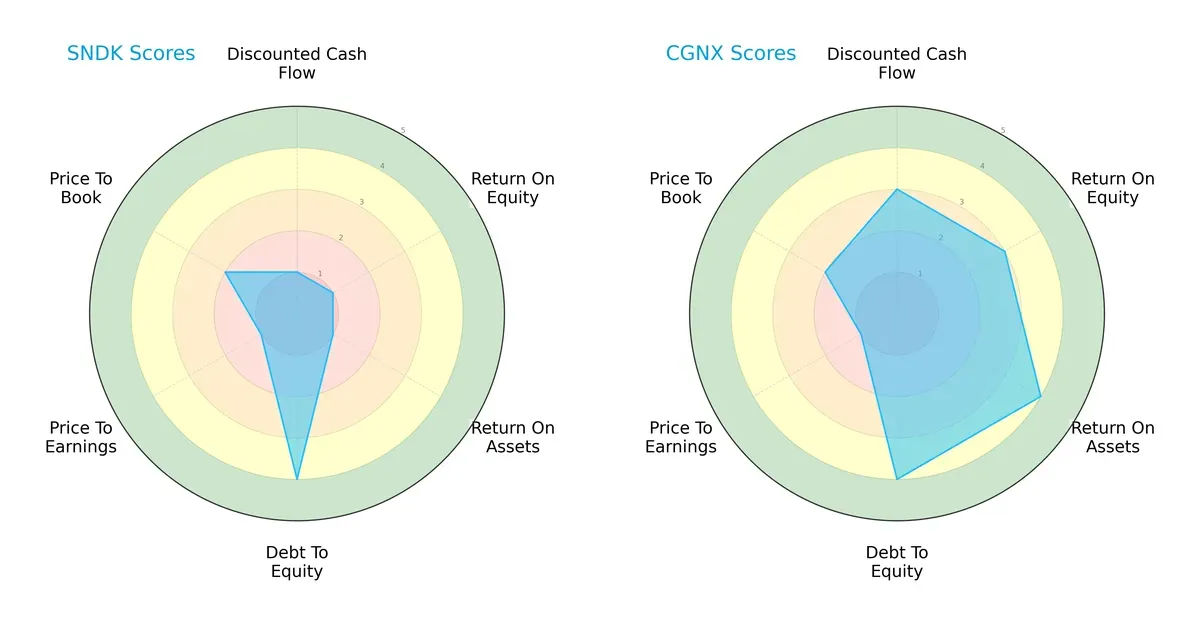
Cognex dominates in discounted cash flow (DCF), return on equity (ROE), and return on assets (ROA), showcasing efficient capital allocation and asset utilization. Both firms share a favorable debt-to-equity profile, but Sandisk lags in profitability and valuation metrics. Cognex presents a more balanced strategic profile, while Sandisk relies heavily on a strong balance sheet to offset operational weaknesses.
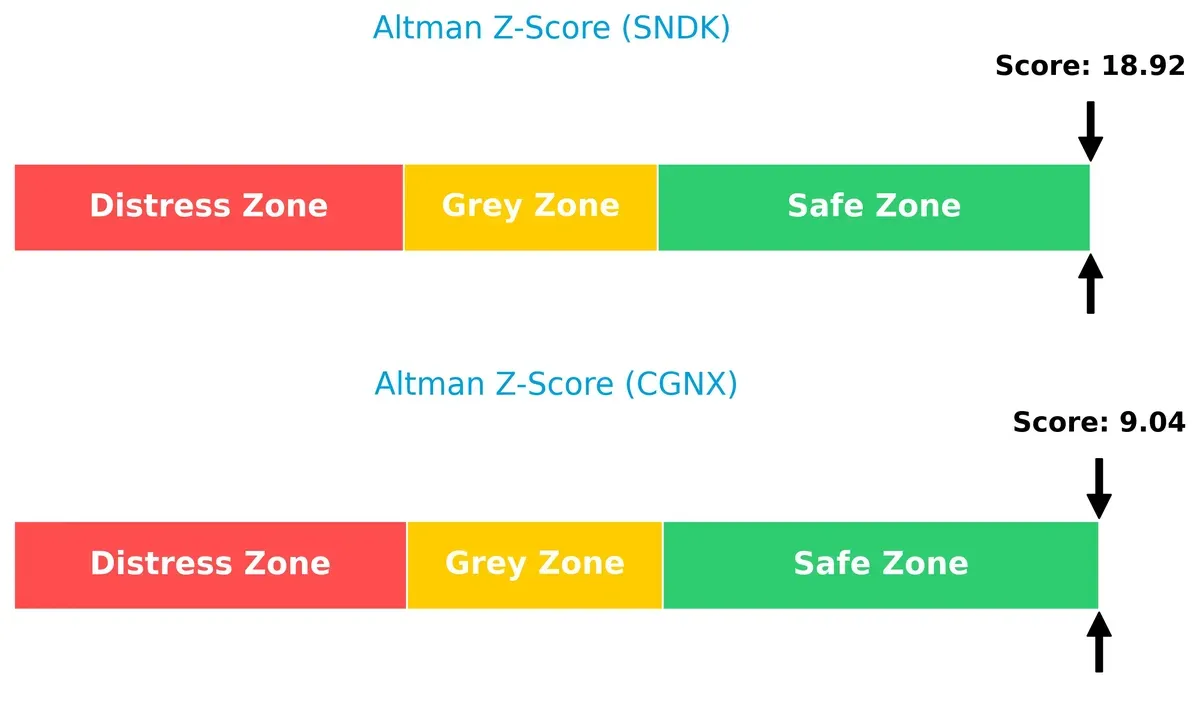
Bankruptcy Risk: Solvency Showdown
Cognex’s Altman Z-Score of 9.0 versus Sandisk’s 18.9 signals robust solvency for both, with Sandisk markedly safer for long-term survival in this cycle:
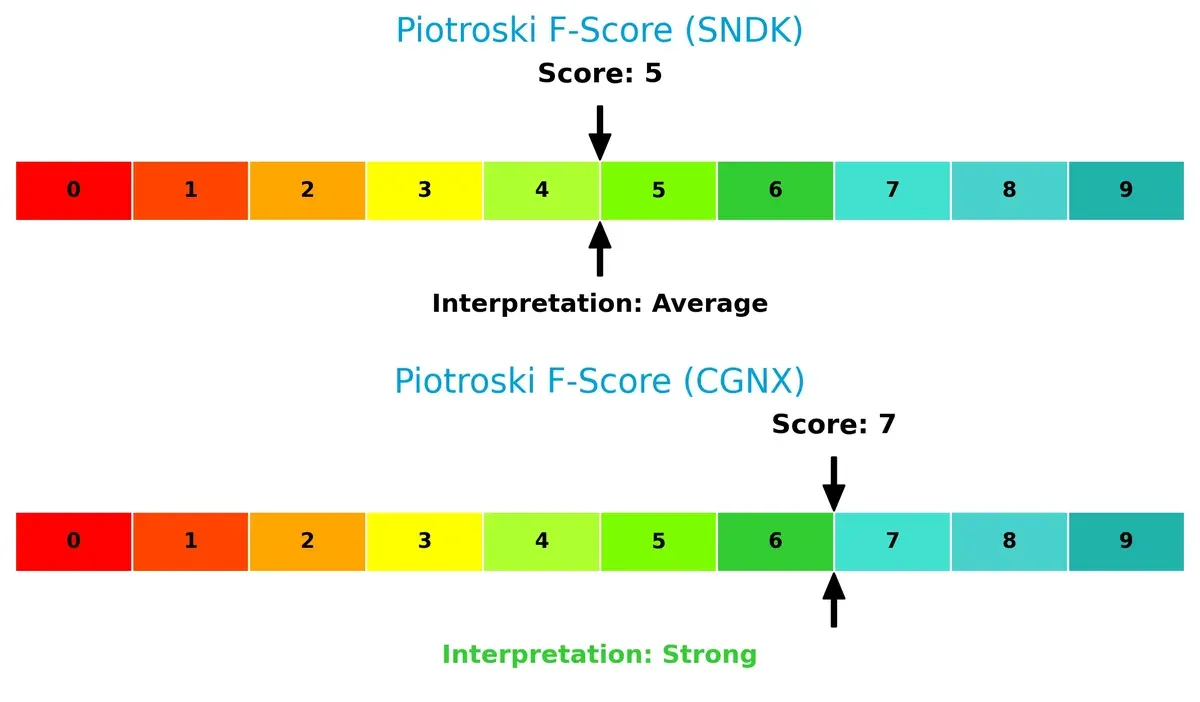
Financial Health: Quality of Operations
Cognex scores a strong 7 on the Piotroski F-Score, outperforming Sandisk’s average 5, indicating superior financial health and fewer internal red flags:
How are the two companies positioned?
This section dissects Sandisk and Cognex’s operational DNA by comparing revenue distribution and internal dynamics—strengths and weaknesses. The goal is to confront their economic moats to identify which business model offers the most resilient competitive advantage today.
Revenue Segmentation: The Strategic Mix
This visual comparison dissects how Sandisk Corporation and Cognex Corporation diversify their income streams and where their primary sector bets lie:
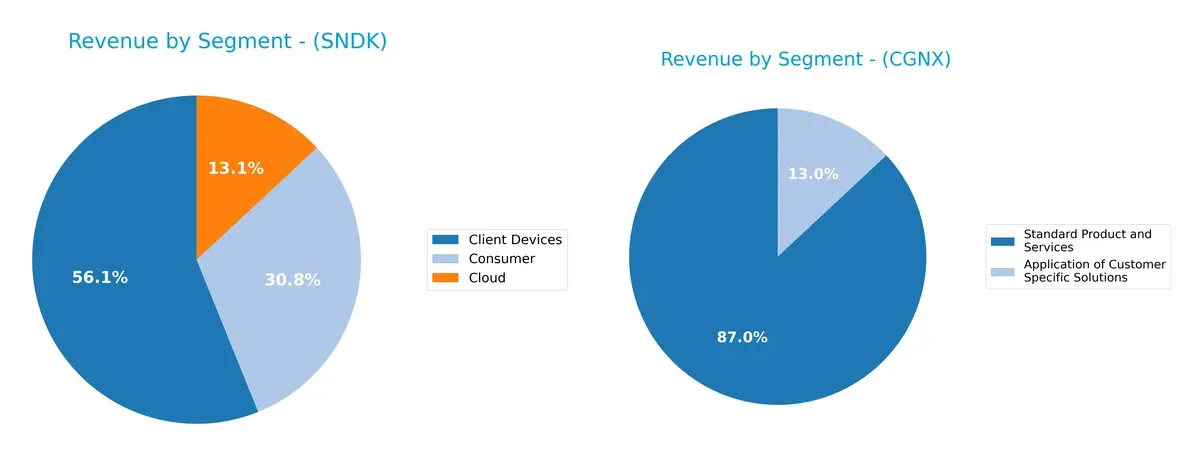
Sandisk anchors its $6.3B revenue with a dominant $4.13B from Client Devices, while Consumer adds $2.27B and Cloud $960M, showing moderate diversification. Cognex, with $914M total, pivots mainly on Standard Products ($795M) and smaller Customer Solutions ($119M). Sandisk’s mix signals strong ecosystem lock-in in hardware, but also concentration risk. Cognex’s narrower base emphasizes specialized industrial dominance but less scale and diversification than Sandisk.
Strengths and Weaknesses Comparison
The table below compares the strengths and weaknesses of Sandisk Corporation and Cognex Corporation:
Sandisk Strengths
- Diversified revenue across Client Devices, Cloud, and Consumer segments
- Significant sales in China and EMEA regions
- Favorable debt-to-equity and debt-to-assets ratios
- Strong fixed asset turnover indicating efficient asset use
- Solid quick ratio suggests good short-term liquidity
Cognex Strengths
- Stable revenue in Standard Products and Customer Solutions
- Global sales spread across Americas, Europe, Greater China, and Asia
- Low debt-to-equity and debt-to-assets ratios enhance financial stability
- Infinite interest coverage reflects strong ability to service debt
- Favorable quick ratio supports liquidity management
- Efficient fixed asset turnover
Sandisk Weaknesses
- Negative net margin, ROE, and ROIC point to profitability challenges
- High weighted average cost of capital raises capital expense concerns
- Negative interest coverage ratio signals financial distress risk
- Unfavorable current ratio may indicate liquidity issues
- No dividend yield limits income for shareholders
Cognex Weaknesses
- Moderate profitability with weak ROE and ROIC compared to peers
- Elevated P/E and P/B ratios suggest possible overvaluation
- Unfavorable current ratio could signal liquidity constraints
- Asset turnover below industry standards affects operational efficiency
- Low dividend yield offers limited shareholder returns
Both companies show balanced favorable and unfavorable financial metrics, with liquidity and profitability posing challenges. Sandisk’s diversified revenue and asset efficiency contrast with Cognex’s stronger debt management and interest coverage, implying differing strategic priorities for growth and financial stability.
The Moat Duel: Analyzing Competitive Defensibility
A structural moat is the only reliable defense preserving long-term profits from relentless competition erosion. Let’s dissect the nature and durability of these moats:
Sandisk Corporation: Cost Advantage in Flash Storage
Sandisk’s moat stems from its cost leadership in NAND flash technology, reflected in solid gross margins near 30%. However, declining ROIC signals worsening profitability, threatening this advantage in 2026 amid rising competition and margin pressure.
Cognex Corporation: Intangible Assets and Machine Vision Expertise
Cognex leverages patented vision software and deep learning to maintain a technological moat. Despite a strong 68% gross margin, its ROIC is also declining, indicating challenges in capital efficiency. Expansion in AI-driven automation could reinforce its moat if executed well.
Cost Leadership vs. Technological Intangibles: Who Holds the Edge?
Both firms face shrinking ROICs, signaling value destruction despite their moats. Cognex’s intangible asset moat is structurally deeper, supported by higher margins and innovative software. I conclude Cognex is better positioned to defend market share against competitive pressures in 2026.
Which stock offers better returns?
The past year reveals stark contrasts in price action and trading dynamics. Sandisk surges with accelerating gains and strong buyer dominance. Cognex declines overall but shows mild recent recovery.
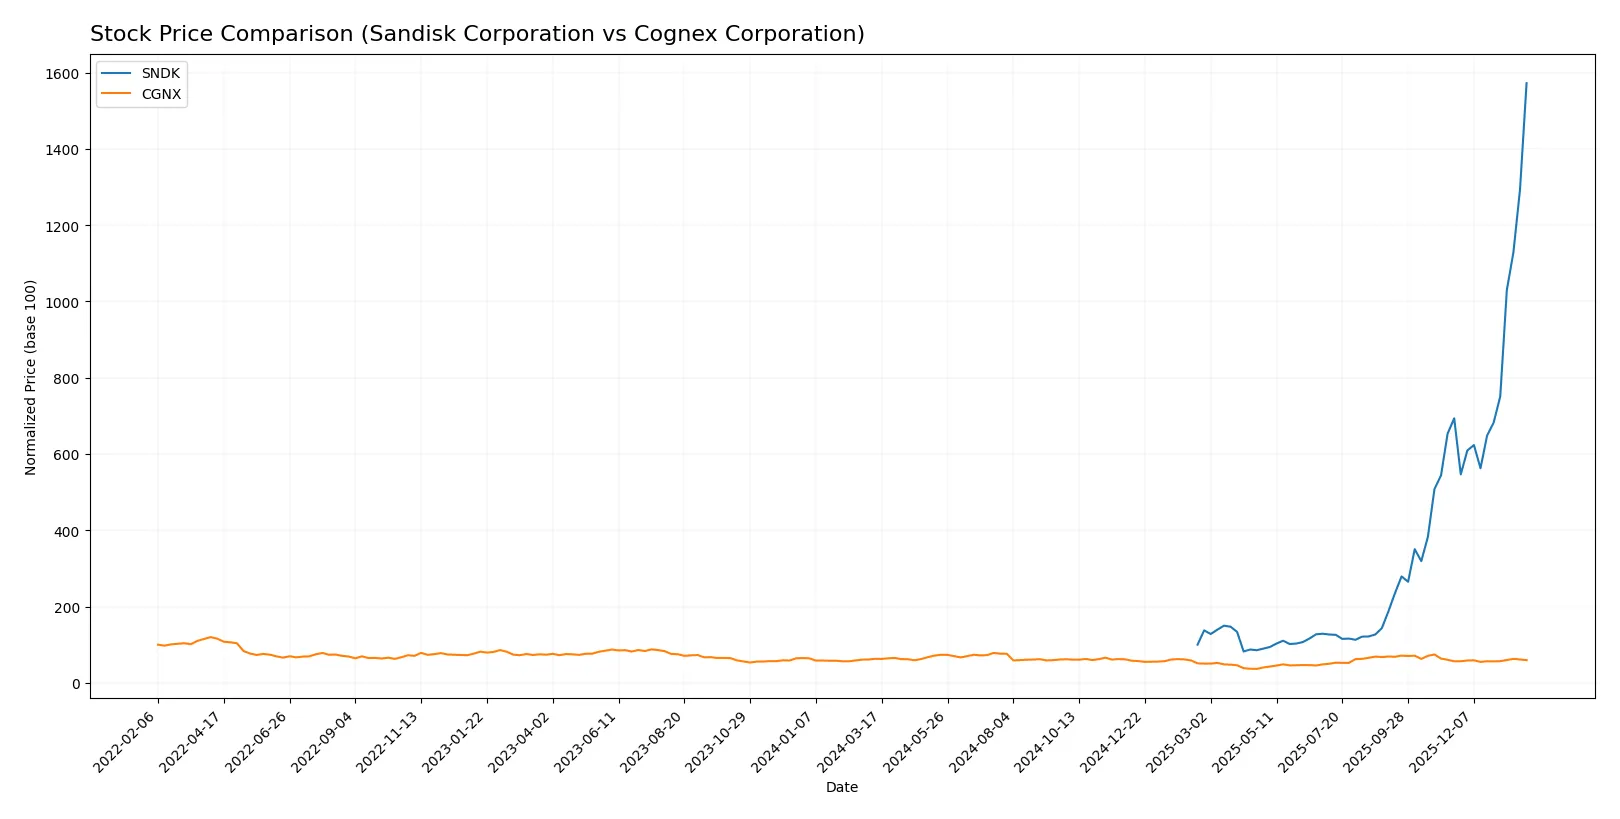
Trend Comparison
Sandisk’s stock gained 1472.31% over the past 12 months, marking a strong bullish trend with accelerating momentum and high volatility. The price ranged from 30.11 to 576.25.
Cognex’s stock fell 5.37% over the same period, indicating a bearish trend despite recent slight recovery of 5.36%. Volatility remains low with a narrow price range.
Sandisk outperformed Cognex significantly, delivering the highest market return with accelerating gains and dominant buyer volume compared to Cognex’s modest recent rebound.
Target Prices
Analyst consensus shows a range of expectations for Sandisk Corporation and Cognex Corporation.
| Company | Target Low | Target High | Consensus |
|---|---|---|---|
| Sandisk Corporation | 220 | 1000 | 615 |
| Cognex Corporation | 38 | 58 | 48 |
Sandisk’s target consensus at 615 slightly exceeds its current price of 576, indicating moderate upside. Cognex’s consensus target of 48 also suggests potential appreciation from its current 38.74 price.

Don’t Let Luck Decide Your Entry Point
Optimize your entry points with our advanced ProRealTime indicators. You’ll get efficient buy signals with precise price targets for maximum performance. Start outperforming now!
How do institutions grade them?
Sandisk Corporation Grades
The following table summarizes recent grades from reputable institutions for Sandisk Corporation:
| Grading Company | Action | New Grade | Date |
|---|---|---|---|
| Jefferies | Maintain | Buy | 2026-01-30 |
| RBC Capital | Maintain | Sector Perform | 2026-01-30 |
| Goldman Sachs | Maintain | Buy | 2026-01-30 |
| Morgan Stanley | Maintain | Overweight | 2026-01-30 |
| Cantor Fitzgerald | Maintain | Overweight | 2026-01-30 |
| Wedbush | Maintain | Outperform | 2026-01-30 |
| Citigroup | Maintain | Buy | 2026-01-20 |
| Wells Fargo | Maintain | Equal Weight | 2026-01-15 |
| Benchmark | Maintain | Buy | 2026-01-15 |
| Bernstein | Maintain | Outperform | 2026-01-14 |
Cognex Corporation Grades
Here are the latest institutional grades for Cognex Corporation from credible sources:
| Grading Company | Action | New Grade | Date |
|---|---|---|---|
| Barclays | Maintain | Overweight | 2026-01-12 |
| Truist Securities | Maintain | Hold | 2025-12-18 |
| Goldman Sachs | Upgrade | Buy | 2025-12-16 |
| JP Morgan | Downgrade | Underweight | 2025-12-03 |
| DA Davidson | Maintain | Neutral | 2025-11-03 |
| Barclays | Maintain | Overweight | 2025-10-31 |
| Baird | Maintain | Neutral | 2025-10-31 |
| Needham | Maintain | Buy | 2025-10-31 |
| Truist Securities | Maintain | Hold | 2025-10-08 |
| Goldman Sachs | Maintain | Sell | 2025-09-16 |
Which company has the best grades?
Sandisk Corporation holds consistently positive grades, mostly “Buy,” “Outperform,” and “Overweight,” signalling stronger institutional confidence. Cognex’s grades show more variability, including downgrades and a “Sell,” indicating mixed investor sentiment. This disparity may influence risk-averse investors towards Sandisk.
Risks specific to each company
The following categories identify the critical pressure points and systemic threats facing both firms in the 2026 market environment:
1. Market & Competition
Sandisk Corporation
- Faces intense competition in NAND flash technology with price pressures and rapid innovation cycles.
Cognex Corporation
- Competes in machine vision with growing demand but faces rivals innovating in AI-driven inspection technology.
2. Capital Structure & Debt
Sandisk Corporation
- Maintains low debt-to-equity (0.22), signaling conservative leverage and manageable financial risk.
Cognex Corporation
- Very low debt-to-equity (0.05) indicates a strong balance sheet with minimal credit risk exposure.
3. Stock Volatility
Sandisk Corporation
- Exhibits very high beta (4.89), indicating significant stock price volatility and market sensitivity.
Cognex Corporation
- Beta at 1.52 shows moderate volatility, closer to market benchmarks and less risky for risk-averse investors.
4. Regulatory & Legal
Sandisk Corporation
- Subject to technology export restrictions and IP litigation risks in highly competitive hardware markets.
Cognex Corporation
- Faces regulatory scrutiny in global manufacturing automation, but with fewer significant legal issues reported recently.
5. Supply Chain & Operations
Sandisk Corporation
- Vulnerable to semiconductor supply disruptions and rising raw material costs impacting margins.
Cognex Corporation
- Supply chain more diversified but reliant on key components for vision sensors, exposed to component shortages.
6. ESG & Climate Transition
Sandisk Corporation
- Pressured to reduce environmental footprint in manufacturing NAND flash memory, facing energy and waste challenges.
Cognex Corporation
- Investing in sustainable manufacturing and automation solutions, moderately exposed to climate transition risks.
7. Geopolitical Exposure
Sandisk Corporation
- High exposure to US-China trade tensions affecting supply chain and export markets.
Cognex Corporation
- Geopolitical risks present but less acute due to diversified end markets and less reliance on China.
Which company shows a better risk-adjusted profile?
Sandisk’s most impactful risk is its extreme stock volatility (beta 4.89), amplifying investment uncertainty amid market cycles. Cognex faces valuation risk with an elevated P/E ratio (57.9) indicating potential overpricing despite solid fundamentals. Both show slightly unfavorable financial ratios, but Cognex’s lower debt and stronger profitability underpin a better risk-adjusted profile. Notably, Sandisk’s negative net margin (-22.31%) signals operational stress, whereas Cognex maintains positive margins, justifying greater investor caution on Sandisk.
Final Verdict: Which stock to choose?
Sandisk Corporation’s superpower lies in its robust liquidity and undervalued asset base, making it a potential turnaround candidate. However, its persistent negative profitability and value destruction warn of operational challenges ahead. It suits aggressive growth portfolios willing to tolerate volatility for a possible rebound.
Cognex Corporation commands a strategic moat through consistent recurring revenue and strong income quality, despite a high valuation premium. It offers a more stable financial profile than Sandisk, favored by investors seeking steady growth without sacrificing quality. It fits well within GARP (Growth at a Reasonable Price) portfolios.
If you prioritize potential value recovery with significant risk tolerance, Sandisk could be compelling due to its asset strength and undervaluation. However, for investors seeking consistent profitability and financial stability, Cognex offers better stability and a defensible market position despite its premium valuation. Both present viable but distinct analytical scenarios.
Disclaimer: Investment carries a risk of loss of initial capital. The past performance is not a reliable indicator of future results. Be sure to understand risks before making an investment decision.
Go Further
I encourage you to read the complete analyses of Sandisk Corporation and Cognex Corporation to enhance your investment decisions: