In the fast-evolving technology hardware sector, Cognex Corporation and Ouster, Inc. stand out as innovators with distinct yet overlapping market focuses. Cognex specializes in machine vision systems that automate manufacturing tasks, while Ouster leads in high-resolution digital lidar sensors for 3D vision applications. Comparing these companies sheds light on their innovation strategies and growth potential, helping you decide which is the more compelling investment opportunity in 2026.

Table of contents
Companies Overview
I will begin the comparison between Cognex Corporation and Ouster, Inc. by providing an overview of these two companies and their main differences.
Cognex Corporation Overview
Cognex Corporation specializes in machine vision products that automate manufacturing and distribution tasks worldwide. Its technology is used in various industries such as consumer electronics, automotive, and pharmaceuticals to locate, identify, inspect, and measure discrete items during production. Founded in 1981 and based in Natick, Massachusetts, Cognex offers software and vision sensors designed to enhance automation processes.
Ouster, Inc. Overview
Ouster, Inc. develops high-resolution digital lidar sensors and software that provide 3D vision capabilities to machinery, vehicles, robots, and infrastructure. The company’s product lineup includes scanning and solid-state flash sensors. Established more recently and headquartered in San Francisco, California, Ouster serves clients who require advanced sensing technologies for automation and navigation.
Key similarities and differences
Both companies operate in the technology sector within the hardware, equipment, and parts industry, focusing on vision-related automation solutions. Cognex emphasizes machine vision for manufacturing inspection and tracking, while Ouster concentrates on lidar sensors enabling 3D spatial awareness. Cognex is larger with over 2,900 employees and a market cap above 6.6B, compared to Ouster’s smaller scale with fewer than 300 employees and a market cap near 1.6B.
Income Statement Comparison
The table below presents a side-by-side comparison of the most recent annual income statement figures for Cognex Corporation and Ouster, Inc., highlighting key financial metrics for 2024.

| Metric | Cognex Corporation | Ouster, Inc. |
|---|---|---|
| Market Cap | 6.66B | 1.64B |
| Revenue | 914.5M | 111.1M |
| EBITDA | 147.8M | -79.9M |
| EBIT | 115.1M | -94.7M |
| Net Income | 106.2M | -97.0M |
| EPS | 0.62 | -2.08 |
| Fiscal Year | 2024 | 2024 |
Income Statement Interpretations
Cognex Corporation
Cognex’s revenue showed a moderate increase from 2020 to 2024, with a 12.76% growth overall. However, net income declined significantly by nearly 40% over the same period. Gross and EBIT margins remained favorable, with gross margin at 68.43%, but the most recent year saw EBIT and net margin decrease by 6.22% and 14.13%, respectively, indicating some pressure on profitability despite revenue growth.
Ouster, Inc.
Ouster experienced rapid revenue growth, expanding by 487.71% from 2020 to 2024. Net income also improved positively by 9.12%, though it remained negative in absolute terms. Margins were mixed: gross margin was favorable at 36.42%, but EBIT and net margins were heavily negative in 2024. The latest year showed strong improvements in EBIT and net margin growth rates, signaling operational progress despite continued losses.
Which one has the stronger fundamentals?
Cognex displays stable and consistently favorable margins with positive net income, though recent profitability trends are weakening. Ouster shows remarkable growth in revenue and margin improvements but remains unprofitable overall. Cognex’s solid profitability contrasts with Ouster’s rapid expansion yet ongoing losses, presenting a trade-off between stability and growth momentum based on these income statement fundamentals.
Financial Ratios Comparison
The table below presents the latest financial ratios for Cognex Corporation and Ouster, Inc., reflecting key profitability, liquidity, leverage, efficiency, and dividend metrics for fiscal year 2024.
| Ratios | Cognex Corporation (CGNX) | Ouster, Inc. (OUST) |
|---|---|---|
| ROE | 7.0% | -53.6% |
| ROIC | 5.1% | -50.8% |
| P/E | 57.9 | -5.9 |
| P/B | 4.05 | 3.15 |
| Current Ratio | 3.62 | 2.80 |
| Quick Ratio | 2.69 | 2.59 |
| D/E | 0.05 | 0.11 |
| Debt-to-Assets | 3.5% | 7.3% |
| Interest Coverage | 0 | -57.1 |
| Asset Turnover | 0.46 | 0.40 |
| Fixed Asset Turnover | 5.52 | 4.54 |
| Payout ratio | 49.3% | 0 |
| Dividend yield | 0.85% | 0% |
Interpretation of the Ratios
Cognex Corporation
Cognex shows a mixed ratio profile with a strong net margin of 11.61% but an unfavorable return on equity (7.0%) and a high price-to-earnings ratio (57.9). Liquidity ratios are solid, though the current ratio is considered unfavorable. The company pays dividends with a low yield of 0.85%, indicating modest shareholder returns and a cautious payout approach supported by free cash flow.
Ouster, Inc.
Ouster’s ratios reveal significant challenges, including a negative net margin of -87.35% and poor returns on equity and capital employed, reflecting ongoing losses and operational inefficiencies. Its liquidity position is favorable with a current ratio of 2.8. Ouster does not pay dividends, likely due to its high growth phase and reinvestment strategy focused on R&D and expansion.
Which one has the best ratios?
Cognex’s ratios are relatively stronger, showing profitability and dividend payments, despite some unfavorable valuations. Ouster’s ratios indicate significant financial stress and negative profitability metrics, with no dividend payouts. Overall, Cognex presents a more balanced and stable financial profile compared to Ouster’s unfavorable ratio set.
Strategic Positioning
This section compares the strategic positioning of Cognex Corporation and Ouster, Inc. including their Market position, Key segments, and Exposure to technological disruption:
Cognex Corporation
- Established market leader with strong competitive pressure in machine vision hardware sector.
- Key segments include standard machine vision products and customer-specific solutions driving revenue.
- Moderate exposure to technological disruption given established product lines and incremental software enhancements.
Ouster, Inc.
- Smaller market cap, emerging player in high-resolution digital lidar sensors with higher beta.
- Focused on digital lidar sensors and enabling software for 3D vision in machinery, vehicles, and infrastructure.
- High exposure to technological disruption due to evolving lidar sensor technology and solid-state innovations.
Cognex Corporation vs Ouster, Inc. Positioning
Cognex shows a diversified business model with multiple product lines and steady revenue streams, while Ouster concentrates on innovative lidar technologies. Cognex benefits from market leadership but faces value destruction; Ouster’s focus entails higher risk but improving profitability trends.
Which has the best competitive advantage?
Both companies are currently shedding value relative to their cost of capital; however, Cognex’s long-term declining ROIC contrasts with Ouster’s improving ROIC trend, indicating a slightly more favorable competitive advantage for Ouster despite ongoing challenges.
Stock Comparison
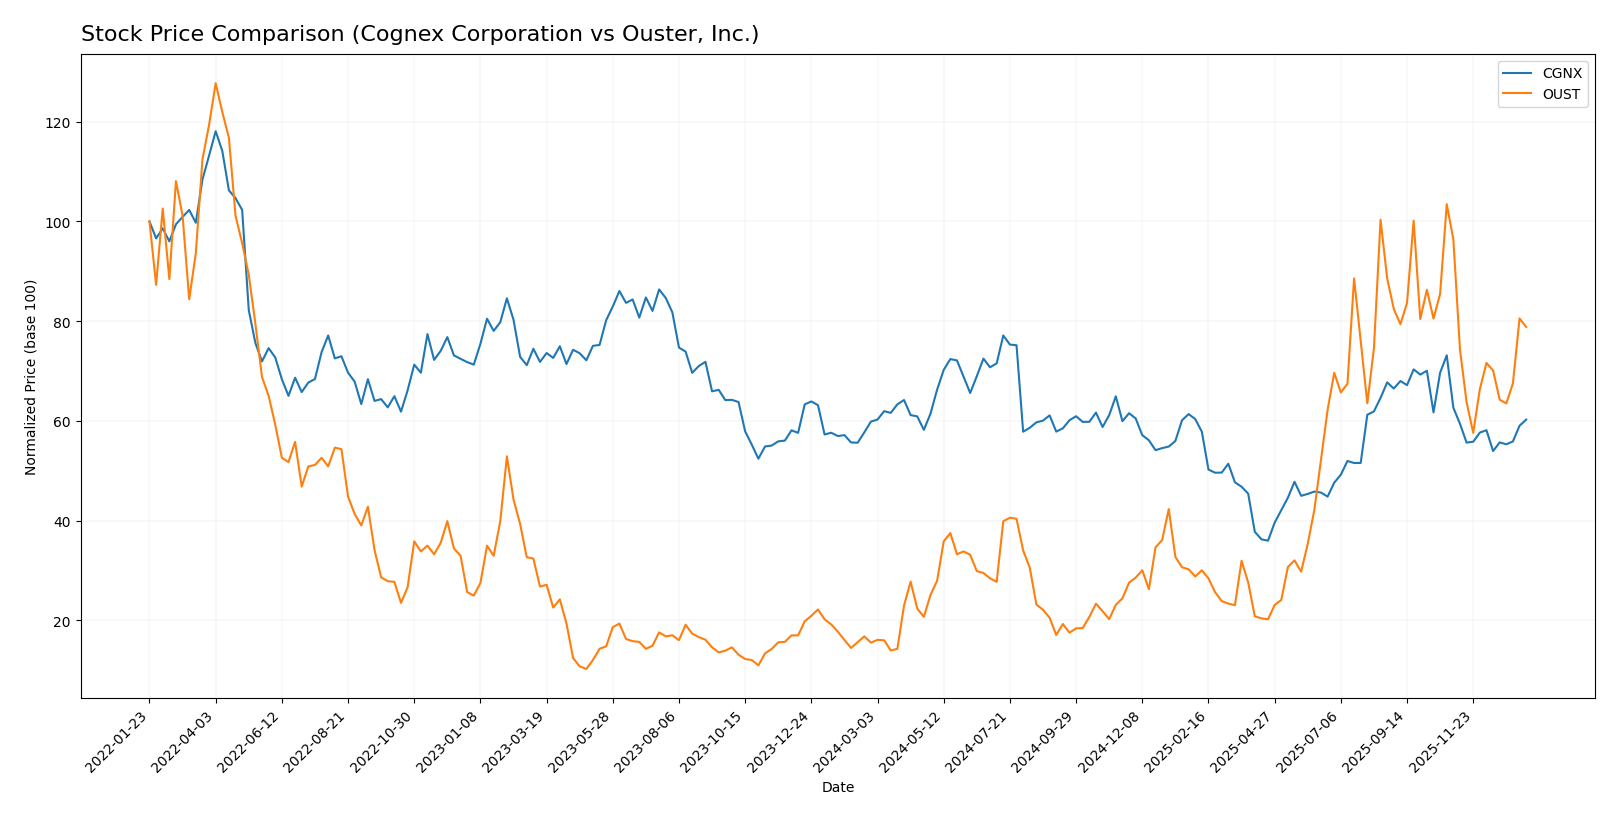
The stock price movements of Cognex Corporation and Ouster, Inc. over the past 12 months reveal contrasting dynamics, with both experiencing recent declines following notable overall gains.
Trend Analysis
Cognex Corporation (CGNX) showed a slight bullish trend with a 0.66% price increase over the past year, accompanied by deceleration and a high volatility level of 5.92. Recent weeks indicate a mild downward trend with a -3.79% change.
Ouster, Inc. (OUST) demonstrated a strong bullish trend with a 408.01% price increase over 12 months, despite deceleration and higher volatility at 8.61. Recent performance shows a sharper decline of -18.23%.
Comparing both, Ouster delivered the highest market performance over the year with a substantially larger price gain, although both companies faced downward pressure in the recent period.
Target Prices
The current analyst consensus presents moderate upside potential for the selected companies.
| Company | Target High | Target Low | Consensus |
|---|---|---|---|
| Cognex Corporation | 58 | 38 | 48.14 |
| Ouster, Inc. | 39 | 33 | 36.67 |
For Cognex Corporation, the consensus target price of 48.14 suggests a notable increase from the current price of 39.73 USD. Ouster, Inc. shows a target consensus of 36.67, well above its current trading price of 27.32 USD, indicating positive analyst expectations.
Analyst Opinions Comparison
This section compares analysts’ ratings and grades for Cognex Corporation and Ouster, Inc.:
Rating Comparison
Cognex Corporation Rating
- Rating: B, indicating very favorable overall sentiment.
- Discounted Cash Flow Score: 3, moderate assessment of valuation.
- ROE Score: 3, moderate efficiency in generating shareholder returns.
- ROA Score: 4, favorable asset utilization.
- Debt To Equity Score: 4, favorable financial risk profile.
- Overall Score: 3, moderate overall financial standing.
Ouster, Inc. Rating
- Rating: C-, reflecting a very unfavorable overall view.
- Discounted Cash Flow Score: 1, very unfavorable valuation.
- ROE Score: 1, very unfavorable efficiency.
- ROA Score: 1, very unfavorable asset utilization.
- Debt To Equity Score: 3, moderate financial risk profile.
- Overall Score: 1, very unfavorable overall financial standing.
Which one is the best rated?
Cognex Corporation is better rated than Ouster, Inc. in all provided categories, showing more favorable scores in valuation, profitability, asset use, and financial risk, resulting in a stronger overall rating.
Scores Comparison
Here is a comparison of the Altman Z-Score and Piotroski Score for Cognex Corporation and Ouster, Inc.:
CGNX Scores
- Altman Z-Score: 9.07, indicating a safe zone with very low bankruptcy risk.
- Piotroski Score: 7, reflecting strong financial health and value potential.
OUST Scores
- Altman Z-Score: 3.66, also in the safe zone, suggesting low bankruptcy risk.
- Piotroski Score: 4, indicating average financial strength and investment quality.
Which company has the best scores?
Cognex (CGNX) shows stronger financial health with a significantly higher Altman Z-Score and a better Piotroski Score compared to Ouster (OUST). CGNX scores suggest lower bankruptcy risk and stronger investment potential based on this data.
Grades Comparison
Below is a detailed comparison of the grades assigned to Cognex Corporation and Ouster, Inc. by various grading companies:
Cognex Corporation Grades
This table summarizes recent grades and actions from notable grading companies for Cognex Corporation:
| Grading Company | Action | New Grade | Date |
|---|---|---|---|
| Barclays | Maintain | Overweight | 2026-01-12 |
| Truist Securities | Maintain | Hold | 2025-12-18 |
| Goldman Sachs | Upgrade | Buy | 2025-12-16 |
| JP Morgan | Downgrade | Underweight | 2025-12-03 |
| DA Davidson | Maintain | Neutral | 2025-11-03 |
| Barclays | Maintain | Overweight | 2025-10-31 |
| Needham | Maintain | Buy | 2025-10-31 |
| Baird | Maintain | Neutral | 2025-10-31 |
| Truist Securities | Maintain | Hold | 2025-10-08 |
| Goldman Sachs | Maintain | Sell | 2025-09-16 |
Overall, Cognex Corporation’s grades show a mixed trend with some upgrades and downgrades, reflecting a balanced market outlook with a consensus rating of “Hold.”
Ouster, Inc. Grades
This table presents recent grades and actions from grading companies for Ouster, Inc.:
| Grading Company | Action | New Grade | Date |
|---|---|---|---|
| Cantor Fitzgerald | Upgrade | Overweight | 2025-11-07 |
| Cantor Fitzgerald | Upgrade | Overweight | 2025-11-06 |
| WestPark Capital | Maintain | Buy | 2025-11-05 |
| Rosenblatt | Maintain | Buy | 2025-11-05 |
| WestPark Capital | Upgrade | Buy | 2025-08-13 |
| Oppenheimer | Maintain | Outperform | 2025-07-16 |
| WestPark Capital | Downgrade | Hold | 2025-06-12 |
| WestPark Capital | Upgrade | Buy | 2025-05-09 |
| Rosenblatt | Maintain | Buy | 2025-03-21 |
| Cantor Fitzgerald | Maintain | Overweight | 2025-03-21 |
Ouster, Inc. exhibits a generally positive trend with multiple upgrades and sustained buy ratings, supporting a consensus rating of “Buy.”
Which company has the best grades?
Ouster, Inc. has received more consistent and positive grades compared to Cognex Corporation, indicating stronger analyst confidence. This could influence investors seeking growth-oriented opportunities.
Strengths and Weaknesses
Below is a comparative overview of the key strengths and weaknesses for Cognex Corporation (CGNX) and Ouster, Inc. (OUST) based on their latest financial and operational data.
| Criterion | Cognex Corporation (CGNX) | Ouster, Inc. (OUST) |
|---|---|---|
| Diversification | Moderate: Revenue from standard products (~$795M) and customer-specific solutions (~$119M) | Low: Revenue mainly from a single reportable segment (~$111M) |
| Profitability | Moderate profitability: Net margin 11.6%, ROIC 5.07%, but ROIC below WACC | Negative profitability: Net margin -87.3%, ROIC -50.8%, shedding value |
| Innovation | Strong: Maintains favorable fixed asset turnover (5.52) indicating efficient asset use | Growing ROIC trend suggests improving innovation capacity despite current losses |
| Global presence | Established global footprint with diversified product applications | Emerging global presence, less diversified |
| Market Share | Strong in machine vision with consistent revenue growth | Smaller share, still developing market position |
Key takeaways: Cognex shows solid profitability and operational efficiency but faces challenges with declining return on invested capital, signaling caution. Ouster is currently unprofitable but exhibits improving profitability trends and innovation potential, indicating a growth phase with higher risk.
Risk Analysis
Below is a comparative risk overview for Cognex Corporation (CGNX) and Ouster, Inc. (OUST) based on the most recent 2024 data:
| Metric | Cognex Corporation (CGNX) | Ouster, Inc. (OUST) |
|---|---|---|
| Market Risk | Beta 1.52, moderate volatility | Beta 2.94, high volatility |
| Debt level | Low (Debt/Equity 0.05), strong balance sheet | Low (Debt/Equity 0.11), moderate balance sheet |
| Regulatory Risk | Moderate, tech sector exposure | Moderate, lidar industry regulations evolving |
| Operational Risk | Low, established with diverse product lines | High, early-stage with reliance on innovation |
| Environmental Risk | Moderate, standard manufacturing impact | Moderate, sensor manufacturing footprint |
| Geopolitical Risk | Low, US-based with global sales | Low, US-based with global customers |
Cognex shows lower operational and market risks with a strong balance sheet, while Ouster faces higher market volatility and operational risks due to its nascent stage and negative profitability. Investors should weigh Ouster’s growth potential against its financial instability and higher beta.
Which Stock to Choose?
Cognex Corporation (CGNX) shows a generally favorable income evolution with 9.19% revenue growth in 2024 and solid gross and net margins, despite some recent declines in net margin and EPS. Financial ratios reveal a mixed profile with 42.86% favorable metrics but an overall slightly unfavorable rating, supported by low debt and strong liquidity. The company’s profitability is modest with a 7.0% ROE, and it carries very low debt, earning a very favorable B rating.
Ouster, Inc. (OUST) demonstrates strong income growth with 33.41% revenue increase and improvements in net margin and EPS, reflected in 85.71% favorable income statement indicators. However, its financial ratios remain largely unfavorable at 57.14% due to negative profitability metrics and higher risk levels. The company’s debt remains moderate, and it holds a very favorable C- rating, with its Altman Z-Score indicating financial safety but a weaker Piotroski score.
Investors with a tolerance for higher risk and interest in growth might find Ouster’s improving income trends and expanding revenues more appealing, while those seeking stability and stronger financial health could interpret Cognex’s mixed but more stable financial profile and higher rating as preferable. The choice may depend on whether the investor prioritizes growth potential or financial steadiness.
Disclaimer: Investment carries a risk of loss of initial capital. The past performance is not a reliable indicator of future results. Be sure to understand risks before making an investment decision.
Go Further
I encourage you to read the complete analyses of Cognex Corporation and Ouster, Inc. to enhance your investment decisions: