In the fast-evolving technology sector, Cognex Corporation (CGNX) and Novanta Inc. (NOVT) stand out as leaders in hardware and precision equipment. Both companies innovate within machine vision and photonics, serving overlapping industrial and medical markets with cutting-edge solutions. This comparison explores their market positioning, innovation strategies, and growth potential to help you, the investor, decide which company offers the most compelling opportunity for your portfolio.
Table of contents
Companies Overview
I will begin the comparison between Cognex Corporation and Novanta Inc. by providing an overview of these two companies and their main differences.
Cognex Corporation Overview
Cognex Corporation specializes in machine vision products designed to automate manufacturing and distribution processes globally. Its technology captures and analyzes visual information to assist in inspection, identification, and measurement tasks across industries such as consumer electronics, automotive, and pharmaceuticals. Headquartered in Natick, Massachusetts, Cognex has a strong market presence with a $6.7B market cap and employs approximately 2,914 people.
Novanta Inc. Overview
Novanta Inc. provides photonics, vision, and precision motion components and sub-systems primarily to medical and industrial markets worldwide. Its diversified product portfolio includes laser technologies, medical devices, and motion control solutions sold under multiple brands. Based in Bedford, Massachusetts, Novanta operates with about 3,000 employees and holds a market capitalization of $4.7B, reflecting its significant role in technology hardware.
Key similarities and differences
Both companies operate in the technology sector within the hardware, equipment, and parts industry and serve industrial applications worldwide. Cognex focuses on machine vision for manufacturing automation, whereas Novanta offers a broader set of photonics and motion technologies with a strong emphasis on medical applications. Despite similar employee sizes and U.S. bases, Cognex’s market cap is notably higher, highlighting differences in market valuation and product specialization.
Income Statement Comparison
The table below provides a side-by-side comparison of key income statement metrics for Cognex Corporation and Novanta Inc. for the fiscal year 2024.
| Metric | Cognex Corporation (CGNX) | Novanta Inc. (NOVT) |
|---|---|---|
| Market Cap | 6.67B | 4.73B |
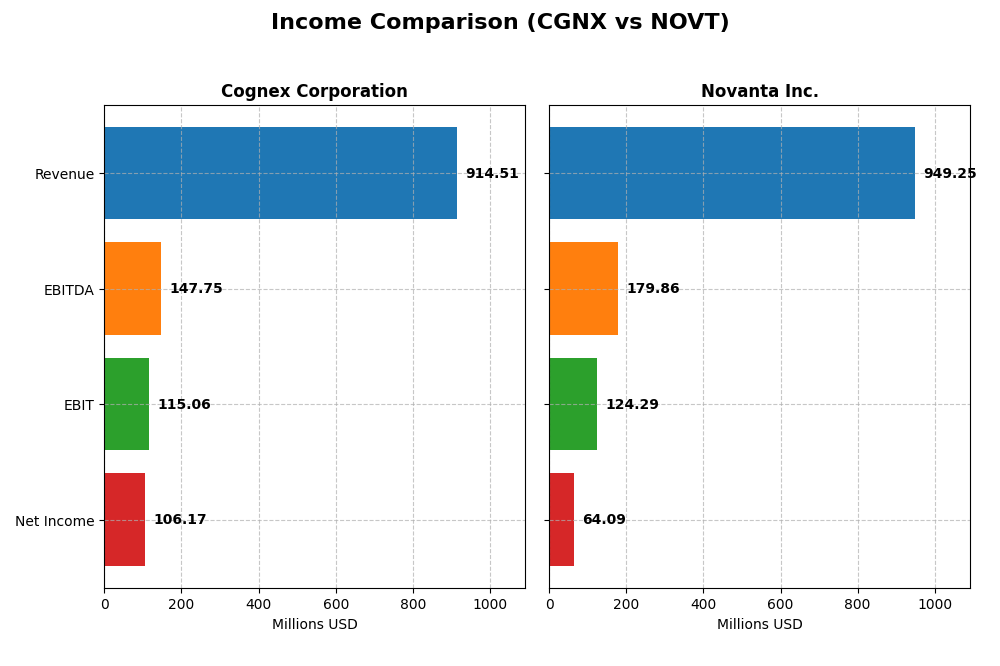
| Revenue | 914.5M | 949.2M |
| EBITDA | 147.8M | 179.9M |
| EBIT | 115.1M | 124.3M |
| Net Income | 106.2M | 64.1M |
| EPS | 0.62 | 1.78 |
| Fiscal Year | 2024 | 2024 |
Income Statement Interpretations
Cognex Corporation
Cognex’s revenue showed moderate growth of 9.19% in 2024 but declined overall by 12.76% since 2020. Net income fell sharply by nearly 40% over the period, reflecting a 46.56% reduction in net margin. While gross margin remained favorable at 68.43%, the net margin dropped to 11.61%. The latest year saw slower earnings with net income decreasing despite revenue gains.
Novanta Inc.
Novanta’s revenue increased steadily by 7.67% in 2024 and surged 60.72% over five years. Net income rose 43.95% overall but dipped 18.32% in net margin last year to 6.75%. Gross margin remained stable at 44.41%, and EBIT margin held at 13.09%. The most recent year reflected moderate revenue growth but pressure on net margins and earnings per share.
Which one has the stronger fundamentals?
Novanta exhibits stronger fundamentals with higher overall revenue and net income growth, supported by a favorable gross margin and positive EPS trend over five years. Cognex maintains higher margins but suffers from declining net income and margins. Both companies face recent margin pressures, yet Novanta’s sustained growth and margin stability suggest relatively more robust income fundamentals.
Financial Ratios Comparison
This table presents a side-by-side comparison of key financial ratios for Cognex Corporation and Novanta Inc. as of the fiscal year ended 2024.
| Ratios | Cognex Corporation (CGNX) | Novanta Inc. (NOVT) |
|---|---|---|
| ROE | 7.0% | 8.6% |
| ROIC | 5.1% | 7.3% |
| P/E | 57.9 | 85.7 |
| P/B | 4.1 | 7.4 |
| Current Ratio | 3.62 | 2.58 |
| Quick Ratio | 2.69 | 1.72 |
| D/E (Debt to Equity) | 0.046 | 0.63 |
| Debt-to-Assets | 3.5% | 33.9% |
| Interest Coverage | 0 (not reported) | 3.51 |
| Asset Turnover | 0.46 | 0.68 |
| Fixed Asset Turnover | 5.52 | 6.08 |
| Payout Ratio | 49.3% | 0% |
| Dividend Yield | 0.85% | 0% |
Interpretation of the Ratios
Cognex Corporation
Cognex shows mixed ratios with strengths in net margin (11.61%) and strong quick ratio (2.69), debt-to-equity (0.05), and interest coverage (infinite). However, its return on equity (7.0%), high PE (57.9), and price-to-book (4.05) ratios are unfavorable, indicating valuation concerns. The company pays dividends, but its 0.85% yield is low, suggesting modest shareholder returns.
Novanta Inc.
Novanta presents a balanced profile with neutral net margin (6.75%) and ROIC (7.25%), favorable liquidity ratios, but an elevated PE (85.7) and no dividend payout. Debt levels and interest coverage are neutral, reflecting moderate financial risk. The absence of dividends indicates a possible reinvestment strategy or growth phase, with no current shareholder distributions.
Which one has the best ratios?
Both companies have a slightly unfavorable overall ratio profile. Cognex offers stronger profitability metrics but struggles with valuation and dividend yield. Novanta has more neutral financial leverage and liquidity but lacks dividend payments and shows weaker profitability. Neither company distinctly outperforms the other across all key ratios.
Strategic Positioning
This section compares the strategic positioning of Cognex Corporation and Novanta Inc., focusing on market position, key segments, and exposure to technological disruption:
Cognex Corporation
- Leading machine vision provider with competitive pressure in hardware and equipment parts sector.
- Revenue driven by standard products and customer-specific solutions, serving diverse industries including automotive and pharmaceuticals.
- Utilizes patented vision software and deep learning to maintain technological edge in automation.
Novanta Inc.
- Designs and markets photonics, vision, and precision motion components serving medical and industrial markets.
- Revenue diversified across photonics, robotics, advanced surgery, and precision medicine segments.
- Offers advanced laser, vision, and motion technologies with applications in medical and industrial fields.
Cognex Corporation vs Novanta Inc. Positioning
Cognex focuses on machine vision with a strong product and service standardization, targeting multiple industries. Novanta adopts a broader technology approach across photonics and precision motion, diversifying into medical and industrial markets, balancing specialization with variety.
Which has the best competitive advantage?
Both companies currently shed value as ROIC is below WACC; however, Novanta shows improving profitability trends, while Cognex experiences declining returns, indicating a slightly better competitive advantage for Novanta.
Stock Comparison
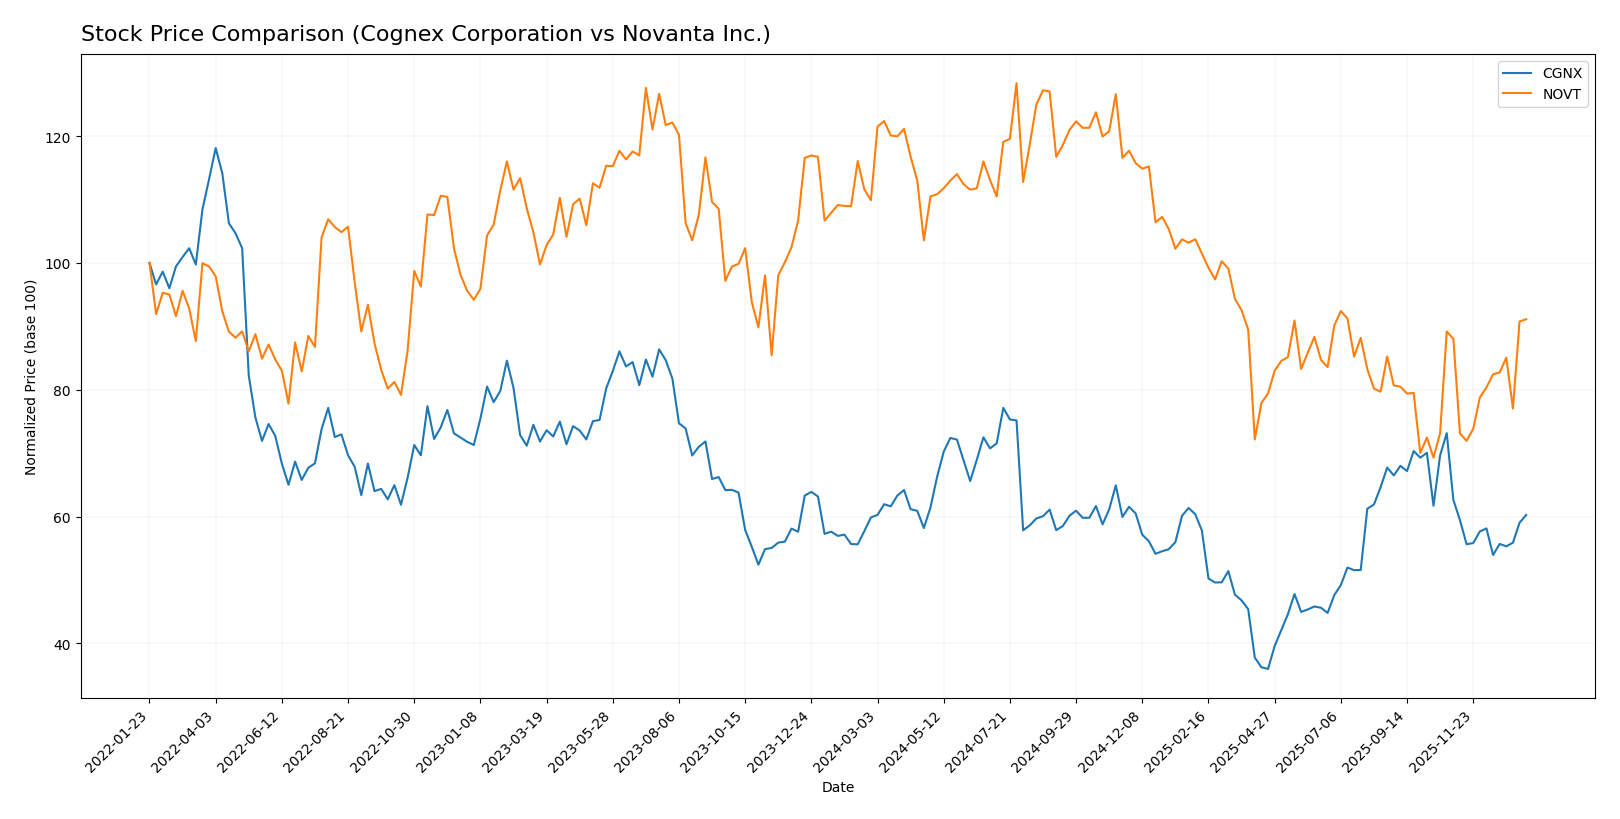
The stock price movements of Cognex Corporation (CGNX) and Novanta Inc. (NOVT) over the past 12 months show contrasting trends, with CGNX exhibiting mild gains and decelerating momentum, while NOVT faces a notable decline but recent signs of recovery in trading dynamics.
Trend Analysis
Cognex Corporation (CGNX) showed a slight bullish trend over the past year with a 0.66% price increase and decelerating momentum; its price ranged between 23.77 and 50.98, with moderate volatility (std deviation 5.92). Recent months reveal a minor bearish correction of -3.79%.
Novanta Inc. (NOVT) experienced a bearish trend over the last 12 months, with a 17.08% price decline and accelerating downward momentum; price fluctuated between 99.96 and 185.16, reflecting high volatility (std deviation 25.04). Recently, NOVT gained 3.5%, indicating a potential short-term recovery.
Comparing both, CGNX delivered the highest market performance over the past year, maintaining slight gains despite recent weakness, whereas NOVT faced a significant overall loss despite recent positive price movement.
Target Prices
Analysts present a clear target price consensus for both Cognex Corporation and Novanta Inc.
| Company | Target High | Target Low | Consensus |
|---|---|---|---|
| Cognex Corporation | 58 | 38 | 48.14 |
| Novanta Inc. | 160 | 160 | 160 |
For Cognex, the consensus target price of 48.14 indicates potential upside from the current price near 39.83 USD. Novanta’s consensus target of 160 significantly exceeds its current price around 131.41 USD, suggesting strong analyst optimism.
Analyst Opinions Comparison
This section compares analysts’ ratings and grades for Cognex Corporation and Novanta Inc.:
Rating Comparison
Cognex Corporation Rating
- Rating: B, considered very favorable by analysts.
- Discounted Cash Flow Score: 3, indicating moderate valuation.
- ROE Score: 3, showing moderate efficiency in profit generation.
- ROA Score: 4, reflecting favorable asset utilization.
- Debt To Equity Score: 4, favorable, implying low financial risk.
- Overall Score: 3, moderate overall financial standing.
Novanta Inc. Rating
- Rating: C+, also regarded as very favorable.
- Discounted Cash Flow Score: 3, a moderate valuation as well.
- ROE Score: 3, matching moderate efficiency.
- ROA Score: 3, indicating moderate asset use.
- Debt To Equity Score: 1, very unfavorable, indicating higher financial risk.
- Overall Score: 2, a moderate but lower overall standing.
Which one is the best rated?
Based strictly on the provided data, Cognex Corporation holds a superior rating with a “B” grade and higher scores in ROA, debt-to-equity, and overall rating compared to Novanta’s “C+” and generally lower scores.
Scores Comparison
Here is a comparison of the Altman Z-Score and Piotroski Score for Cognex Corporation and Novanta Inc.:
CGNX Scores
- Altman Z-Score: 9.07, indicating a safe zone with very low bankruptcy risk.
- Piotroski Score: 7, reflecting strong financial health and value potential.
NOVT Scores
- Altman Z-Score: 5.39, indicating a safe zone with low bankruptcy risk.
- Piotroski Score: 6, reflecting average financial health and value potential.
Which company has the best scores?
Based on the provided data, CGNX has a higher Altman Z-Score and a stronger Piotroski Score compared to NOVT. This suggests CGNX currently demonstrates better financial stability and strength according to these metrics.
Grades Comparison
The following section compares the recent grades assigned to Cognex Corporation and Novanta Inc. by reputable grading companies:
Cognex Corporation Grades
This table summarizes the latest grades from recognized financial institutions for Cognex Corporation.
| Grading Company | Action | New Grade | Date |
|---|---|---|---|
| Barclays | Maintain | Overweight | 2026-01-12 |
| Truist Securities | Maintain | Hold | 2025-12-18 |
| Goldman Sachs | Upgrade | Buy | 2025-12-16 |
| JP Morgan | Downgrade | Underweight | 2025-12-03 |
| DA Davidson | Maintain | Neutral | 2025-11-03 |
| Barclays | Maintain | Overweight | 2025-10-31 |
| Needham | Maintain | Buy | 2025-10-31 |
| Baird | Maintain | Neutral | 2025-10-31 |
| Truist Securities | Maintain | Hold | 2025-10-08 |
| Goldman Sachs | Maintain | Sell | 2025-09-16 |
Cognex Corporation’s grades show a mix of Buy and Hold ratings with some recent downgrades, indicating a moderately cautious outlook among analysts.
Novanta Inc. Grades
Below is a summary of consistent grades provided by financial firms for Novanta Inc.
| Grading Company | Action | New Grade | Date |
|---|---|---|---|
| Baird | Maintain | Neutral | 2025-08-11 |
| Baird | Maintain | Neutral | 2025-03-03 |
| Baird | Maintain | Neutral | 2024-11-06 |
| Baird | Maintain | Neutral | 2024-08-07 |
| Baird | Maintain | Neutral | 2023-05-11 |
| Baird | Maintain | Neutral | 2023-05-10 |
| William Blair | Upgrade | Outperform | 2022-05-11 |
| William Blair | Upgrade | Outperform | 2022-05-10 |
| Berenberg | Maintain | Hold | 2020-11-13 |
| Baird | Maintain | Neutral | 2020-05-13 |
Novanta Inc.’s grades are predominantly Neutral with some upgrades to Outperform in 2022, showing a generally stable analyst sentiment over recent years.
Which company has the best grades?
Cognex Corporation has received more Buy and Overweight ratings compared to Novanta Inc., which mostly holds Neutral grades. This difference may suggest a more favorable analyst outlook for Cognex, potentially influencing investor confidence and portfolio decisions.
Strengths and Weaknesses
Below is a comparative table outlining key strengths and weaknesses of Cognex Corporation (CGNX) and Novanta Inc. (NOVT) based on their latest financial and operational data.
| Criterion | Cognex Corporation (CGNX) | Novanta Inc. (NOVT) |
|---|---|---|
| Diversification | Moderate: Primarily focused on vision systems with two main revenue streams: Standard Products (~$795M) and Customer Specific Solutions (~$119M) | High: Diverse segments including Precision Manufacturing, Robotics & Automation, Advanced Surgery, and Precision Medicine, each contributing significantly (~$200M+ each) |
| Profitability | Mixed: Net margin favorable at 11.61%, but ROIC at 5.07% below WACC (10.84%), indicating value destruction | Moderate: Net margin neutral at 6.75%, ROIC 7.25% also below WACC (10.82%), slightly unfavorable but improving profitability trend |
| Innovation | Moderate: Focus on vision systems with stable product turnover; fixed asset turnover favorable (5.52) | Strong: Continuous growth in advanced technology sectors with favorable fixed asset turnover (6.08), innovation evident in expanding medical and automation segments |
| Global presence | Established but limited diversification outside core markets | Well-diversified globally through multiple advanced technology fields, enhancing resilience |
| Market Share | Leading in machine vision with steady revenue, but declining ROIC signals competitive pressures | Growing market share in medical and precision technologies, supported by increasing ROIC trend |
Key takeaways: Cognex shows solid product specialization but struggles with declining profitability and value creation. Novanta, while also not yet profitable relative to capital cost, demonstrates improving profitability and better diversification, positioning it more favorably for future growth. Both require cautious investment consideration due to current value destruction.
Risk Analysis
Below is a comparative table of key risks associated with Cognex Corporation (CGNX) and Novanta Inc. (NOVT) based on the most recent data from 2024.
| Metric | Cognex Corporation (CGNX) | Novanta Inc. (NOVT) |
|---|---|---|
| Market Risk | Beta 1.52, moderate volatility | Beta 1.60, slightly higher volatility |
| Debt level | Very low debt-to-equity 0.05, strong balance sheet | Moderate debt-to-equity 0.63, higher leverage |
| Regulatory Risk | Moderate, operating in tech hardware | Moderate, exposure in medical and industrial markets |
| Operational Risk | Dependence on manufacturing automation demand | Diverse segments but complexity may increase operational risks |
| Environmental Risk | Moderate, typical for hardware sector | Moderate, with photonics and medical equipment manufacturing |
| Geopolitical Risk | Low, US-based with global distribution | Low to moderate, US-based with international exposure |
Cognex’s most impactful risk lies in its higher market volatility and valuation concerns, despite low debt and strong financial health. Novanta’s greater leverage and operational complexity pose notable risks, although it maintains a safe bankruptcy risk profile. Both companies face typical sector regulatory and environmental challenges.
Which Stock to Choose?
Cognex Corporation (CGNX) shows a favorable income statement with 9.19% revenue growth in 2024, but declining net margin and EPS. Its financial ratios reveal a mixed picture with 42.86% favorable metrics and low debt levels. The company carries very low net debt and a strong current ratio, though ROE and valuation multiples remain unfavorable. CGNX is rated “B” with a very favorable overall rating and scores strongly on financial stability.
Novanta Inc. (NOVT) presents solid revenue growth of 7.67% in 2024 and favorable income quality, although net margin growth is negative. Its financial ratios are slightly less favorable with 21.43% favorable metrics, moderate debt levels, and neutral profitability ratios. NOVT holds a “C+” rating, indicating a very favorable overall rating, but shows some weaknesses in debt-to-equity and valuation scores.
Investors seeking growth might find Novanta’s improving profitability and revenue trend appealing, while those prioritizing financial stability and low leverage could see Cognex’s stronger balance sheet as more attractive. Both companies display slightly unfavorable financial ratios, but Cognex’s higher rating and stable debt profile might suggest it is suited for more risk-averse profiles, whereas Novanta’s growth trajectory may appeal to moderate risk tolerance.
Disclaimer: Investment carries a risk of loss of initial capital. The past performance is not a reliable indicator of future results. Be sure to understand risks before making an investment decision.
Go Further
I encourage you to read the complete analyses of Cognex Corporation and Novanta Inc. to enhance your investment decisions: