In the competitive landscape of technology hardware, MKS Inc. and Cognex Corporation stand out as key players innovating manufacturing solutions. Both companies serve industries like semiconductor and industrial technologies, with MKS focusing on precision process control and laser systems, while Cognex leads in machine vision and automation. This comparison aims to identify which company offers the most compelling investment opportunity for those seeking growth and stability in this dynamic sector. Stay with me as we uncover the best pick for your portfolio.
Table of contents
Companies Overview
I will begin the comparison between MKS Inc. and Cognex Corporation by providing an overview of these two companies and their main differences.
MKS Inc. Overview
MKS Inc. specializes in providing instruments, systems, and process control solutions that measure, monitor, and control manufacturing processes globally. Its product portfolio includes vacuum and pressure control, power delivery systems, laser technologies, and photonics products. MKS serves diverse sectors such as semiconductors, industrial technologies, life sciences, research, and defense, positioning itself as a critical supplier in advanced manufacturing.
Cognex Corporation Overview
Cognex Corporation focuses on machine vision products that capture and analyze visual data to automate manufacturing and distribution tasks. Its offerings include vision software, sensors, and image-based barcode readers, used across industries like consumer electronics, automotive, pharmaceuticals, and food and beverage. Cognex’s solutions emphasize automation through advanced vision technology to improve production efficiency and quality control.
Key similarities and differences
Both companies operate within the technology sector, providing hardware and equipment critical to manufacturing automation and process control. MKS Inc. has a broader product range including vacuum, laser, and photonics technologies, while Cognex concentrates on machine vision and image analysis solutions. MKS serves a wider set of markets, including defense and research, whereas Cognex is more focused on discrete manufacturing and distribution industries.
Income Statement Comparison
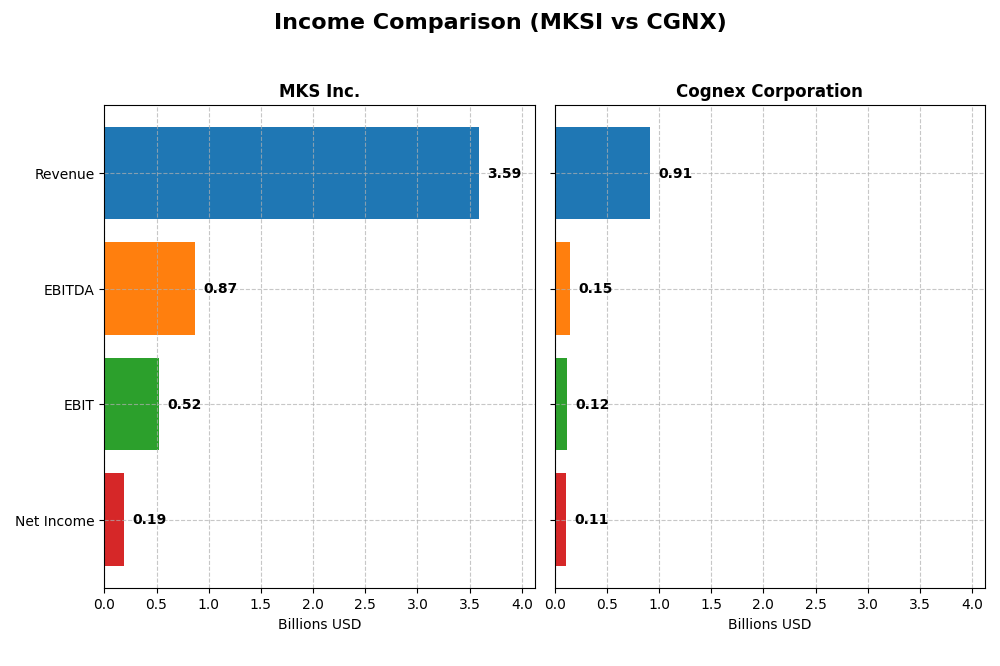
Below is a side-by-side comparison of the latest fiscal year income statement metrics for MKS Inc. and Cognex Corporation.
| Metric | MKS Inc. (MKSI) | Cognex Corporation (CGNX) |
|---|---|---|
| Market Cap | 12.7B | 6.6B |
| Revenue | 3.59B | 915M |
| EBITDA | 870M | 148M |
| EBIT | 522M | 115M |
| Net Income | 190M | 106M |
| EPS | 2.82 | 0.62 |
| Fiscal Year | 2024 | 2024 |
Income Statement Interpretations
MKS Inc.
MKS Inc. showed a 54% revenue growth over 2020-2024 but net income declined by 46%, reflecting volatility. Gross and EBIT margins remain favorable at 47.6% and 14.6%, respectively. In 2024, revenue slightly slipped by 1%, yet EBIT surged 135%, with net margin and EPS more than doubling, indicating improved profitability despite lower sales.
Cognex Corporation
Cognex posted a moderate 13% revenue increase over five years but experienced a 40% drop in net income. Gross margin is robust at 68.4%, with an EBIT margin of 12.6%. For 2024, revenue rose 9%, but EBIT fell 6%, accompanied by declines in net margin and EPS, signaling margin pressure despite top-line growth.
Which one has the stronger fundamentals?
Both companies hold a favorable global income statement opinion, yet MKS Inc. displays stronger margin improvements and EBIT growth in the latest year, offsetting a small revenue dip. Cognex benefits from higher gross margins and revenue growth but faces declining profitability and margin erosion. MKS’s more pronounced margin recovery contrasts with Cognex’s margin challenges.
Financial Ratios Comparison
The table below presents a comparison of selected key financial ratios for MKS Inc. and Cognex Corporation based on their most recent fiscal year data from 2024.
| Ratios | MKS Inc. (MKSI) | Cognex Corporation (CGNX) |
|---|---|---|
| ROE | 8.18% | 6.99% |
| ROIC | 6.31% | 5.07% |
| P/E | 37.0 | 57.9 |
| P/B | 3.03 | 4.05 |
| Current Ratio | 3.19 | 3.62 |
| Quick Ratio | 2.04 | 2.69 |
| D/E | 2.06 | 0.05 |
| Debt-to-Assets | 55.6% | 3.52% |
| Interest Coverage | 1.44 | 0 |
| Asset Turnover | 0.42 | 0.46 |
| Fixed Asset Turnover | 3.55 | 5.52 |
| Payout Ratio | 31.1% | 49.3% |
| Dividend Yield | 0.84% | 0.85% |
Interpretation of the Ratios
MKS Inc.
MKS Inc. shows mostly unfavorable financial ratios, with notable weaknesses in return on equity (8.18%), weighted average cost of capital (11.04%), and debt-related metrics including debt-to-equity (2.06) and debt-to-assets (55.65%). The current ratio is also flagged as unfavorable at 3.19, though the quick ratio is favorable at 2.04. The company pays dividends with a low yield of 0.84%, which may raise concerns about payout sustainability amid weak coverage by free cash flow.
Cognex Corporation
Cognex exhibits a more balanced ratio profile, with 42.86% favorable and 50% unfavorable evaluations. The company posts a strong net margin (11.61%) and solid liquidity ratios, including a quick ratio of 2.69 and very low debt-to-equity (0.05). Interest coverage is infinite, indicating no interest burden. Despite paying dividends with a modest 0.85% yield, the payout appears cautious given the relatively high price-to-earnings ratio of 57.9 and moderate returns.
Which one has the best ratios?
Cognex Corporation holds a better ratio profile overall, supported by stronger profitability, lower leverage, and better interest coverage. MKS Inc.’s financial metrics reflect higher financial risk and weaker returns, particularly in leverage and profitability ratios, contributing to its unfavorable global evaluation. However, both companies face challenges with valuation and dividend yields.
Strategic Positioning
This section compares the strategic positioning of MKS Inc. and Cognex Corporation, including market position, key segments, and exposure to technological disruption:
MKS Inc.
- Larger market cap of 12.7B; operates in hardware, equipment & parts with competitive industry pressure.
- Diversified segments: Vacuum & Analysis, Light & Motion, Equipment & Solutions serve multiple industries.
- Exposure to technological disruption through advanced photonics, laser, and process control systems.
Cognex Corporation
- Smaller market cap of 6.6B; also in hardware, equipment & parts facing competitive market dynamics.
- Focused on machine vision products and software serving manufacturing and distribution automation.
- Faces disruption risks via deep learning vision software and innovative machine vision technologies.
MKS Inc. vs Cognex Corporation Positioning
MKS Inc. pursues a diversified approach across photonics, vacuum, and equipment segments, spreading risk but requiring broad management. Cognex concentrates on machine vision and automation, relying on specialized technology expertise but with narrower market scope.
Which has the best competitive advantage?
Both companies exhibit very unfavorable MOAT evaluations with declining ROIC trends and value destruction, indicating weak competitive advantages and challenges in sustaining profitability over 2020-2024.
Stock Comparison
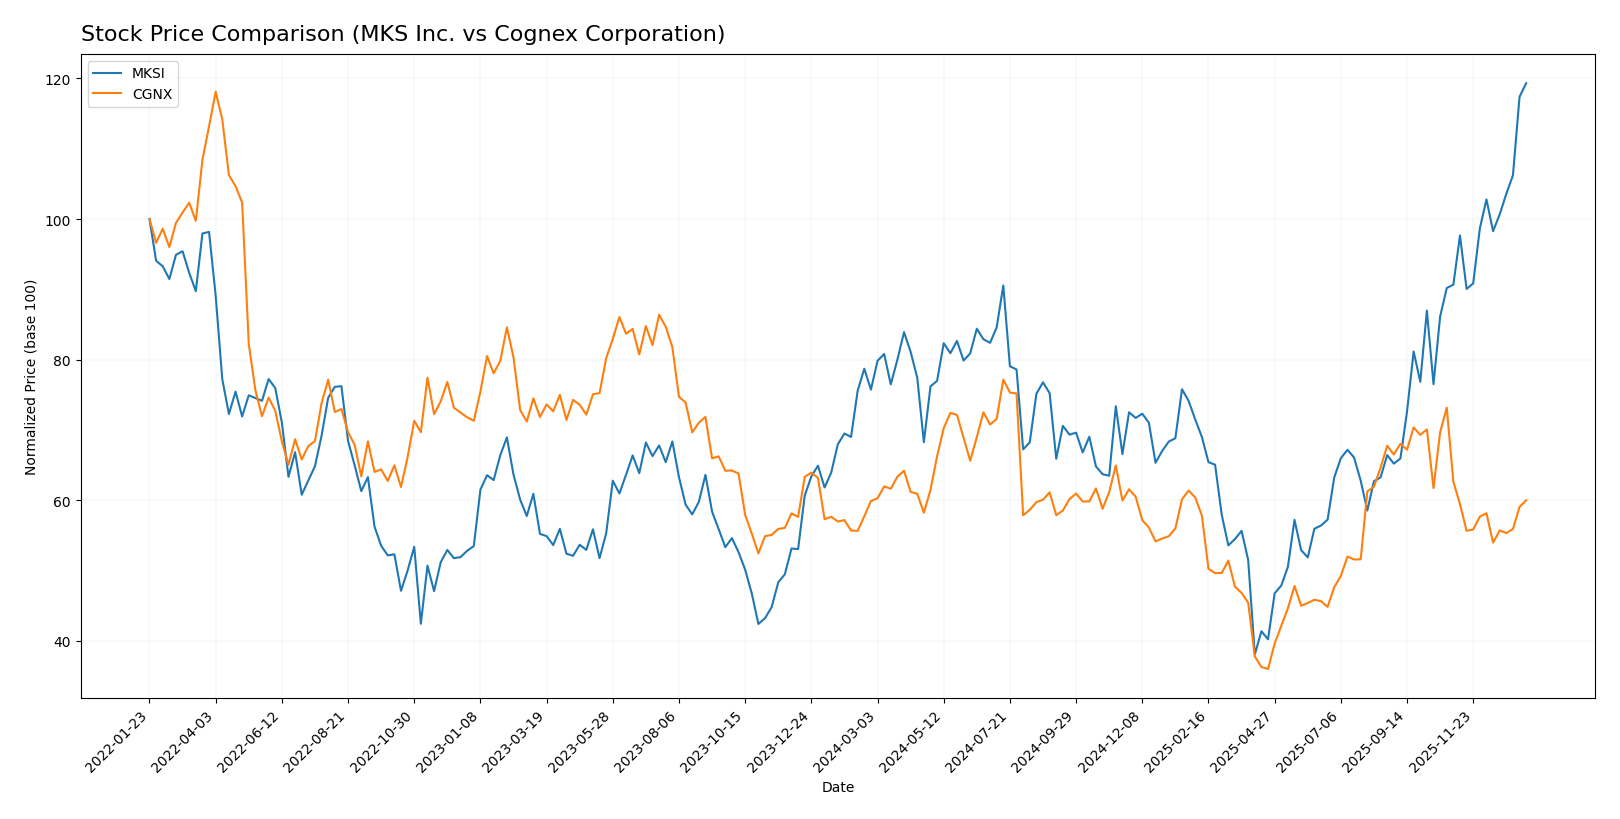
The past year has seen MKS Inc. (MKSI) demonstrate a strong upward trajectory with accelerating gains, while Cognex Corporation (CGNX) experienced a nearly flat annual performance with recent signs of decline.
Trend Analysis
MKS Inc. showed a bullish trend over the past 12 months with a 57.59% price increase, marked by acceleration and significant volatility (24.27 std deviation), reaching a high of 189.16 and a low of 60.29.
Cognex Corporation’s stock displayed a neutral overall trend with a marginal 0.18% increase over the past year, but recent performance indicates a bearish shift with a 4.25% decline and deceleration, coupled with lower volatility (5.92 std deviation).
Comparatively, MKS Inc. outperformed Cognex Corporation, delivering the highest market return with a clear bullish momentum over the analyzed period.
Target Prices
Analysts provide a clear consensus on target prices for MKS Inc. and Cognex Corporation, reflecting their expectations for potential price movements.
| Company | Target High | Target Low | Consensus |
|---|---|---|---|
| MKS Inc. | 215 | 136 | 176.17 |
| Cognex Corporation | 58 | 38 | 48.14 |
The consensus target price for MKS Inc. at 176.17 is slightly below its current price of 189.23, indicating moderate downside risk. For Cognex, the consensus target of 48.14 suggests upside potential from the current 39.64 price level, reflecting more bullish analyst sentiment.
Analyst Opinions Comparison
This section compares analysts’ ratings and grades for MKS Inc. and Cognex Corporation:
Rating Comparison
MKS Inc. Rating
- Rating: B- with a very favorable status
- Discounted Cash Flow Score: 3, indicating moderate value
- ROE Score: 3, reflecting moderate efficiency
- ROA Score: 3, indicating moderate asset utilization
- Debt To Equity Score: 1, showing very unfavorable financial risk
- Overall Score: 2, moderate overall financial standing
Cognex Corporation Rating
- Rating: B with a very favorable status
- Discounted Cash Flow Score: 3, indicating moderate value
- ROE Score: 3, reflecting moderate efficiency
- ROA Score: 4, indicating favorable asset utilization
- Debt To Equity Score: 4, showing favorable financial stability
- Overall Score: 3, moderate overall financial standing
Which one is the best rated?
Based on the data, Cognex Corporation holds a higher rating (B versus B-) and superior scores in return on assets and debt-to-equity, indicating better asset utilization and financial stability compared to MKS Inc.
Scores Comparison
Here is a comparison of the financial health scores for MKS Inc. and Cognex Corporation:
MKS Inc. Scores
- Altman Z-Score: 2.22, in the grey zone indicating moderate bankruptcy risk.
- Piotroski Score: 7, indicating strong financial health.
Cognex Corporation Scores
- Altman Z-Score: 9.07, in the safe zone indicating low bankruptcy risk.
- Piotroski Score: 7, indicating strong financial health.
Which company has the best scores?
Cognex Corporation has a significantly higher Altman Z-Score, placing it in the safe zone, compared to MKS Inc.’s grey zone score. Both companies share the same strong Piotroski Score of 7.
Grades Comparison
The grade analysis for MKS Inc. and Cognex Corporation reveals the latest professional assessments from recognized grading companies:
MKS Inc. Grades
The following table summarizes recent grades assigned to MKS Inc. by reputable financial institutions.
| Grading Company | Action | New Grade | Date |
|---|---|---|---|
| B of A Securities | Maintain | Buy | 2026-01-13 |
| Needham | Maintain | Buy | 2026-01-13 |
| Mizuho | Maintain | Outperform | 2025-12-17 |
| Citigroup | Maintain | Buy | 2025-11-12 |
| Wells Fargo | Maintain | Equal Weight | 2025-11-07 |
| Keybanc | Maintain | Overweight | 2025-11-07 |
| Benchmark | Maintain | Buy | 2025-11-07 |
| Needham | Maintain | Buy | 2025-11-06 |
| Mizuho | Maintain | Outperform | 2025-10-16 |
| Needham | Maintain | Buy | 2025-10-13 |
MKS Inc.’s grades consistently show positive recommendations, mainly “Buy” and “Outperform,” indicating a generally favorable outlook by analysts.
Cognex Corporation Grades
The table below presents the recent grades assigned to Cognex Corporation by established grading companies.
| Grading Company | Action | New Grade | Date |
|---|---|---|---|
| Barclays | Maintain | Overweight | 2026-01-12 |
| Truist Securities | Maintain | Hold | 2025-12-18 |
| Goldman Sachs | Upgrade | Buy | 2025-12-16 |
| JP Morgan | Downgrade | Underweight | 2025-12-03 |
| DA Davidson | Maintain | Neutral | 2025-11-03 |
| Barclays | Maintain | Overweight | 2025-10-31 |
| Needham | Maintain | Buy | 2025-10-31 |
| Baird | Maintain | Neutral | 2025-10-31 |
| Truist Securities | Maintain | Hold | 2025-10-08 |
| Goldman Sachs | Maintain | Sell | 2025-09-16 |
Cognex Corporation’s ratings present a mixed picture, ranging from “Buy” and “Overweight” to “Hold,” “Neutral,” and even “Sell,” reflecting diverse analyst opinions.
Which company has the best grades?
MKS Inc. has received more consistent and predominantly positive grades compared to Cognex Corporation’s mixed and sometimes cautious ratings. For investors, MKS’s stronger consensus may indicate more confidence in its near-term prospects, while Cognex’s varied grades imply a wider range of risk perceptions.
Strengths and Weaknesses
Below is a comparison of key strengths and weaknesses for MKS Inc. (MKSI) and Cognex Corporation (CGNX) based on their latest financial performance and market position.
| Criterion | MKS Inc. (MKSI) | Cognex Corporation (CGNX) |
|---|---|---|
| Diversification | Moderate product range across vacuum, photonics, and equipment solutions | Focused on machine vision with customer-specific and standard products |
| Profitability | Neutral net margin (5.3%), but unfavorable ROE (8.18%) and ROIC (6.31%) with declining trend | Higher net margin (11.6%), but also unfavorable ROE (7%) and neutral ROIC (5.07%) with declining trend |
| Innovation | Moderate innovation in photonics and vacuum technologies | Strong innovation in machine vision systems and customer solutions |
| Global presence | Solid global sales with $3.12B product revenue in 2024 | Global footprint with $0.92B total revenue in 2024, growing customer-specific solutions |
| Market Share | Market leader in vacuum and photonics segments, but profitability concerns | Leading in vision systems but challenged by valuation and profitability trends |
Key takeaways: Both companies show value destruction signs with declining ROIC and unfavorable profitability metrics. Cognex benefits from better margins and lower debt, while MKS has a broader product portfolio but struggles with financial efficiency. Caution and close monitoring are advised before investing.
Risk Analysis
Below is a comparative risk table for MKS Inc. (MKSI) and Cognex Corporation (CGNX) based on the most recent available data from 2024.
| Metric | MKS Inc. (MKSI) | Cognex Corporation (CGNX) |
|---|---|---|
| Market Risk | High beta at 1.918, indicating greater volatility vs. market | Moderate beta at 1.519, somewhat volatile |
| Debt level | High leverage with debt-to-equity ratio of 2.06 (unfavorable) | Very low leverage, debt-to-equity 0.05 (favorable) |
| Regulatory Risk | Moderate, operating in global manufacturing and semiconductor sectors | Moderate, exposure to regulated industries like healthcare and automotive |
| Operational Risk | Complexity in diverse tech products and manufacturing processes | Focused on machine vision, but reliant on manufacturing cycles |
| Environmental Risk | Medium, involves manufacturing and laser tech with potential hazardous materials | Lower, mainly software and vision systems with less direct environmental impact |
| Geopolitical Risk | Moderate, global supply chain exposure | Moderate, global customer base and supply chain |
In summary, MKS Inc. faces higher financial and market risks due to its significant debt load and volatile stock behavior, placing it in a moderate financial distress “grey zone” per Altman Z-score. Cognex, with low debt and a safer Altman Z-score, presents lower financial risk but has a high P/E ratio signaling valuation concerns. Market volatility and debt levels are the most impactful risks to monitor for these companies.
Which Stock to Choose?
MKS Inc. (MKSI) shows a mixed income evolution with a favorable gross and EBIT margin but a slight recent revenue decline. Its profitability is moderate, with an ROE of 8.18% and a high debt level (DE 2.06) contributing to an unfavorable financial ratios profile. The company’s rating is very favorable (B-), despite some financial stability concerns.
Cognex Corporation (CGNX) reports favorable income margins and steady revenue growth but faces declining net margin and EPS recently. Its financial ratios are slightly unfavorable overall, yet it benefits from low debt (DE 0.05), a strong current ratio, and a very safe Altman Z-Score. CGNX holds a very favorable rating (B) with balanced strengths and weaknesses.
For investors, MKSI might appear more suitable for those prioritizing strong margin improvements and higher revenue growth, albeit with higher leverage risk. Meanwhile, CGNX could be seen as preferable for risk-averse investors valuing financial stability and low debt, despite its recent profitability softness. Both companies show very unfavorable MOAT statuses, indicating value destruction and declining profitability trends.
Disclaimer: Investment carries a risk of loss of initial capital. The past performance is not a reliable indicator of future results. Be sure to understand risks before making an investment decision.
Go Further
I encourage you to read the complete analyses of MKS Inc. and Cognex Corporation to enhance your investment decisions: