In today’s fast-evolving technology landscape, Cognex Corporation and MicroVision, Inc. stand out as key players in hardware and equipment sectors, each driving innovation in machine vision and lidar technologies. Cognex excels in automated visual inspection for manufacturing, while MicroVision focuses on lidar sensors and augmented reality displays. This comparison will help investors understand which company offers the most promising opportunities for growth and value in 2026. Let’s explore which stock deserves a place in your portfolio.
Table of contents
Companies Overview
I will begin the comparison between Cognex Corporation and MicroVision, Inc. by providing an overview of these two companies and their main differences.
Cognex Corporation Overview
Cognex Corporation specializes in machine vision products designed to capture and analyze visual data for automating manufacturing and distribution globally. Its solutions include VisionPro software, QuickBuild programming tools, and deep learning vision software. The company serves industries such as consumer electronics, automotive, pharmaceuticals, and food and beverage, positioning itself as a key player in hardware and equipment for industrial automation.
MicroVision, Inc. Overview
MicroVision, Inc. develops lidar sensors focused on automotive safety and autonomous driving, relying on laser beam scanning and micro-electrical mechanical systems technology. Its product lineup also includes micro-displays for augmented reality headsets and interactive display modules for smart devices. The company mainly sells to original equipment manufacturers and original design manufacturers, operating within the hardware and equipment sector.
Key similarities and differences
Both Cognex and MicroVision operate within the technology sector, specifically hardware and equipment, with an emphasis on advanced sensing and imaging technologies. While Cognex focuses on machine vision systems for industrial automation, MicroVision targets lidar and display technologies primarily for automotive and augmented reality applications. Their customer bases differ, with Cognex serving diverse manufacturing industries and MicroVision catering mainly to OEMs and ODMs.
Income Statement Comparison
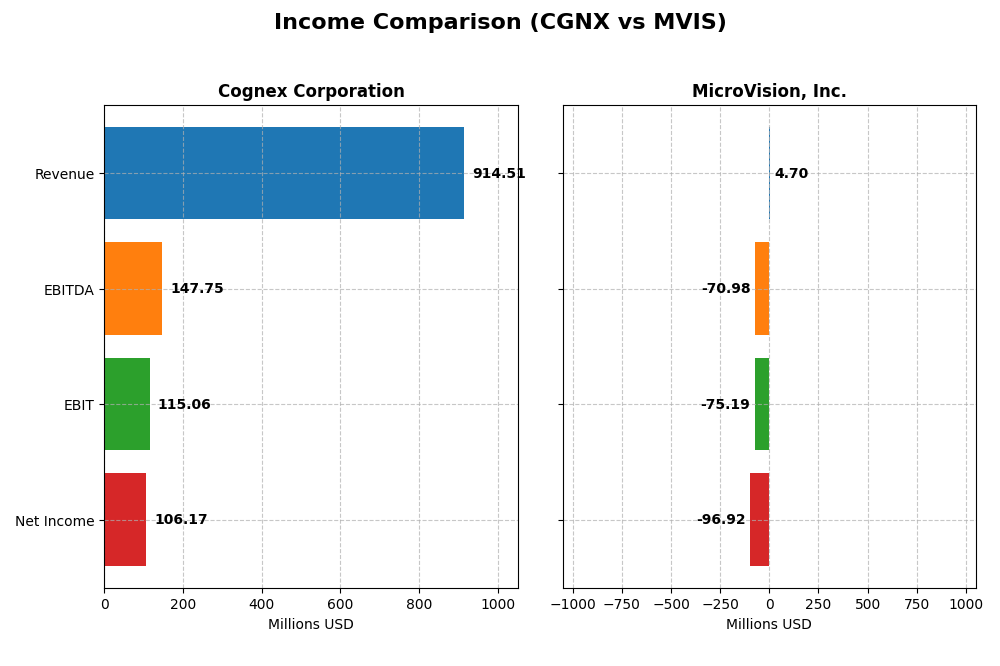
Below is a comparison of key income statement metrics for Cognex Corporation and MicroVision, Inc. for the fiscal year 2024.
| Metric | Cognex Corporation (CGNX) | MicroVision, Inc. (MVIS) |
|---|---|---|
| Market Cap | 6.7B | 292M |
| Revenue | 915M | 4.7M |
| EBITDA | 148M | -71M |
| EBIT | 115M | -75M |
| Net Income | 106M | -97M |
| EPS | 0.62 | -0.46 |
| Fiscal Year | 2024 | 2024 |
Income Statement Interpretations
Cognex Corporation
Cognex Corporation experienced overall revenue growth of 12.76% from 2020 to 2024, with a 9.19% increase in the latest year. However, net income declined by 39.74% over the period, and net margin shrank by 46.56%. In 2024, revenue growth slowed but gross margin remained favorable at 68.43%, though net margin and EPS showed unfavorable declines.
MicroVision, Inc.
MicroVision saw a 51.97% revenue increase over 2020-2024 but suffered a steep net income drop of 610.83% and a negative gross margin of -60.35%. The latest fiscal year saw a 35.31% revenue decrease and worsening net margin to -2063.78%. EBIT improved slightly last year, but overall financial health remains weak with high interest expense and sustained losses.
Which one has the stronger fundamentals?
Cognex shows stronger fundamentals with consistent revenue growth, positive gross and net margins, and a favorable overall income statement evaluation despite recent earnings declines. In contrast, MicroVision’s income statement reveals severe losses, negative margins, and unfavorable expense ratios. Therefore, Cognex’s financials appear more stable and robust compared to MicroVision’s challenging performance.
Financial Ratios Comparison
The table below presents a side-by-side comparison of key financial ratios for Cognex Corporation (CGNX) and MicroVision, Inc. (MVIS) based on their most recent fiscal year data ending 2024.
| Ratios | Cognex Corporation (CGNX) | MicroVision, Inc. (MVIS) |
|---|---|---|
| ROE | 7.0% | -198.7% |
| ROIC | 5.1% | -83.7% |
| P/E | 57.9 | -2.83 |
| P/B | 4.05 | 5.63 |
| Current Ratio | 3.62 | 1.79 |
| Quick Ratio | 2.69 | 1.74 |
| D/E (Debt-to-Equity) | 0.046 | 1.06 |
| Debt-to-Assets | 3.5% | 42.6% |
| Interest Coverage | 0 (not positive) | -19.2 |
| Asset Turnover | 0.46 | 0.039 |
| Fixed Asset Turnover | 5.52 | 0.20 |
| Payout Ratio | 49.3% | 0% |
| Dividend Yield | 0.85% | 0% |
Interpretation of the Ratios
Cognex Corporation
Cognex shows a mixed ratio profile with 42.86% favorable and 50% unfavorable indicators, reflecting some concerns. Key strengths include a low debt-to-equity ratio of 0.05 and strong interest coverage, but weaknesses appear in valuation with a high PE of 57.9 and a current ratio at 3.62 marked unfavorable. The company pays dividends, yielding 0.85% annually, but the payout ratio and coverage by free cash flow suggest cautious monitoring due to potential sustainability risks.
MicroVision, Inc.
MicroVision’s ratios are mostly weak, with 64.29% unfavorable and just 21.43% favorable, indicating significant financial challenges. The company reports negative profitability metrics, including a net margin of -2063.78% and a return on equity of -198.72%. It does not pay dividends, reflecting its high growth phase and reinvestment focus, with substantial R&D expenses above 10% of revenue and no current share buyback programs.
Which one has the best ratios?
Between the two, Cognex Corporation’s ratios are relatively stronger and more balanced despite some valuation concerns, while MicroVision faces severe profitability and leverage difficulties. Cognex’s favorable leverage and interest coverage contrast with MicroVision’s negative returns and high debt-to-equity ratio, making Cognex the company with the more robust financial ratios as of 2024.
Strategic Positioning
This section compares the strategic positioning of Cognex Corporation and MicroVision, Inc., including Market position, Key segments, and Exposure to technological disruption:
Cognex Corporation
- Established leader in machine vision with broad competitive pressure in hardware and equipment parts.
- Key segments include standard machine vision products and customer-specific applications driving revenue.
- Faces moderate disruption risk with evolving vision software and sensor technologies but established markets.
MicroVision, Inc.
- Smaller player focused on lidar sensors for automotive safety and AR display technologies.
- Revenue driven by contracts, licenses, royalties, and product sales mainly in lidar and scanning technologies.
- Higher disruption exposure due to reliance on emerging lidar and micro-display technologies in evolving markets.
Cognex Corporation vs MicroVision, Inc. Positioning
Cognex has a diversified product portfolio across multiple industries with stable revenue streams, while MicroVision concentrates on innovative lidar and AR technologies. Cognex benefits from scale, whereas MicroVision faces higher technological risk but potential growth in emerging sectors.
Which has the best competitive advantage?
Neither company currently shows a strong competitive advantage; Cognex is shedding value with declining profitability, while MicroVision is also shedding value but with improving profitability trends.
Stock Comparison
The stock price movements over the past year reveal contrasting dynamics: Cognex Corporation (CGNX) shows a modest overall gain with decelerating momentum, while MicroVision, Inc. (MVIS) experiences a steep decline alongside decelerating bearish pressure.

Trend Analysis
Cognex Corporation’s stock exhibits a slight bullish trend over the past 12 months with a 0.66% price increase, decelerating momentum, and a price range between 23.77 and 50.98. Recent weeks show a mild bearish correction of -3.79%.
MicroVision, Inc. faces a pronounced bearish trend with a -52.14% price change over the same period, deceleration in downward movement, and trading between 0.82 and 2.47. The recent period shows further decline of -18.2%.
Comparing both stocks, Cognex has delivered the highest market performance with a positive trend, whereas MicroVision’s stock has significantly underperformed with a strong bearish trajectory.
Target Prices
The current analyst consensus presents a balanced outlook for these technology hardware companies.
| Company | Target High | Target Low | Consensus |
|---|---|---|---|
| Cognex Corporation | 58 | 38 | 48.14 |
| MicroVision, Inc. | 5 | 5 | 5 |
For Cognex Corporation, the consensus target price of 48.14 USD suggests upside potential from the current price of 39.73 USD. MicroVision’s consensus target of 5 USD indicates a strong expected appreciation compared to its current price near 0.96 USD.
Analyst Opinions Comparison
This section compares analysts’ ratings and grades for Cognex Corporation and MicroVision, Inc.:
Rating Comparison
Cognex Rating
- Rating: B, evaluated as Very Favorable overall rating.
- Discounted Cash Flow Score: 3, indicating a moderate valuation based on cash flow.
- ROE Score: 3, showing moderate efficiency in generating profit from equity.
- ROA Score: 4, reflecting a favorable utilization of assets to generate earnings.
- Debt To Equity Score: 4, favorable financial risk evaluation with low leverage.
- Overall Score: 3, representing a moderate overall financial standing.
MicroVision Rating
- Rating: C-, also described as Very Favorable overall rating.
- Discounted Cash Flow Score: 1, considered very unfavorable for valuation.
- ROE Score: 1, indicating very unfavorable profit generation efficiency.
- ROA Score: 1, considered very unfavorable asset utilization for earnings.
- Debt To Equity Score: 2, moderate financial risk with higher leverage.
- Overall Score: 1, indicating a very unfavorable overall financial standing.
Which one is the best rated?
Based strictly on the data, Cognex holds a better rating and higher scores across most financial metrics, including cash flow, ROE, ROA, and debt-to-equity, compared to MicroVision’s consistently lower and unfavorable scores.
Scores Comparison
Here is a comparison of the financial scores for Cognex Corporation and MicroVision, Inc.:
CGNX Scores
- Altman Z-Score: 9.07, indicating a safe zone, low bankruptcy risk.
- Piotroski Score: 7, classified as strong financial health.
MVIS Scores
- Altman Z-Score: -6.42, indicating distress zone, high bankruptcy risk.
- Piotroski Score: 1, classified as very weak financial health.
Which company has the best scores?
Cognex Corporation has significantly better scores, with a strong Piotroski Score of 7 and a safe zone Altman Z-Score of 9.07, compared to MicroVision’s distress zone Altman Z-Score and very weak Piotroski Score of 1.
Grades Comparison
Here is a comparison of the latest reliable grades from recognized grading companies for Cognex Corporation and MicroVision, Inc.:
Cognex Corporation Grades
The following table summarizes recent grades assigned to Cognex Corporation by established financial institutions.
| Grading Company | Action | New Grade | Date |
|---|---|---|---|
| Barclays | Maintain | Overweight | 2026-01-12 |
| Truist Securities | Maintain | Hold | 2025-12-18 |
| Goldman Sachs | Upgrade | Buy | 2025-12-16 |
| JP Morgan | Downgrade | Underweight | 2025-12-03 |
| DA Davidson | Maintain | Neutral | 2025-11-03 |
| Barclays | Maintain | Overweight | 2025-10-31 |
| Needham | Maintain | Buy | 2025-10-31 |
| Baird | Maintain | Neutral | 2025-10-31 |
| Truist Securities | Maintain | Hold | 2025-10-08 |
| Goldman Sachs | Maintain | Sell | 2025-09-16 |
Cognex shows a mixed trend with recent upgrades and downgrades, reflecting varied analyst sentiment and a balance between buy, hold, and sell recommendations.
MicroVision, Inc. Grades
The following table presents recent grades for MicroVision, Inc. from recognized grading firms.
| Grading Company | Action | New Grade | Date |
|---|---|---|---|
| D. Boral Capital | Maintain | Buy | 2025-12-16 |
| D. Boral Capital | Maintain | Buy | 2025-11-12 |
| WestPark Capital | Maintain | Buy | 2025-10-21 |
| WestPark Capital | Maintain | Buy | 2025-09-05 |
| D. Boral Capital | Maintain | Buy | 2025-09-02 |
| WestPark Capital | Maintain | Buy | 2025-08-27 |
| D. Boral Capital | Maintain | Buy | 2025-08-11 |
| D. Boral Capital | Maintain | Buy | 2025-05-21 |
| D. Boral Capital | Maintain | Buy | 2025-05-13 |
| WestPark Capital | Maintain | Buy | 2025-03-27 |
MicroVision’s grades consistently reflect a strong buy consensus, with no downgrades or hold ratings in the recent period.
Which company has the best grades?
MicroVision, Inc. has received consistently positive buy ratings, while Cognex Corporation’s grades are more mixed with buy, hold, and sell actions. This divergence may influence investors’ perception of MicroVision as having stronger analyst support, potentially affecting investment decisions accordingly.
Strengths and Weaknesses
Below is a comparative overview of the main strengths and weaknesses of Cognex Corporation (CGNX) and MicroVision, Inc. (MVIS) based on their recent financial and operational data.
| Criterion | Cognex Corporation (CGNX) | MicroVision, Inc. (MVIS) |
|---|---|---|
| Diversification | Moderate; revenue split between customer-specific solutions (119M) and standard products (795M) in 2024 | Limited; revenues mainly from product and license segments with fluctuating contract revenue |
| Profitability | Moderate profitability with net margin of 11.6% but ROIC below WACC indicating value destruction | Negative profitability; net margin deeply negative (-2063%) and negative ROIC, but improving ROIC trend |
| Innovation | Established product lineup with steady revenue growth in standard products | Emerging innovation with growing profitability trend but overall financial instability |
| Global presence | Strong global sales footprint reflected in large and diversified product revenue streams | Smaller scale with less diversified international exposure |
| Market Share | Established market position in industrial machine vision | Niche player with limited market penetration and volatile revenue streams |
In summary, Cognex offers a stable revenue base and moderate profitability but faces challenges in value creation and efficiency. MicroVision is still developing its profitability with a growing ROIC trend but remains financially unstable and less diversified. Investors should weigh stability against growth potential carefully.
Risk Analysis
Below is a comparative overview of key risks for Cognex Corporation (CGNX) and MicroVision, Inc. (MVIS) based on the most recent 2024 data.
| Metric | Cognex Corporation (CGNX) | MicroVision, Inc. (MVIS) |
|---|---|---|
| Market Risk | Beta 1.52 indicates moderate volatility in tech sector | Beta 1.27 reflects moderately high volatility with smaller market cap |
| Debt Level | Low debt-to-equity ratio (0.05), very favorable | High debt-to-equity ratio (1.06), unfavorable leverage risk |
| Regulatory Risk | Moderate, typical for hardware & software industry | Moderate, automotive and lidar tech subject to evolving regulations |
| Operational Risk | Stable with 2,914 employees and established products | High risk due to small size (185 employees) and heavy R&D focus |
| Environmental Risk | Low; primarily hardware manufacturing | Moderate; lidar and laser tech may face environmental scrutiny |
| Geopolitical Risk | US-based with global sales, moderate exposure | US-based with global OEM customers, moderate exposure |
In summary, Cognex shows manageable market and operational risks with strong financial stability, while MicroVision faces significant financial distress and operational risks. MVIS’s high debt and negative profitability are most impactful, increasing bankruptcy risk, whereas CGNX’s risks are more moderate and manageable.
Which Stock to Choose?
Cognex Corporation (CGNX) shows a favorable income statement with 11.61% net margin and 9.19% revenue growth in 2024, though profitability metrics such as ROE (7.0%) and net margin growth are slightly unfavorable. Debt levels are low and financial ratios present a slightly unfavorable overall picture, supported by a strong Altman Z-Score of 9.07 and a solid Piotroski score of 7.
MicroVision, Inc. (MVIS) displays an unfavorable income statement marked by a -2063.78% net margin and declining revenue (-35.31% in 2024), alongside poor profitability and high debt-to-equity ratio (1.06). Financial ratios are mostly unfavorable, with a weak Altman Z-Score (-6.42) and a very weak Piotroski score of 1, signaling financial distress despite a slight improvement in ROIC trend.
Investors prioritizing financial stability and consistent profitability might find Cognex’s profile more favorable given its strong credit scores and overall income stability. Conversely, those with a higher risk tolerance and focus on growth opportunities could perceive MicroVision’s improving ROIC trend as a potential, albeit uncertain, sign of recovery.
Disclaimer: Investment carries a risk of loss of initial capital. The past performance is not a reliable indicator of future results. Be sure to understand risks before making an investment decision.
Go Further
I encourage you to read the complete analyses of Cognex Corporation and MicroVision, Inc. to enhance your investment decisions: