In the competitive world of technology hardware, Cognex Corporation and Mesa Laboratories, Inc. stand out for their innovative approaches and industry impact. Both companies operate within hardware and equipment sectors but serve distinct niches—Cognex excels in machine vision for manufacturing automation, while Mesa leads in life sciences tools and quality control products. This article will explore their strengths and market positions to help you identify the most promising investment opportunity.
Table of contents
Companies Overview
I will begin the comparison between Cognex Corporation and Mesa Laboratories, Inc. by providing an overview of these two companies and their main differences.
Cognex Corporation Overview
Cognex Corporation specializes in machine vision products designed to capture and analyze visual information for automating manufacturing and distribution tasks globally. Their offerings include advanced vision software and sensor systems used in industries such as automotive, consumer electronics, pharmaceuticals, and food and beverage. Headquartered in Natick, Massachusetts, Cognex holds a strong position in the hardware, equipment, and parts sector with a market cap of $6.66B.
Mesa Laboratories, Inc. Overview
Mesa Laboratories, Inc. develops and sells life sciences tools and quality control products for sterilization, biopharmaceutical development, calibration, and clinical genomics. Operating internationally from Lakewood, Colorado, it serves hospital, pharmaceutical, dental, and laboratory markets with specialized equipment and testing services. Mesa’s market capitalization stands at $471M, reflecting its focused niche within the technology hardware sector.
Key similarities and differences
Both companies operate in the hardware, equipment, and parts industry, focusing on technology-driven solutions for quality control and automation. Cognex emphasizes machine vision systems for manufacturing and distribution automation, while Mesa concentrates on life sciences tools and calibration products essential for health and safety compliance. The scale of operations and market capitalization significantly differ, with Cognex positioned as a larger player compared to the more specialized and smaller Mesa Laboratories.
Income Statement Comparison
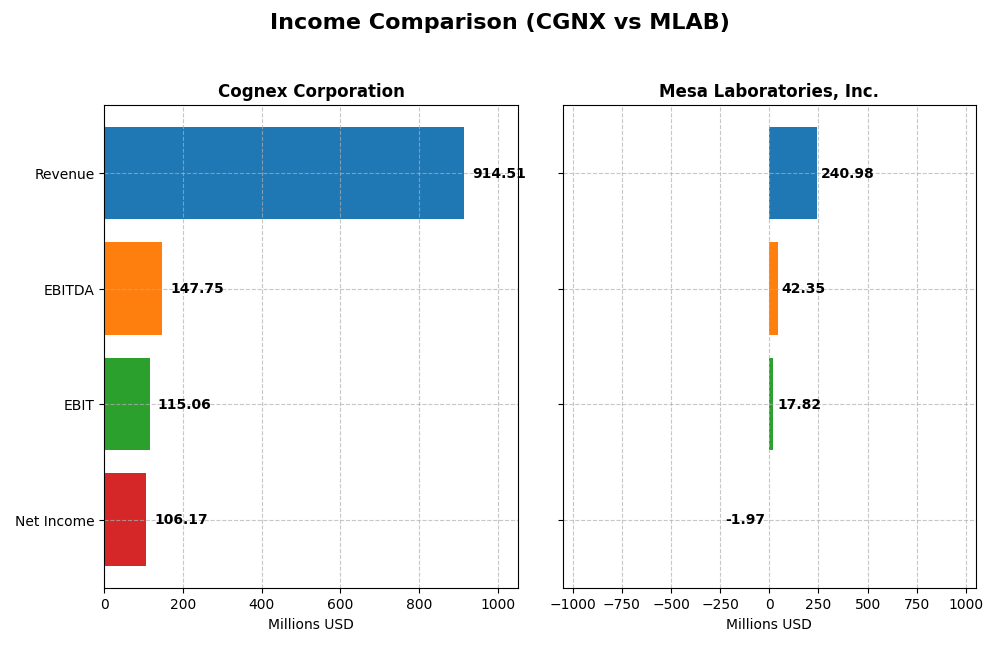
Below is the income statement comparison for Cognex Corporation and Mesa Laboratories, Inc. based on their most recent fiscal year data.
| Metric | Cognex Corporation | Mesa Laboratories, Inc. |
|---|---|---|
| Market Cap | 6.66B | 471M |
| Revenue | 914.5M | 240.98M |
| EBITDA | 147.75M | 42.35M |
| EBIT | 115.07M | 17.82M |
| Net Income | 106.17M | -1.97M |
| EPS | 0.62 | -0.36 |
| Fiscal Year | 2024 | 2025 |
Income Statement Interpretations
Cognex Corporation
Cognex Corporation’s revenue exhibited a favorable growth trend from 2020 to 2024, increasing by 12.76%, while net income declined by 39.74% over the same period. Gross margin remained strong and stable at 68.43%, with a net margin of 11.61% in 2024, though net margin growth was negative. The latest fiscal year showed revenue growth slowing to 9.19%, with a 14.13% contraction in net margin and a 4.62% decrease in EPS.
Mesa Laboratories, Inc.
Mesa Laboratories’ revenue grew robustly by nearly 80% from 2021 to 2025, supported by favorable gross margin around 62.61%. EBIT margin was moderate at 7.39%, while net margin was negative at -0.82% in 2025. Despite a challenging overall net income decline of 160.29%, the most recent year demonstrated strong recovery with EBIT growth of 106.6%, net margin improvement of 99.3%, and EPS nearly doubling, reflecting operational improvements.
Which one has the stronger fundamentals?
Both companies present favorable global income statement evaluations, with Cognex showing more stable margins and consistent revenue growth but declining net income and earnings per share. Mesa Laboratories displays stronger revenue and EBIT growth recently, yet struggles with negative net margins and significant net income volatility. Cognex’s margin stability contrasts with Mesa’s earnings recovery amid prior losses, highlighting differing fundamental strengths and challenges.
Financial Ratios Comparison
The following table presents the most recent key financial ratios for Cognex Corporation (CGNX) and Mesa Laboratories, Inc. (MLAB) to facilitate a direct comparison of their financial health and market valuation metrics.
| Ratios | Cognex Corporation (CGNX) 2024 | Mesa Laboratories, Inc. (MLAB) 2025 Q1 |
|---|---|---|
| ROE | 7.0% | -1.2% |
| ROIC | 5.1% | -1.4% |
| P/E | 57.9 | -326.3 |
| P/B | 4.05 | 4.03 |
| Current Ratio | 3.62 | 0.63 |
| Quick Ratio | 2.69 | 0.47 |
| D/E (Debt-to-Equity) | 0.046 | 1.14 |
| Debt-to-Assets | 3.5% | 41.9% |
| Interest Coverage | 0 (not reported) | 1.38 |
| Asset Turnover | 0.46 | 0.56 |
| Fixed Asset Turnover | 5.52 | 7.45 |
| Payout ratio | 49.3% | -175.7% |
| Dividend yield | 0.85% | 0.54% |
Interpretation of the Ratios
Cognex Corporation
Cognex shows a mix of strengths and weaknesses in its financial ratios. Its net margin is favorable at 11.61%, supported by strong interest coverage and low debt levels, but the high PE ratio (57.9) and price-to-book ratio (4.05) are unfavorable, indicating potential valuation concerns. The company pays dividends with a low yield of 0.85%, suggesting modest shareholder returns that might be limited by these valuation and profitability factors.
Mesa Laboratories, Inc.
Mesa Laboratories exhibits predominantly unfavorable ratios, including negative net margin (-0.82%), return on equity (-1.24%), and return on invested capital (-1.45%), reflecting operational challenges. Its high debt-to-equity (1.14) and weak liquidity ratios (current ratio 0.63) raise concerns. Despite paying a dividend with a 0.54% yield, the company’s negative earnings and free cash flow indicate risks to dividend sustainability.
Which one has the best ratios?
Cognex demonstrates a stronger overall financial profile with a higher proportion of favorable ratios (42.86%) compared to Mesa’s 21.43%. While Cognex faces some valuation and profitability challenges, Mesa’s negative profitability metrics, weaker liquidity, and higher leverage result in a generally less favorable ratio evaluation. Thus, Cognex holds the advantage in this ratio comparison.
Strategic Positioning
This section compares the strategic positioning of Cognex Corporation and Mesa Laboratories, Inc., including market position, key segments, and exposure to technological disruption:
Cognex Corporation
- Large market cap of 6.66B in machine vision hardware; faces competitive pressure in automation and manufacturing sectors.
- Key segments include machine vision products and barcode readers serving automotive, consumer electronics, and pharmaceuticals.
- Uses advanced vision software and deep learning but operates in a hardware space vulnerable to rapid tech advances.
Mesa Laboratories, Inc.
- Smaller market cap of 471M focusing on life sciences tools; competitive in sterilization and biopharma equipment.
- Diversified segments: sterilization control, biopharmaceutical development, calibration solutions, and clinical genomics.
- Develops automated protein analysis and genetic tools, facing ongoing innovation in biotech and lab automation.
Cognex Corporation vs Mesa Laboratories, Inc. Positioning
Cognex has a concentrated focus on machine vision and industrial automation, benefiting from scale but exposed to hardware disruption. Mesa Laboratories is more diversified across life sciences tools, spreading risk but with a smaller market footprint and narrower scale advantages.
Which has the best competitive advantage?
Both companies show declining ROIC trends and are shedding value relative to their costs of capital, indicating weak competitive moats and challenges in sustaining profitable advantages.
Stock Comparison
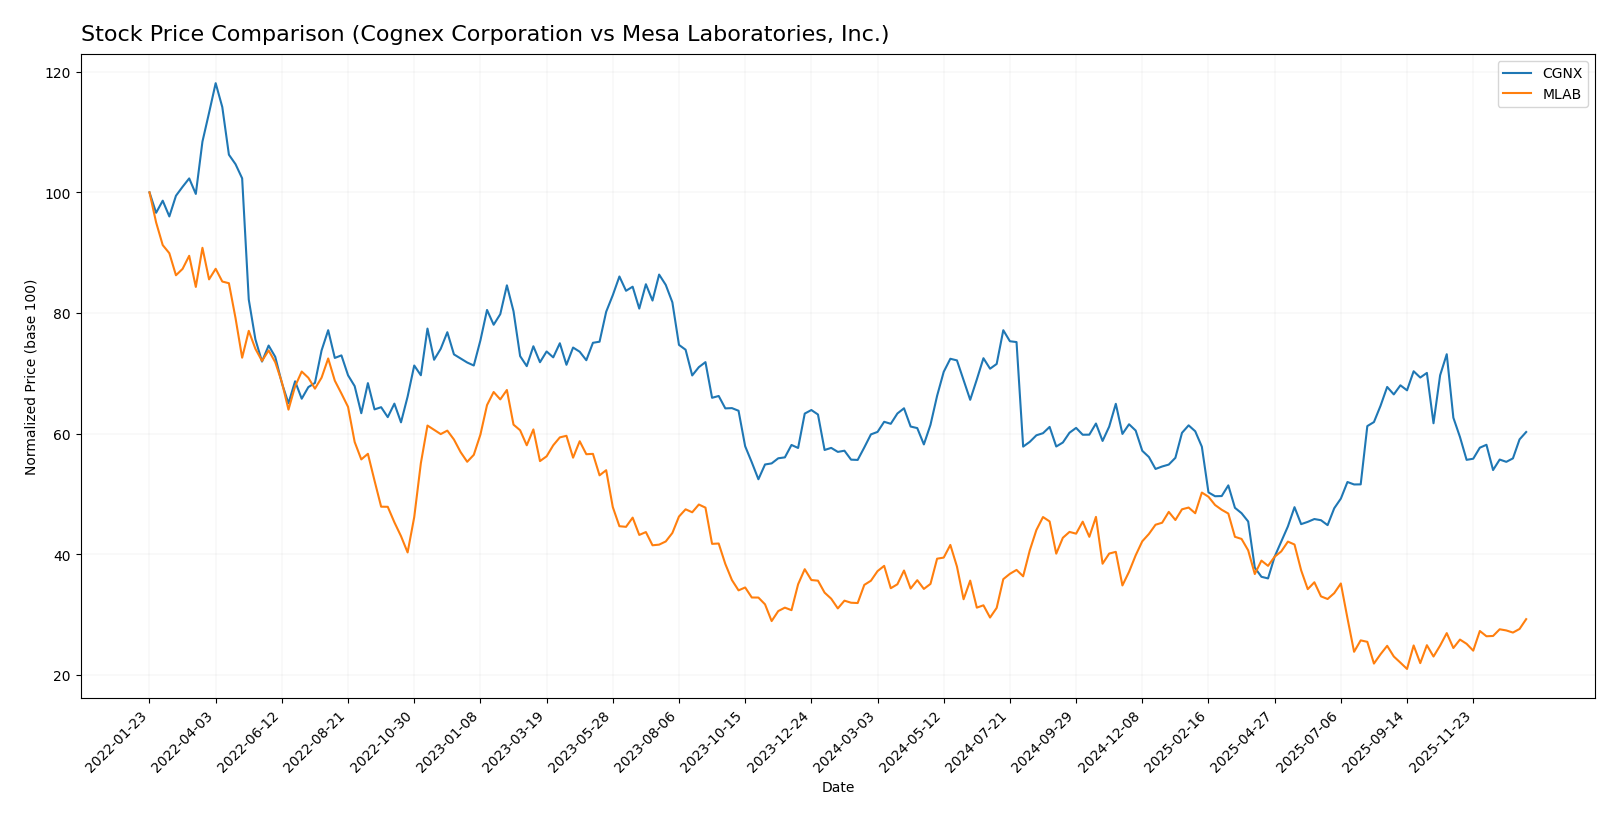
The stock price movements of Cognex Corporation and Mesa Laboratories, Inc. over the past 12 months reveal contrasting trends, with Cognex showing mild overall gains and Mesa facing a significant decline followed by recent recovery dynamics.
Trend Analysis
Cognex Corporation’s stock exhibited a 0.66% increase over the past year, indicating a bullish trend with deceleration in price growth. The stock’s volatility measured by a 5.92 std deviation, with a high of 50.98 and low of 23.77.
Mesa Laboratories, Inc. experienced a -17.91% decline over the year, confirming a bearish trend despite accelerating losses. The stock showed higher volatility with a 23.25 std deviation, ranging from 61.66 to 147.79.
Comparing both, Cognex delivered the highest market performance with a positive overall return, while Mesa’s stock trended downward significantly before recent partial recovery.
Target Prices
The current analyst target consensus provides a useful framework for evaluating potential price movements.
| Company | Target High | Target Low | Consensus |
|---|---|---|---|
| Cognex Corporation | 58 | 38 | 48.14 |
| Mesa Laboratories, Inc. | 83 | 83 | 83 |
Analysts expect Cognex Corporation’s stock to rise moderately above its current price of $39.76, with a consensus target near $48. Mesa Laboratories shows a consensus target slightly below its current price of $85.32, indicating limited upside.
Analyst Opinions Comparison
This section compares analysts’ ratings and grades for Cognex Corporation and Mesa Laboratories, Inc.:
Rating Comparison
CGNX Rating
- Rating: B, evaluated as Very Favorable overall.
- Discounted Cash Flow Score: Moderate at 3, indicating average valuation.
- ROE Score: Moderate at 3, showing average efficiency in profit generation.
- ROA Score: Favorable at 4, reflecting good asset utilization.
- Debt To Equity Score: Favorable at 4, indicating lower financial risk.
- Overall Score: Moderate at 3, representing balanced financial standing.
MLAB Rating
- Rating: C+, also assessed as Very Favorable overall.
- Discounted Cash Flow Score: Very Favorable at 5, suggesting strong valuation.
- ROE Score: Very Unfavorable at 1, indicating low efficiency in using equity.
- ROA Score: Very Unfavorable at 1, showing poor asset utilization.
- Debt To Equity Score: Very Unfavorable at 1, suggesting higher financial risk.
- Overall Score: Moderate at 2, reflecting generally weaker financial metrics.
Which one is the best rated?
Based strictly on the data, Cognex holds a better overall rating with a “B” and stronger scores in ROE, ROA, and debt management. Mesa excels only in discounted cash flow but has weaker scores elsewhere.
Scores Comparison
Here is a comparison of the Altman Z-Score and Piotroski Score for Cognex Corporation and Mesa Laboratories, Inc.:
Cognex Scores
- Altman Z-Score: 9.07 indicates strong financial safety, well within the safe zone.
- Piotroski Score: 7 denotes strong financial health and value potential.
Mesa Labs Scores
- Altman Z-Score: 1.36 signals financial distress, in the distress zone.
- Piotroski Score: 5 reflects average financial strength.
Which company has the best scores?
Cognex shows significantly stronger scores with a high Altman Z-Score in the safe zone and a strong Piotroski Score. Mesa Labs, by contrast, is in financial distress with only average Piotroski strength, indicating weaker financial health based on these metrics.
Grades Comparison
Here is the detailed comparison of recent grades issued by recognized grading companies for the two companies:
Cognex Corporation Grades
This table summarizes the latest grades and actions from reliable grading companies for Cognex Corporation:
| Grading Company | Action | New Grade | Date |
|---|---|---|---|
| Barclays | Maintain | Overweight | 2026-01-12 |
| Truist Securities | Maintain | Hold | 2025-12-18 |
| Goldman Sachs | Upgrade | Buy | 2025-12-16 |
| JP Morgan | Downgrade | Underweight | 2025-12-03 |
| DA Davidson | Maintain | Neutral | 2025-11-03 |
| Barclays | Maintain | Overweight | 2025-10-31 |
| Needham | Maintain | Buy | 2025-10-31 |
| Baird | Maintain | Neutral | 2025-10-31 |
| Truist Securities | Maintain | Hold | 2025-10-08 |
| Goldman Sachs | Maintain | Sell | 2025-09-16 |
Overall, Cognex’s grades show a mixed pattern with a recent upgrade to Buy by Goldman Sachs but also a downgrade to Underweight by JP Morgan, reflecting varied analyst perspectives.
Mesa Laboratories, Inc. Grades
This table summarizes the latest grades and actions from reliable grading companies for Mesa Laboratories, Inc.:
| Grading Company | Action | New Grade | Date |
|---|---|---|---|
| Wells Fargo | Maintain | Equal Weight | 2025-12-15 |
| Wells Fargo | Upgrade | Equal Weight | 2025-08-08 |
| Wells Fargo | Maintain | Underweight | 2025-05-30 |
| Evercore ISI Group | Maintain | Outperform | 2024-10-01 |
| Evercore ISI Group | Maintain | Outperform | 2024-08-06 |
| Evercore ISI Group | Maintain | Outperform | 2024-07-02 |
| Evercore ISI Group | Maintain | Outperform | 2024-04-04 |
| Evercore ISI Group | Upgrade | Outperform | 2024-01-04 |
| Evercore ISI Group | Downgrade | In Line | 2021-01-04 |
| Evercore ISI Group | Downgrade | In Line | 2021-01-03 |
Mesa Laboratories’ grades mostly indicate a positive trend with consistent Outperform ratings from Evercore ISI Group and recent upgrades by Wells Fargo to Equal Weight, suggesting stable analyst confidence.
Which company has the best grades?
Cognex Corporation has a broader range of ratings including upgrades to Buy and downgrades to Underweight, while Mesa Laboratories maintains steadier Outperform and Equal Weight grades. Mesa’s consistent positive ratings could imply more stable analyst sentiment, potentially impacting investor confidence differently than Cognex’s more mixed grades.
Strengths and Weaknesses
Below is a comparison of key strengths and weaknesses for Cognex Corporation (CGNX) and Mesa Laboratories, Inc. (MLAB) based on their recent financial and operational data.
| Criterion | Cognex Corporation (CGNX) | Mesa Laboratories, Inc. (MLAB) |
|---|---|---|
| Diversification | Moderate: Revenue mainly from Standard Products & Services (about $795M in 2024) with growing Custom Solutions segment ($119M) | Moderate: Product segment dominates ($198M in 2025) with smaller Service segment ($43M) |
| Profitability | Mixed: Positive net margin (11.6%), but ROIC (5.1%) below WACC (10.8%), indicating value destruction | Weak: Negative net margin (-0.8%) and ROIC (-1.5%), consistently shedding value |
| Innovation | Moderate: Fixed asset turnover is favorable (5.52), indicating efficient asset use for innovation | Moderate: High fixed asset turnover (7.45), but operational inefficiencies limit profits |
| Global presence | Strong: Established with diverse customer-specific solutions and standard products globally | Limited: More focused niche market, less diversified geographically |
| Market Share | Strong in machine vision industry with stable revenues near $914M | Smaller player in laboratory and biopharmaceutical devices, revenues about $242M |
Key takeaways: Cognex Corporation shows stronger market presence and profitability despite some financial inefficiencies, while Mesa Laboratories struggles with negative profitability and value destruction, highlighting higher investment risks. Both companies need to improve capital efficiency to create shareholder value.
Risk Analysis
Below is a comparison of key risks for Cognex Corporation (CGNX) and Mesa Laboratories, Inc. (MLAB) based on the latest financial and operational data for 2025-2026:
| Metric | Cognex Corporation (CGNX) | Mesa Laboratories, Inc. (MLAB) |
|---|---|---|
| Market Risk | Beta 1.52 – higher volatility; sensitive to tech sector shifts | Beta 0.89 – lower volatility, more defensive |
| Debt level | Very low debt-to-equity 0.05; strong interest coverage | High debt-to-equity 1.14; weak interest coverage (1.5x) |
| Regulatory Risk | Moderate, operates globally in manufacturing tech | Moderate to high, due to healthcare and biotech regulations |
| Operational Risk | Moderate, reliant on advanced machine vision tech | Higher, complex product lines and specialized markets |
| Environmental Risk | Low, limited direct environmental impact | Moderate, due to lab equipment and chemical use |
| Geopolitical Risk | Moderate, global supply chains and markets | Moderate, international presence but smaller scale |
In summary, Mesa Laboratories faces higher financial risk with significant debt and weaker profitability, placing it in the distress zone per Altman Z-Score (1.36). Cognex, with low leverage and a safe Altman Z-Score (9.07), shows better financial stability but has higher market risk from tech sector volatility. Regulatory and operational risks are more pronounced for Mesa due to its healthcare focus. Investors should weigh Cognex’s stronger balance sheet against Mesa’s growth potential but elevated financial and operational risks.
Which Stock to Choose?
Cognex Corporation (CGNX) shows a generally favorable income evolution with a 9.19% revenue increase in 2024, solid gross and net margins, but declining profitability over the longer term. Its financial ratios reveal a slight imbalance, with a strong current ratio and low debt, but an overall slightly unfavorable profile. The company’s rating is very favorable with a “B” grade, supported by good Altman Z-score and Piotroski scores, despite a very unfavorable economic moat indicating value destruction.
Mesa Laboratories, Inc. (MLAB) experiences favorable recent revenue and earnings growth but suffers from negative net margins and profitability overall. Its financial ratios are mostly unfavorable, marked by high debt and weak liquidity, though it has a favorable WACC and a strong discounted cash flow score. The rating stands at “C+” with moderate overall scores, a distress zone Altman Z-score, and an average Piotroski score, while also showing a very unfavorable moat due to declining returns.
Investors focused on stronger financial stability and established profitability might find Cognex’s profile more aligned with their criteria, while those who are more tolerant of risk and interested in potential recovery or growth phases might interpret Mesa Laboratories’ improving income trends and valuation metrics as worth watching. The differing income statement health, financial ratios, and ratings suggest a nuanced choice depending on individual risk tolerance and investment strategy.
Disclaimer: Investment carries a risk of loss of initial capital. The past performance is not a reliable indicator of future results. Be sure to understand risks before making an investment decision.
Go Further
I encourage you to read the complete analyses of Cognex Corporation and Mesa Laboratories, Inc. to enhance your investment decisions: