Keysight Technologies, Inc. and Cognex Corporation are leading players in the hardware and equipment industry, each specializing in cutting-edge technologies that drive automation and testing solutions. Keysight focuses on electronic design and measurement, while Cognex excels in machine vision systems for manufacturing automation. Their overlapping market presence and innovation strategies make them ideal candidates for comparison. Join me as we explore which company offers the most compelling investment opportunity in 2026.
Table of contents
Companies Overview
I will begin the comparison between Keysight Technologies and Cognex Corporation by providing an overview of these two companies and their main differences.
Keysight Technologies Overview
Keysight Technologies, Inc. delivers electronic design and test solutions across various sectors, including communications, aerospace, automotive, semiconductor, and education. With a market cap of 36B USD and 15,400 employees, Keysight offers a broad product range from electronic design automation software to test and measurement instruments. Founded in 1939 and headquartered in Santa Rosa, California, it operates globally, serving commercial, government, and defense clients.
Cognex Corporation Overview
Cognex Corporation specializes in machine vision products that automate manufacturing and distribution by capturing and analyzing visual data. Its solutions include vision software, sensors, and barcode readers, serving industries like electronics, automotive, and pharmaceuticals. With a market cap of 6.6B USD and 2,914 employees, Cognex was incorporated in 1981 and is based in Natick, Massachusetts, selling products primarily through distributors and integrators.
Key similarities and differences
Both companies operate in the technology sector under hardware, equipment, and parts industries, focusing on automation and testing solutions. Keysight emphasizes electronic design and broad test instrumentation across multiple industries, while Cognex concentrates on machine vision and image analysis for discrete manufacturing automation. Keysight’s larger market cap and workforce reflect a wider product portfolio and global reach compared to Cognex’s specialized vision systems and software offerings.
Income Statement Comparison
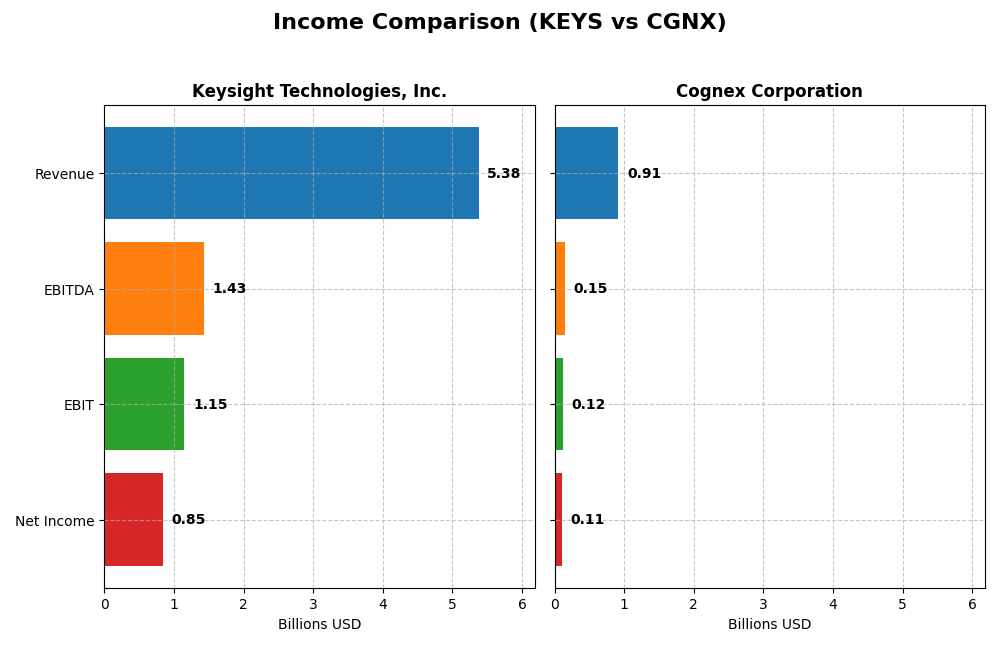
This table compares the most recent fiscal year income statement metrics of Keysight Technologies, Inc. and Cognex Corporation, highlighting key financial performance indicators.
| Metric | Keysight Technologies, Inc. | Cognex Corporation |
|---|---|---|
| Market Cap | 36B | 6.6B |
| Revenue | 5.38B | 915M |
| EBITDA | 1.43B | 148M |
| EBIT | 1.15B | 115M |
| Net Income | 846M | 106M |
| EPS | 4.9 | 0.62 |
| Fiscal Year | 2025 | 2024 |
Income Statement Interpretations
Keysight Technologies, Inc.
Keysight’s revenue showed a generally positive trend with a 7.95% growth in the most recent year and an 8.78% increase over 2021-2025. Net income, however, declined by 5.37% over the same period despite a 27.63% net margin improvement last year. Margins remain robust, with gross margin at 62.08% and EBIT margin at 21.4%, reflecting efficient cost management and solid profitability in 2025.
Cognex Corporation
Cognex experienced a 9.19% revenue increase in 2024, continuing an overall 12.76% growth since 2020. Net income declined sharply by 39.74% over the period, with net margin falling 46.56%. Despite favorable gross margin at 68.43%, recent EBIT and net margin growth were negative, highlighting challenges in maintaining profitability and efficiency in the latest fiscal year.
Which one has the stronger fundamentals?
Both companies present a favorable global income statement evaluation, but Keysight shows stronger margin stability and positive growth in key profitability metrics last year. Cognex’s revenue growth is solid, yet its significant net income and margin declines over time indicate more volatility. Keysight’s overall higher favorable percentages suggest comparatively stronger income fundamentals.
Financial Ratios Comparison
This table presents a side-by-side comparison of key financial ratios for Keysight Technologies, Inc. (KEYS) and Cognex Corporation (CGNX) based on the most recent fiscal year data available.
| Ratios | Keysight Technologies, Inc. (2025) | Cognex Corporation (2024) |
|---|---|---|
| ROE | 14.40% | 7.00% |
| ROIC | 7.98% | 5.07% |
| P/E | 37.41 | 57.90 |
| P/B | 5.39 | 4.05 |
| Current Ratio | 2.35 | 3.62 |
| Quick Ratio | 1.78 | 2.69 |
| D/E | 0.51 | 0.05 |
| Debt-to-Assets | 26.31% | 3.52% |
| Interest Coverage | 9.88 | 0 |
| Asset Turnover | 0.48 | 0.46 |
| Fixed Asset Turnover | 5.21 | 5.52 |
| Payout ratio | 0 | 49.29% |
| Dividend yield | 0% | 0.85% |
Interpretation of the Ratios
Keysight Technologies, Inc.
Keysight shows a slightly favorable ratio profile with strengths in net margin (15.74%), current (2.35) and quick ratios (1.78), and interest coverage (11.98), signaling solid liquidity and profitability. However, its high PE (37.41) and PB (5.39) ratios and low asset turnover (0.48) raise valuation and efficiency concerns. It does not pay dividends, possibly focusing on reinvestment or growth strategies.
Cognex Corporation
Cognex presents mixed ratios with favorable metrics like net margin (11.61%), low debt-to-equity (0.05) and debt-to-assets (3.52%), and infinite interest coverage, indicating strong solvency. Yet, it faces unfavorable returns on equity (7.0%), a high WACC (10.84%), and valuation multiples (PE 57.9, PB 4.05). It pays a modest dividend yield of 0.85%, though this is viewed unfavorably given its ratio context.
Which one has the best ratios?
Keysight holds a slightly favorable overall ratio stance with balanced liquidity and profitability, despite valuation concerns. Cognex, while solvent and paying dividends, shows weaker profitability and higher valuation risks, resulting in a slightly unfavorable ratio impression. The assessment favors Keysight’s more consistent operating and financial metrics over Cognex’s mixed profile.
Strategic Positioning
This section compares the strategic positioning of Keysight Technologies, Inc. and Cognex Corporation, focusing on market position, key segments, and exposure to technological disruption:
Keysight Technologies, Inc.
- Large market cap of 36B in hardware, facing diverse competitive pressures across multiple industrial sectors.
- Key segments: Communications Solutions (3.42B) and Electronic Industrial Solutions (1.56B), driving revenue diversification.
- Exposure to technological disruption through evolving electronic design automation and test solutions in varied industries.
Cognex Corporation
- Smaller 6.6B market cap, competing in machine vision automation for manufacturing and distribution.
- Key segments: Standard Products & Services (795M) and Customer Specific Solutions (119M), focused on vision systems.
- Faces disruption risk in advanced machine vision software and barcode reader technologies for automation tasks.
Keysight Technologies, Inc. vs Cognex Corporation Positioning
Keysight exhibits a diversified business model spanning communications and industrial solutions, offering broad market exposure. Cognex concentrates on machine vision and automated inspection, allowing specialization but narrower market focus. Diversification may reduce sector-specific risks, while concentration can enable deeper domain expertise.
Which has the best competitive advantage?
Both companies show very unfavorable moat status with declining ROIC trends, indicating value destruction and weakening profitability. Neither currently demonstrates a sustainable competitive advantage based on capital efficiency metrics.
Stock Comparison
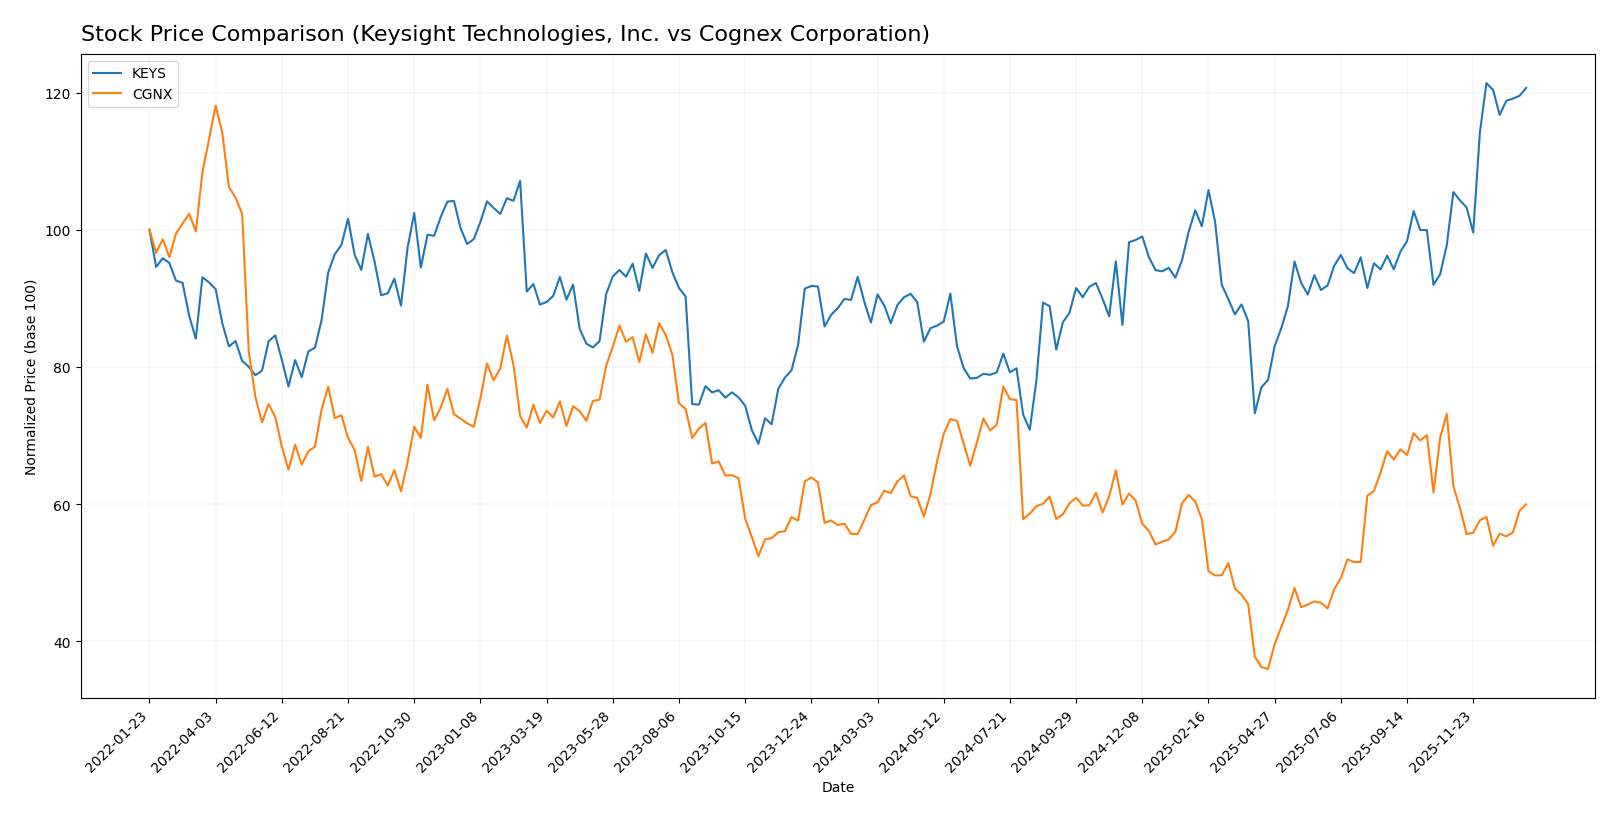
The stock price movements of Keysight Technologies, Inc. and Cognex Corporation over the past year reveal contrasting dynamics, with Keysight showing strong gains and acceleration, while Cognex exhibits near stability with decelerating momentum.
Trend Analysis
Keysight Technologies, Inc. posted a robust bullish trend over the past 12 months, with a 39.56% price increase and accelerating momentum. The stock ranged from a low of 122.87 to a high of 210.49, with high volatility indicated by an 18.51 standard deviation.
Cognex Corporation’s stock displayed a nearly neutral trend over the same period, rising just 0.18% with decelerating momentum. The price fluctuated between 23.77 and 50.98, with lower volatility reflected in a 5.92 standard deviation.
Comparing both, Keysight Technologies, Inc. delivered the highest market performance with significant gains and momentum, while Cognex remained essentially flat with slight deceleration in trend.
Target Prices
The current consensus target prices indicate moderate upside potential for both Keysight Technologies, Inc. and Cognex Corporation.
| Company | Target High | Target Low | Consensus |
|---|---|---|---|
| Keysight Technologies, Inc. | 232 | 210 | 225.13 |
| Cognex Corporation | 58 | 38 | 48.14 |
Analysts expect Keysight’s stock to rise slightly above its current price of 209.3 USD, while Cognex shows potential for a more significant increase from its current 39.63 USD. Both stocks present promising targets relative to their recent trading levels.
Analyst Opinions Comparison
This section compares analysts’ ratings and grades for Keysight Technologies, Inc. (KEYS) and Cognex Corporation (CGNX):
Rating Comparison
KEYS Rating
- Rating: B, indicating a very favorable overall evaluation.
- Discounted Cash Flow Score: Moderate score of 3, reflecting average valuation.
- ROE Score: Favorable score of 4, showing strong profit generation efficiency.
- ROA Score: Favorable score of 4, indicating effective asset utilization.
- Debt To Equity Score: Moderate score of 2, suggesting average financial risk.
- Overall Score: Moderate score of 3, reflecting balanced financial health.
CGNX Rating
- Rating: B, indicating a very favorable overall evaluation.
- Discounted Cash Flow Score: Moderate score of 3, reflecting average valuation.
- ROE Score: Moderate score of 3, showing moderate profit generation efficiency.
- ROA Score: Favorable score of 4, indicating effective asset utilization.
- Debt To Equity Score: Favorable score of 4, indicating lower financial risk.
- Overall Score: Moderate score of 3, reflecting balanced financial health.
Which one is the best rated?
Both KEYS and CGNX share the same overall rating and score of B and 3, respectively. KEYS scores higher on ROE, while CGNX has a stronger debt-to-equity position. Their ratings are comparable but emphasize different financial strengths.
Scores Comparison
The following table compares the Altman Z-Score and Piotroski Score for Keysight Technologies, Inc. (KEYS) and Cognex Corporation (CGNX):
KEYS Scores
- Altman Z-Score: 5.94, indicating a safe zone status
- Piotroski Score: 4, categorized as average
CGNX Scores
- Altman Z-Score: 9.07, indicating a safe zone status
- Piotroski Score: 7, categorized as strong
Which company has the best scores?
Based on the provided data, CGNX has both a higher Altman Z-Score and a stronger Piotroski Score compared to KEYS, indicating relatively better financial health and strength.
Grades Comparison
Here is the grades comparison between Keysight Technologies, Inc. and Cognex Corporation based on recent analyst ratings:
Keysight Technologies, Inc. Grades
Below is a summary of recent grades from recognized grading companies for Keysight Technologies, Inc.:
| Grading Company | Action | New Grade | Date |
|---|---|---|---|
| Morgan Stanley | Maintain | Equal Weight | 2025-12-17 |
| Jefferies | Maintain | Hold | 2025-12-10 |
| Baird | Maintain | Outperform | 2025-11-26 |
| Barclays | Maintain | Overweight | 2025-11-25 |
| JP Morgan | Maintain | Overweight | 2025-11-25 |
| Jefferies | Maintain | Hold | 2025-11-25 |
| Citigroup | Maintain | Buy | 2025-11-25 |
| UBS | Maintain | Buy | 2025-11-25 |
| Wells Fargo | Maintain | Overweight | 2025-11-25 |
| Susquehanna | Maintain | Positive | 2025-11-25 |
The overall trend for Keysight Technologies shows a positive to neutral stance, with multiple “Buy” and “Overweight” grades alongside some “Hold” and “Equal Weight” ratings.
Cognex Corporation Grades
Below is a summary of recent grades from recognized grading companies for Cognex Corporation:
| Grading Company | Action | New Grade | Date |
|---|---|---|---|
| Barclays | Maintain | Overweight | 2026-01-12 |
| Truist Securities | Maintain | Hold | 2025-12-18 |
| Goldman Sachs | Upgrade | Buy | 2025-12-16 |
| JP Morgan | Downgrade | Underweight | 2025-12-03 |
| DA Davidson | Maintain | Neutral | 2025-11-03 |
| Barclays | Maintain | Overweight | 2025-10-31 |
| Needham | Maintain | Buy | 2025-10-31 |
| Baird | Maintain | Neutral | 2025-10-31 |
| Truist Securities | Maintain | Hold | 2025-10-08 |
| Goldman Sachs | Maintain | Sell | 2025-09-16 |
Cognex Corporation’s grades display a mix of opinions, ranging from “Buy” and “Overweight” to “Hold,” “Neutral,” and some recent downgrades to “Underweight” and “Sell,” indicating a more cautious outlook.
Which company has the best grades?
Keysight Technologies holds the stronger overall grades, with a consensus “Buy” rating and multiple positive analyst actions. Cognex Corporation shows a more mixed consensus with a “Hold” rating and several downgrades, which may imply higher uncertainty for investors.
Strengths and Weaknesses
Below is a comparison of key strengths and weaknesses of Keysight Technologies, Inc. (KEYS) and Cognex Corporation (CGNX) based on their latest financial and operational data.
| Criterion | Keysight Technologies, Inc. (KEYS) | Cognex Corporation (CGNX) |
|---|---|---|
| Diversification | Strong diversification with two solid segments: Communications Solutions ($3.42B in 2024) and Electronic Industrial Solutions ($1.56B) | Moderate diversification with focus on Standard Products & Services ($795M) and Customer Specific Solutions ($119M) |
| Profitability | Favorable net margin at 15.74%, ROIC at 7.98% (neutral), but ROIC below WACC indicating value destruction | Favorable net margin at 11.61%, ROIC at 5.07% (neutral), but significantly below WACC, also shedding value |
| Innovation | Established in measurement solutions, moderate asset turnover hints at room for efficiency improvements | Strong in machine vision with innovative customer-specific solutions, but declining ROIC trend is a concern |
| Global presence | Large global footprint supported by diverse product groups and customer base | Global reach primarily through machine vision products, yet smaller scale than KEYS |
| Market Share | Larger market share in communication and electronic industrial sectors | Niche leader in machine vision but smaller overall scale and lower revenue base than KEYS |
In summary, both companies face challenges with declining ROIC relative to their cost of capital, signaling value erosion. Keysight shows stronger diversification and higher profitability, while Cognex operates in a more specialized niche but struggles with profitability and efficiency. Investors should weigh Keysight’s broader market presence against Cognex’s focused innovation and consider the risks tied to their profitability trends.
Risk Analysis
Below is a comparative risk overview of Keysight Technologies, Inc. (KEYS) and Cognex Corporation (CGNX) based on the most recent data available.
| Metric | Keysight Technologies, Inc. (KEYS) | Cognex Corporation (CGNX) |
|---|---|---|
| Market Risk | Beta 1.18, moderate volatility | Beta 1.52, higher volatility |
| Debt level | Debt-to-Equity 0.51 (neutral) | Debt-to-Equity 0.05 (low risk) |
| Regulatory Risk | Moderate, operates globally | Moderate, serves diverse sectors |
| Operational Risk | Complex product range, scale 15.4K employees | Smaller scale, 2.9K employees |
| Environmental Risk | Moderate, industry hardware & tech | Moderate, machine vision products |
| Geopolitical Risk | Exposure across Americas, Europe, Asia-Pacific | Global exposure, supply chain sensitive |
The most likely and impactful risks revolve around market volatility and operational complexity. Cognex’s higher beta indicates greater sensitivity to market swings, while Keysight’s broader product portfolio and larger workforce may pose operational challenges. Both companies face moderate regulatory and environmental risks typical for technology hardware sectors.
Which Stock to Choose?
Keysight Technologies, Inc. (KEYS) shows a favorable income statement with strong gross and EBIT margins, positive growth in EPS, and a current ratio of 2.35 indicating good liquidity. Its debt remains moderate, and the company holds a very favorable B rating despite some unfavorable valuation ratios and declining value creation as ROIC falls below WACC.
Cognex Corporation (CGNX) records a favorable income statement but with lower net margin and weakened EPS growth. It benefits from low debt levels and strong liquidity, reflected in a high current ratio. The rating is also very favorable B, yet the company faces unfavorable valuation multiples and a similar decline in ROIC below WACC, signaling value destruction.
Investors focused on growth and income statement strength might find Keysight’s more robust profitability and stable financial ratios appealing, while those prioritizing balance sheet safety and lower leverage could perceive Cognex’s conservative debt profile as more suitable. Both companies show challenges in value creation, suggesting a cautious interpretation of their financial health.
Disclaimer: Investment carries a risk of loss of initial capital. The past performance is not a reliable indicator of future results. Be sure to understand risks before making an investment decision.
Go Further
I encourage you to read the complete analyses of Keysight Technologies, Inc. and Cognex Corporation to enhance your investment decisions: