In the rapidly evolving technology sector, Jabil Inc. and Cognex Corporation stand out for their innovative contributions to hardware and manufacturing solutions. Jabil excels in comprehensive electronics manufacturing services, while Cognex leads in advanced machine vision systems. Both companies serve overlapping industrial markets, making their comparison essential for investors seeking growth and resilience. Join me as we explore which company offers the most compelling investment opportunity in 2026.
Table of contents
Companies Overview
I will begin the comparison between Jabil Inc. and Cognex Corporation by providing an overview of these two companies and their main differences.
Jabil Inc. Overview
Jabil Inc. operates globally in the Hardware, Equipment & Parts industry, providing comprehensive manufacturing services and solutions. The company focuses on electronics manufacturing and diversified manufacturing services, offering design, production, and product management. Jabil serves multiple sectors including 5G, automotive, healthcare, and digital print. Headquartered in Saint Petersburg, Florida, it employs 138K people and has a market cap of $25.5B.
Cognex Corporation Overview
Cognex Corporation specializes in machine vision products used to automate manufacturing and distribution processes worldwide. Its offerings include vision software, vision sensors, barcode readers, and inspection systems, serving industries like automotive, consumer electronics, and pharmaceuticals. With around 2.9K employees, the company is based in Natick, Massachusetts, and has a market cap of $6.6B, trading on NASDAQ.
Key similarities and differences
Both companies operate in the technology sector within the hardware industry but focus on distinct areas. Jabil emphasizes manufacturing services and electronic design, while Cognex concentrates on machine vision and automation products. Jabil is significantly larger in workforce and market cap, reflecting its broader manufacturing scope. Cognex, meanwhile, specializes in visual inspection and automation solutions with a smaller scale and niche market approach.
Income Statement Comparison
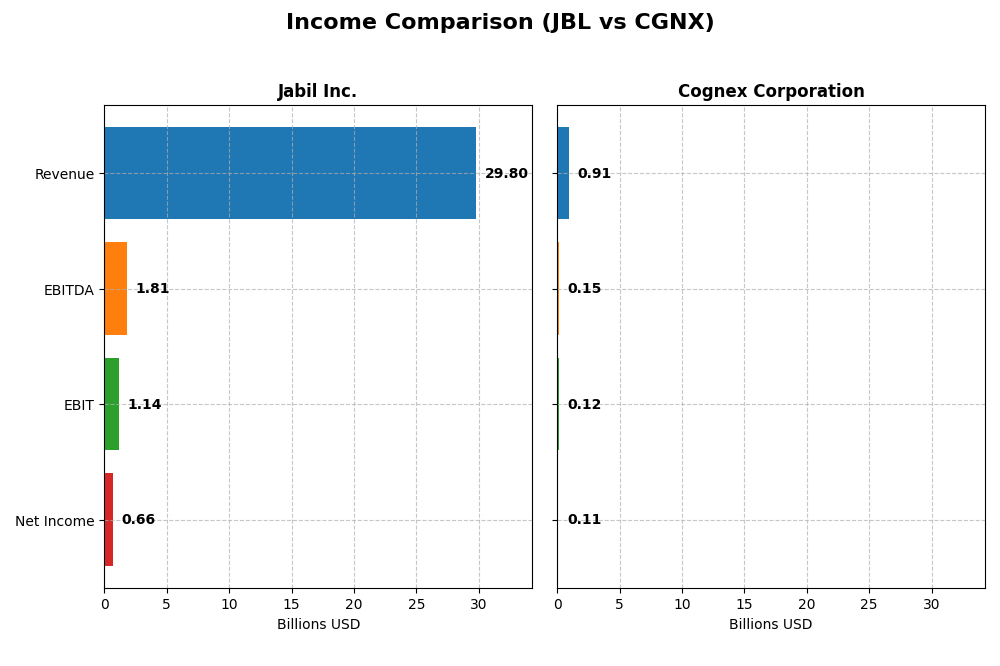
The table below compares key income statement metrics for Jabil Inc. and Cognex Corporation, reflecting their most recent fiscal year results.
| Metric | Jabil Inc. (JBL) | Cognex Corporation (CGNX) |
|---|---|---|
| Market Cap | 25.5B | 6.6B |
| Revenue | 29.8B | 915M |
| EBITDA | 1.81B | 148M |
| EBIT | 1.14B | 115M |
| Net Income | 657M | 106M |
| EPS | 6.00 | 0.62 |
| Fiscal Year | 2025 | 2024 |
Income Statement Interpretations
Jabil Inc.
Jabil’s revenue showed mixed trends from 2021 to 2025, with a slight overall growth of 1.77% but a recent year increase of 3.18%. Net income declined overall by 5.6%, with a sharp drop of 54.13% in net margin growth in 2025. Margins remained generally stable but showed unfavorable changes recently, including a 40.96% EBIT decline and a 47% EPS decrease.
Cognex Corporation
Cognex experienced favorable revenue growth of 12.76% over the period and 9.19% in the latest year. Despite this, net income fell by 39.74% overall, with a 14.13% net margin decline in 2024. The company maintains strong gross and EBIT margins above 12%, though recent EBIT and EPS growth were negative, reflecting some operational challenges.
Which one has the stronger fundamentals?
Cognex exhibits stronger fundamentals in terms of higher gross (68.43%) and EBIT margins (12.58%), and better revenue growth overall and recently. However, its net income and EPS trends are unfavorable. Jabil shows more stable margins but faces significant recent declines in profitability and net income. Overall, Cognex’s income statement evaluation is favorable, while Jabil’s is unfavorable.
Financial Ratios Comparison
This table compares the most recent financial ratios for Jabil Inc. and Cognex Corporation, providing a snapshot of their profitability, liquidity, leverage, efficiency, and dividend metrics as of their latest fiscal years.
| Ratios | Jabil Inc. (2025) | Cognex Corporation (2024) |
|---|---|---|
| ROE | 43.42% | 6.99% |
| ROIC | 16.06% | 5.07% |
| P/E | 34.14 | 57.90 |
| P/B | 14.82 | 4.05 |
| Current Ratio | 1.00 | 3.62 |
| Quick Ratio | 0.66 | 2.69 |
| D/E (Debt-to-Equity) | 2.22 | 0.05 |
| Debt-to-Assets | 18.15% | 3.52% |
| Interest Coverage | 4.84 | 0 |
| Asset Turnover | 1.61 | 0.46 |
| Fixed Asset Turnover | 9.01 | 5.52 |
| Payout Ratio | 5.48% | 49.29% |
| Dividend Yield | 0.16% | 0.85% |
Interpretation of the Ratios
Jabil Inc.
Jabil’s ratios show mixed strength with a very high return on equity (43.42%) and return on invested capital (16.06%), indicating efficient use of capital. However, concerns arise from low net margin (2.2%), high price-to-book (14.82), and debt-to-equity (2.22) ratios, alongside a weak quick ratio (0.66). The company pays a modest dividend with a low yield of 0.16%, suggesting cautious shareholder returns.
Cognex Corporation
Cognex displays strong net margin (11.61%) and excellent liquidity with a quick ratio of 2.69, supported by low debt-to-equity (0.05) and debt-to-assets (3.52%) ratios. Its return on equity (7.0%) is weak, and valuation multiples like P/E (57.9) are high. Dividends yield 0.85%, but high payout ratios may limit growth potential amid significant R&D investment.
Which one has the best ratios?
Both companies have slightly unfavorable overall ratio profiles. Jabil posts higher returns but carries more leverage and valuation concerns. Cognex benefits from lower debt and better liquidity but suffers from lower profitability and stretched valuation multiples. Neither stands out definitively as having superior financial ratios.
Strategic Positioning
This section compares the strategic positioning of Jabil Inc. and Cognex Corporation, focusing on Market position, Key segments, and Exposure to technological disruption:
Jabil Inc.
- Large market cap of 25B, facing competitive pressure in hardware and manufacturing services.
- Diversified segments including Electronics Manufacturing Services and Diversified Manufacturing Services across multiple industries.
- Exposure through electronics design and production services, with involvement in 5G, cloud, and connected devices industries.
Cognex Corporation
- Smaller market cap of 6.6B, competing in machine vision hardware and software.
- Focused on machine vision products and software for manufacturing automation and tracking.
- Exposure via advanced patented vision tools and deep learning vision software, innovating in automation.
Jabil Inc. vs Cognex Corporation Positioning
Jabil adopts a diversified approach with broad manufacturing services across many industries, providing scale advantages. Cognex concentrates on specialized machine vision solutions, enabling focused innovation but narrower market reach. Both face distinct competitive challenges based on their segment focus and scale.
Which has the best competitive advantage?
Jabil demonstrates a very favorable moat with growing ROIC and value creation, indicating a durable competitive advantage. Cognex shows a very unfavorable moat with declining ROIC, suggesting value destruction and weaker competitive positioning.
Stock Comparison
The stock prices of Jabil Inc. and Cognex Corporation over the past year exhibit distinct dynamics, with Jabil showing strong gains and acceleration, while Cognex remains mostly flat with recent deceleration.
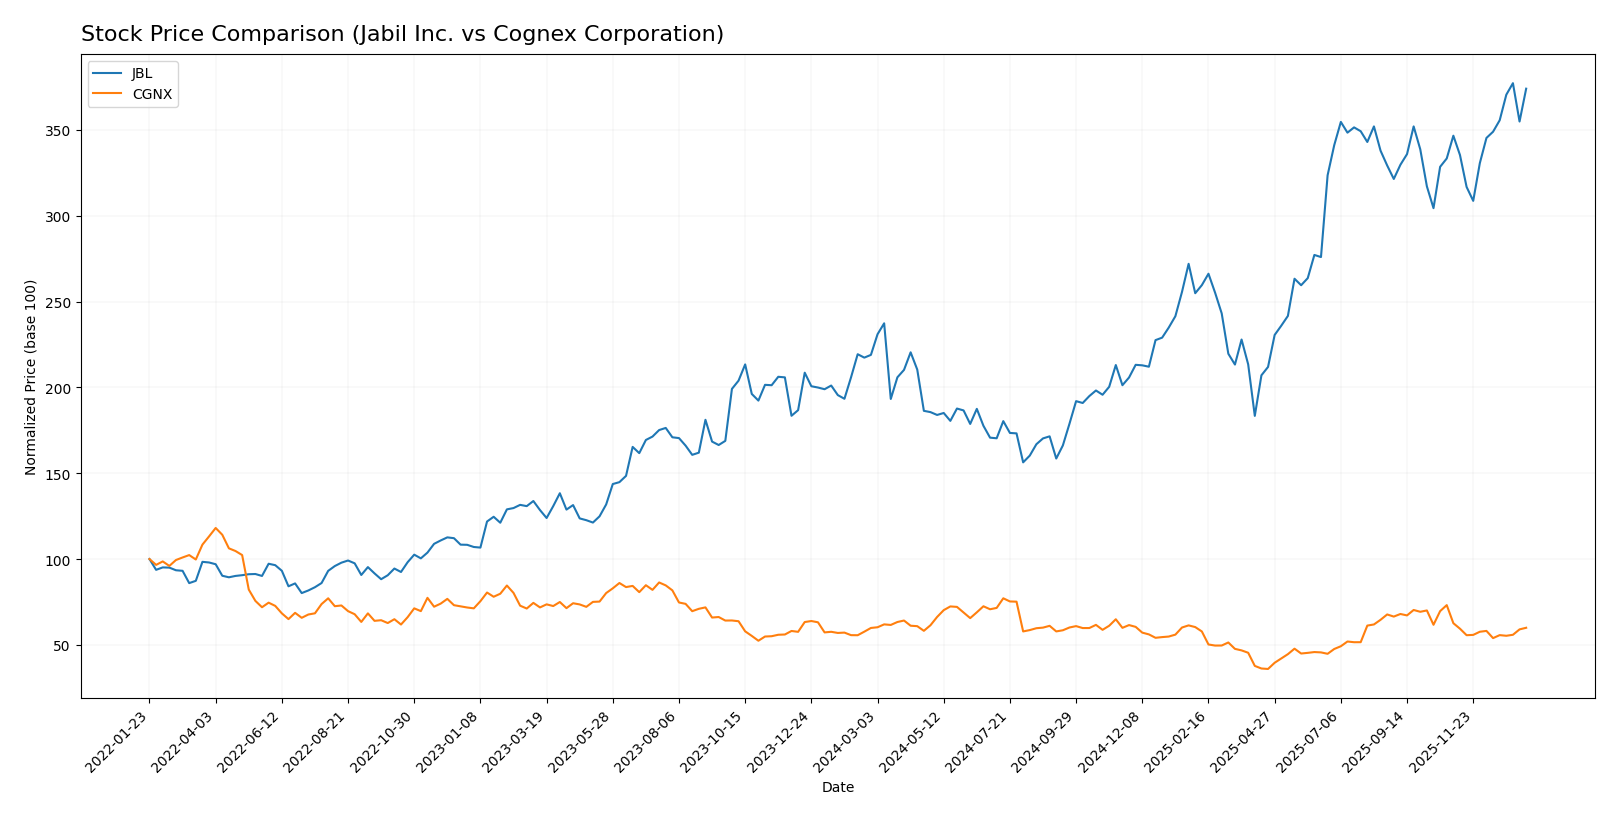
Trend Analysis
Jabil Inc. (JBL) experienced a bullish trend over the past 12 months with a 70.84% price increase, marked by accelerating momentum and notable volatility, ranging from 99.62 to 240.39.
Cognex Corporation (CGNX) showed a near-neutral overall trend with a 0.18% price rise over 12 months but faced recent deceleration and a slight decline of 4.25% since November 2025.
Comparing both stocks, Jabil delivered the highest market performance with a significant bullish trend, while Cognex’s price remained relatively stable with minor recent weakness.
Target Prices
The current analyst consensus indicates a positive outlook for both Jabil Inc. and Cognex Corporation.
| Company | Target High | Target Low | Consensus |
|---|---|---|---|
| Jabil Inc. | 283 | 244 | 260.5 |
| Cognex Corporation | 58 | 38 | 48.14 |
Analysts expect Jabil’s stock to appreciate from the current price of $238.35 toward the consensus of $260.5, while Cognex’s consensus target of $48.14 suggests upside potential from its current $39.63 price.
Analyst Opinions Comparison
This section compares analysts’ ratings and grades for Jabil Inc. and Cognex Corporation:
Rating Comparison
JBL Rating
- Rating: B- indicating a very favorable overall evaluation.
- Discounted Cash Flow Score: Moderate score of 3, showing balanced future cash flow outlook.
- ROE Score: Very favorable score of 5, showing high efficiency in generating shareholder profit.
- ROA Score: Moderate score of 3, indicating average asset utilization effectiveness.
- Debt To Equity Score: Very unfavorable score of 1, suggesting higher financial risk.
- Overall Score: Moderate score of 3, reflecting balanced overall financial standing.
CGNX Rating
- Rating: B indicating a very favorable overall evaluation.
- Discounted Cash Flow Score: Moderate score of 3, reflecting similar future cash flow prospects.
- ROE Score: Moderate score of 3, indicating average efficiency in shareholder profit generation.
- ROA Score: Favorable score of 4, showing better asset utilization compared to JBL.
- Debt To Equity Score: Favorable score of 4, indicating lower financial risk and stronger balance sheet.
- Overall Score: Moderate score of 3, reflecting balanced overall financial standing.
Which one is the best rated?
Based strictly on provided data, CGNX holds a better rating (B) than JBL (B-). CGNX scores better in ROA and Debt to Equity, while JBL excels in ROE. Overall scores are equal, indicating comparable general financial health.
Scores Comparison
Here is a comparison of the Altman Z-Score and Piotroski Score for Jabil Inc. and Cognex Corporation:
JBL Scores
- Altman Z-Score: 3.09, in the safe zone indicating low bankruptcy risk.
- Piotroski Score: 8, very strong financial health suggesting good value.
CGNX Scores
- Altman Z-Score: 9.07, in the safe zone indicating very low bankruptcy risk.
- Piotroski Score: 7, strong financial health indicating solid fundamentals.
Which company has the best scores?
Cognex has a significantly higher Altman Z-Score than Jabil, indicating a stronger financial stability against bankruptcy risk. However, Jabil’s Piotroski Score is higher, suggesting slightly stronger financial health in terms of profitability and efficiency.
Grades Comparison
Here is a detailed comparison of the latest grades from recognized financial institutions for both companies:
Jabil Inc. Grades
The table below summarizes Jabil Inc.’s recent grades from established grading companies:
| Grading Company | Action | New Grade | Date |
|---|---|---|---|
| JP Morgan | Maintain | Overweight | 2025-12-18 |
| UBS | Maintain | Neutral | 2025-12-18 |
| Barclays | Maintain | Overweight | 2025-12-18 |
| B of A Securities | Maintain | Buy | 2025-12-10 |
| Barclays | Maintain | Overweight | 2025-09-26 |
| B of A Securities | Maintain | Buy | 2025-09-26 |
| JP Morgan | Maintain | Overweight | 2025-07-17 |
| B of A Securities | Maintain | Buy | 2025-06-20 |
| UBS | Maintain | Neutral | 2025-06-18 |
| JP Morgan | Maintain | Overweight | 2025-06-18 |
Jabil Inc. shows a consistent pattern of “Overweight” and “Buy” ratings with no downgrades, indicating steady confidence from analysts.
Cognex Corporation Grades
The table below presents Cognex Corporation’s recent grades from recognized grading firms:
| Grading Company | Action | New Grade | Date |
|---|---|---|---|
| Barclays | Maintain | Overweight | 2026-01-12 |
| Truist Securities | Maintain | Hold | 2025-12-18 |
| Goldman Sachs | Upgrade | Buy | 2025-12-16 |
| JP Morgan | Downgrade | Underweight | 2025-12-03 |
| DA Davidson | Maintain | Neutral | 2025-11-03 |
| Barclays | Maintain | Overweight | 2025-10-31 |
| Needham | Maintain | Buy | 2025-10-31 |
| Baird | Maintain | Neutral | 2025-10-31 |
| Truist Securities | Maintain | Hold | 2025-10-08 |
| Goldman Sachs | Maintain | Sell | 2025-09-16 |
Cognex Corporation’s grades show more variability, including upgrades, downgrades, and some sell ratings, reflecting mixed analyst sentiment.
Which company has the best grades?
Jabil Inc. has a more stable and generally positive grading profile with repeated “Overweight” and “Buy” ratings, whereas Cognex Corporation’s grades are more mixed, including downgrades and sell ratings. This suggests differing analyst confidence levels, which may affect investor perception and risk assessment.
Strengths and Weaknesses
Below is a comparative table highlighting key strengths and weaknesses of Jabil Inc. (JBL) and Cognex Corporation (CGNX) based on their most recent performance metrics and business profiles.
| Criterion | Jabil Inc. (JBL) | Cognex Corporation (CGNX) |
|---|---|---|
| Diversification | Highly diversified across Connected Living, Digital Commerce, Intelligent Infrastructure, and Regulated Industries, with revenues exceeding $30B | Limited diversification, mainly focused on Standard Products and Customer Specific Solutions, under $1B revenue |
| Profitability | Favorable ROIC of 16.06% with growing trend, strong ROE at 43.42%, but low net margin of 2.2% | Net margin strong at 11.61%, but ROIC modest at 5.07% and declining trend; ROE low at 7.0% |
| Innovation | Moderate innovation focus, reflected in segment diversity and asset turnover ratios | Innovation centered on vision systems and automation; however, profitability and ROIC decline signal challenges |
| Global presence | Extensive global footprint supporting high revenue scale and asset turnover | Smaller global scale with less revenue and lower asset turnover |
| Market Share | Significant presence in EMS and DMS markets with steady revenue growth | Niche market player in machine vision, but struggling with value creation and profitability |
Key takeaways: Jabil Inc. shows a strong competitive moat with diversified revenues and improving profitability metrics, despite some margin pressure. Cognex faces challenges with declining ROIC and value destruction, signaling higher investment risk despite niche positioning and decent net margins. Caution is advised when considering Cognex, while Jabil appears a more value-creating candidate for portfolios.
Risk Analysis
Below is a comparison of key risks for Jabil Inc. (JBL) and Cognex Corporation (CGNX) based on the most recent financial and operational data from 2025 and 2024 respectively.
| Metric | Jabil Inc. (JBL) | Cognex Corporation (CGNX) |
|---|---|---|
| Market Risk | Beta 1.25, moderate volatility | Beta 1.52, higher volatility |
| Debt level | Debt-to-Equity 2.22 (high risk) | Debt-to-Equity 0.05 (low risk) |
| Regulatory Risk | Moderate, operates globally in tech | Moderate, industrial automation sector |
| Operational Risk | Large scale manufacturing, complex supply chain | Smaller scale, focus on machine vision tech |
| Environmental Risk | Manufacturing emissions and waste | Lower environmental footprint |
| Geopolitical Risk | Exposure to global supply chain disruptions | Moderate, less exposed to global manufacturing |
Jabil faces higher debt and operational risks due to its large, complex manufacturing operations and leverage, which could impact financial stability in volatile markets. Cognex’s higher market volatility and valuation multiples pose risks, but its low debt and strong financial health mitigate balance sheet concerns. Geopolitical disruptions remain a common concern, particularly affecting Jabil’s global supply chain.
Which Stock to Choose?
Jabil Inc. (JBL) shows modest income growth with a 3.18% revenue increase in 2025 but faces unfavorable profit and margin declines. Its financial ratios reveal strong return on equity (43.4%) and invested capital (16.1%), though debt levels and valuation metrics are less favorable. The company maintains a very favorable rating (B-) and demonstrates a very favorable moat with increasing ROIC above WACC, indicating durable value creation.
Cognex Corporation (CGNX) exhibits favorable income metrics with a 9.19% revenue growth and strong gross and EBIT margins but suffers from declining net income and EPS over the medium term. Financial ratios highlight solid liquidity and low debt, yet mixed profitability ratios and high valuation multiples. CGNX holds a very favorable rating (B) but shows a very unfavorable moat due to declining ROIC below WACC, signaling value erosion.
Investors focused on durable value and profitability might see Jabil’s strong ROIC and improving competitive advantage as appealing, while those prioritizing revenue growth and liquidity could find Cognex’s favorable income statement and low leverage attractive despite its profitability challenges. The choice may thus depend on whether an investor favors stable value creation or growth with liquidity strength.
Disclaimer: Investment carries a risk of loss of initial capital. The past performance is not a reliable indicator of future results. Be sure to understand risks before making an investment decision.
Go Further
I encourage you to read the complete analyses of Jabil Inc. and Cognex Corporation to enhance your investment decisions: