Garmin Ltd. and Cognex Corporation are two key players in the hardware and equipment sector, each driving innovation in distinct yet overlapping markets. Garmin specializes in GPS technology and wearable devices across fitness, outdoor, aviation, marine, and automotive segments, while Cognex leads in machine vision systems that automate manufacturing and inspection processes. This comparison reveals which company offers the most compelling investment opportunity in today’s evolving tech landscape. Let’s explore their potential together.

Table of contents
Companies Overview
I will begin the comparison between Garmin Ltd. and Cognex Corporation by providing an overview of these two companies and their main differences.
Garmin Ltd. Overview
Garmin Ltd. is a technology company headquartered in Switzerland, specializing in designing and manufacturing a broad range of wireless devices. Its product portfolio spans fitness watches, outdoor adventure gadgets, aviation avionics, marine electronics, and automotive navigation systems. Garmin serves a global market, including the Americas, Asia Pacific, Europe, the Middle East, and Africa, leveraging an extensive network of retailers and online platforms.
Cognex Corporation Overview
Cognex Corporation, based in the United States, focuses on machine vision technology to automate manufacturing and distribution processes worldwide. Its products include vision software, sensors, and barcode readers used across industries such as consumer electronics, automotive, pharmaceuticals, and food and beverage. Cognex markets its solutions through distributors and integrators, emphasizing advanced visual inspection and robotic guidance.
Key similarities and differences
Both Garmin and Cognex operate in the technology sector within the hardware and equipment industry, offering specialized products that enhance automation and user functionality. Garmin has a broader consumer electronics scope with diverse segments including fitness and automotive, while Cognex concentrates on industrial machine vision and automation software. Their market caps and employee counts also differ significantly, reflecting varying scales and operational focuses.
Income Statement Comparison
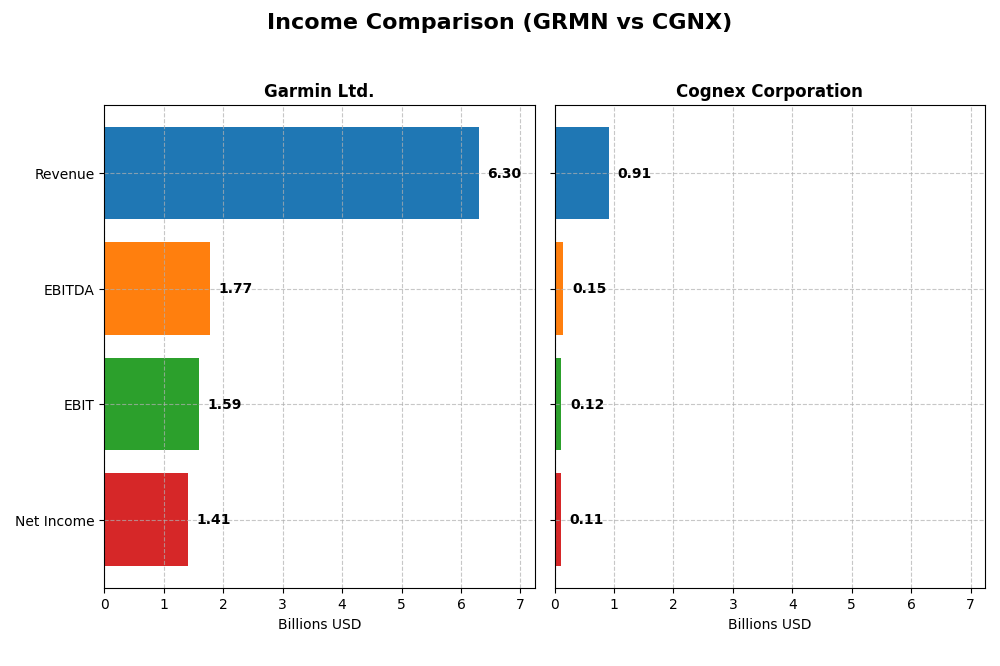
The table below compares key income statement metrics for Garmin Ltd. and Cognex Corporation for the fiscal year 2024, providing a snapshot of their financial performance.
| Metric | Garmin Ltd. (GRMN) | Cognex Corporation (CGNX) |
|---|---|---|
| Market Cap | 41.2B | 6.6B |
| Revenue | 6.30B | 915M |
| EBITDA | 1.77B | 148M |
| EBIT | 1.59B | 115M |
| Net Income | 1.41B | 106M |
| EPS | 7.35 | 0.62 |
| Fiscal Year | 2024 | 2024 |
Income Statement Interpretations
Garmin Ltd.
Garmin Ltd. experienced a strong revenue growth of 50.41% from 2020 to 2024, with net income rising 42.24% over the same period. Gross and EBIT margins remained favorable, around 58.7% and 25.31%, respectively. In 2024, revenue surged 20.44% year-over-year, while EBIT expanded by 45.95%, although net margin declined slightly by 9.13%.
Cognex Corporation
Cognex Corporation’s revenue increased 12.76% from 2020 to 2024, but net income dropped nearly 40%, reflecting margin pressures. The gross margin held favorably at 68.43%, yet EBIT margin was lower at 12.58%. In 2024, revenue grew 9.19%, but EBIT and net margin declined by 6.22% and 14.13%, respectively, signaling some operational challenges.
Which one has the stronger fundamentals?
Garmin shows stronger fundamentals with higher revenue and net income growth, supported by robust gross and EBIT margins. Its consistent margin performance and significant EBIT growth contrast with Cognex’s shrinking net income and declining margins. Despite both companies having a favorable overall income statement opinion, Garmin’s financial trends appear more resilient and balanced.
Financial Ratios Comparison
The table below presents key financial ratios for Garmin Ltd. and Cognex Corporation based on their most recent fiscal year data, offering a comparative overview for investors.
| Ratios | Garmin Ltd. (GRMN) | Cognex Corporation (CGNX) |
|---|---|---|
| ROE | 18.0% | 7.0% |
| ROIC | 16.3% | 5.1% |
| P/E | 28.5 | 57.9 |
| P/B | 5.13 | 4.05 |
| Current Ratio | 3.54 | 3.62 |
| Quick Ratio | 2.56 | 2.69 |
| D/E | 0.021 | 0.046 |
| Debt-to-Assets | 1.7% | 3.5% |
| Interest Coverage | 0 (not reported) | 0 (not reported) |
| Asset Turnover | 0.65 | 0.46 |
| Fixed Asset Turnover | 4.49 | 5.52 |
| Payout Ratio | 40.6% | 49.3% |
| Dividend Yield | 1.42% | 0.85% |
Interpretation of the Ratios
Garmin Ltd.
Garmin shows mostly favorable ratios in 2024, with strong net margin at 22.41%, ROE of 17.98%, and ROIC of 16.28%, indicating efficient profitability and capital use. However, the company’s P/E of 28.5 and P/B of 5.13 are less attractive, as is the high current ratio of 3.54, which may imply excess liquidity. Garmin pays dividends with a neutral yield of 1.42%, supported by solid free cash flow coverage but warrants monitoring for sustainability.
Cognex Corporation
Cognex exhibits mixed results, with a favorable net margin of 11.61% but a weak ROE at 7% and a neutral ROIC of 5.07%, reflecting moderate profitability. Its cost of capital at 10.84% and P/E of 57.9 are unfavorable, alongside a high current ratio of 3.62. The dividend yield is low at 0.85% and marked unfavorable; shareholder returns appear modest given the elevated valuation and cautious cash flow metrics.
Which one has the best ratios?
Garmin presents a more favorable overall financial profile, with higher profitability, better capital efficiency, and a balanced dividend yield. Cognex’s ratios reflect more concerns, including weaker returns and higher valuation multiples. Thus, Garmin’s ratios are generally stronger while Cognex’s show a slightly unfavorable risk-return balance.
Strategic Positioning
This section compares the strategic positioning of Garmin Ltd. and Cognex Corporation, focusing on market position, key segments, and exposure to technological disruption:
Garmin Ltd.
- Large market cap of 41B USD with moderate competitive pressure in hardware and equipment sector.
- Diverse segments including Fitness, Outdoor, Marine, Aviation, and Automotive Mobile driving revenue growth.
- Exposure to technological disruption through integration of wearable tech, avionics, and embedded computing systems.
Cognex Corporation
- Smaller market cap of 6.6B USD, facing higher beta and competitive pressure in hardware sector.
- Concentrated in machine vision products and software targeting manufacturing and distribution automation.
- Faces disruption risks in advanced vision software and deep learning applications in automation.
Garmin Ltd. vs Cognex Corporation Positioning
Garmin adopts a diversified approach across multiple product segments, benefiting from broad market exposure but facing complexity in managing diverse technologies. Cognex focuses on specialized machine vision solutions, offering concentrated expertise but higher vulnerability to shifts in automation technology.
Which has the best competitive advantage?
Garmin demonstrates a favorable economic moat with stable profitability and value creation, while Cognex shows a very unfavorable moat with declining returns, indicating Garmin currently holds the stronger competitive advantage.
Stock Comparison
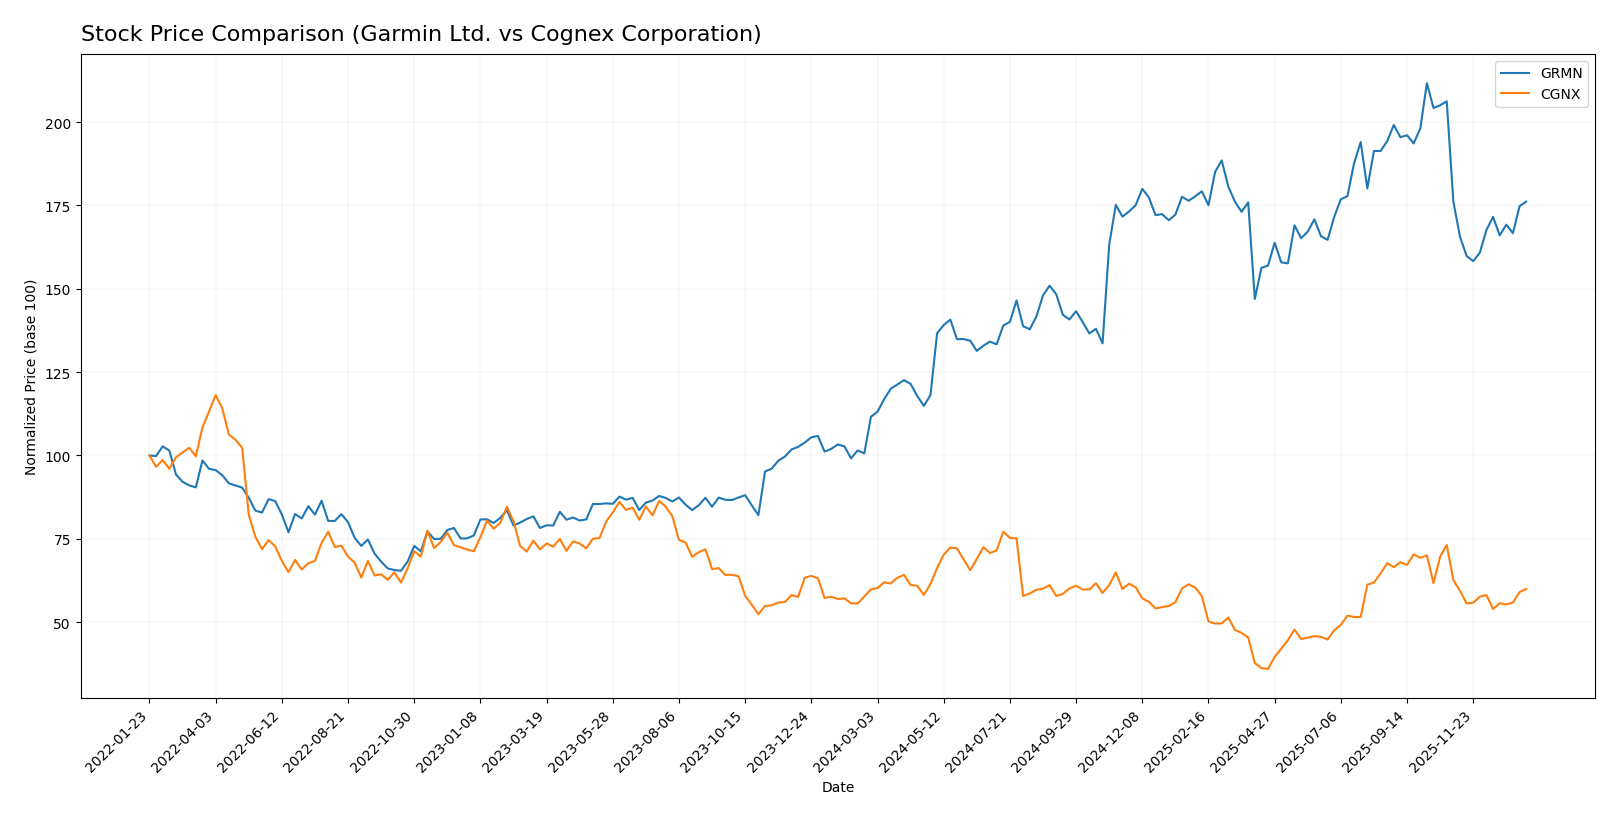
The past year saw Garmin Ltd. (GRMN) exhibit a strong bullish trend with significant price appreciation and accelerating momentum, while Cognex Corporation (CGNX) showed a near-neutral overall trend with decelerating gains amid moderate volatility.
Trend Analysis
Garmin Ltd. (GRMN) recorded a 57.86% price increase over the past 12 months, indicating a bullish trend with acceleration. The stock’s price ranged between 135.51 and 257.06, featuring high volatility (std deviation 29.55).
Cognex Corporation (CGNX) posted a marginal 0.18% price increase over the past year, classified as bullish but with deceleration. The stock showed lower volatility (std deviation 5.92) and fluctuated between 23.77 and 50.98.
Comparing both, Garmin Ltd. delivered the highest market performance with a strong upward trend, while Cognex’s performance remained nearly flat with decelerating momentum.
Target Prices
Analysts provide a mixed but cautiously optimistic target consensus for Garmin Ltd. and Cognex Corporation.
| Company | Target High | Target Low | Consensus |
|---|---|---|---|
| Garmin Ltd. | 310 | 193 | 237 |
| Cognex Corporation | 58 | 38 | 48.14 |
For Garmin Ltd., the consensus target price of 237 USD suggests a moderate upside from the current 213.93 USD, while Cognex Corporation’s target consensus at 48.14 USD indicates potential growth above its current 39.63 USD trading price.
Analyst Opinions Comparison
This section compares analysts’ ratings and grades for Garmin Ltd. and Cognex Corporation:
Rating Comparison
Garmin Ltd. Rating
- Rating: A- rated as Very Favorable by analysts.
- Discounted Cash Flow Score: Moderate score of 3 indicating neutral valuation based on cash flows.
- ROE Score: Favorable score of 4 reflecting efficient profit generation from shareholders’ equity.
- ROA Score: Very Favorable score of 5 showing excellent asset utilization to generate earnings.
- Debt To Equity Score: Favorable score of 4 indicating a relatively strong balance sheet.
- Overall Score: Favorable score of 4 reflecting solid overall financial health.
Cognex Corporation Rating
- Rating: B also rated Very Favorable by analysts.
- Discounted Cash Flow Score: Moderate score of 3 showing similar valuation consideration.
- ROE Score: Moderate score of 3 indicating average efficiency in generating shareholder profit.
- ROA Score: Favorable score of 4, good but below Garmin’s asset efficiency.
- Debt To Equity Score: Favorable score of 4, comparable financial risk profile.
- Overall Score: Moderate score of 3 indicating a decent but less strong overall financial state.
Which one is the best rated?
Garmin Ltd. holds a higher overall score (4 vs. 3) and stronger ROE and ROA scores compared to Cognex Corporation. Both have the same debt to equity score, but Garmin’s rating grade (A-) is superior to Cognex’s (B).
Scores Comparison
Here is a comparison of Garmin Ltd. and Cognex Corporation based on their financial scores:
Garmin Ltd. Scores
- Altman Z-Score: 14.62, indicating a safe zone with very low bankruptcy risk.
- Piotroski Score: 5, categorized as average financial strength.
Cognex Corporation Scores
- Altman Z-Score: 9.07, also in the safe zone, indicating low bankruptcy risk.
- Piotroski Score: 7, showing strong financial strength.
Which company has the best scores?
Both companies are in the safe zone for bankruptcy risk according to the Altman Z-Score, but Cognex has a higher Piotroski Score, indicating stronger financial health compared to Garmin’s average score.
Grades Comparison
The following tables present the latest grades from recognized financial institutions for Garmin Ltd. and Cognex Corporation:
Garmin Ltd. Grades
The table below shows recent grades assigned by established analysts for Garmin Ltd.
| Grading Company | Action | New Grade | Date |
|---|---|---|---|
| Tigress Financial | Maintain | Strong Buy | 2025-12-19 |
| Longbow Research | Upgrade | Buy | 2025-12-03 |
| Barclays | Maintain | Underweight | 2025-10-30 |
| Morgan Stanley | Maintain | Underweight | 2025-10-30 |
| Tigress Financial | Maintain | Strong Buy | 2025-09-30 |
| Morgan Stanley | Maintain | Underweight | 2025-09-19 |
| Morgan Stanley | Maintain | Underweight | 2025-07-31 |
| Barclays | Maintain | Underweight | 2025-07-31 |
| JP Morgan | Maintain | Neutral | 2025-07-17 |
| JP Morgan | Maintain | Neutral | 2025-05-01 |
Overall, Garmin Ltd.’s grades show a mixed pattern with strong buy signals from Tigress Financial contrasted by consistent underweight ratings from Barclays and Morgan Stanley.
Cognex Corporation Grades
Presented below are the most recent grades from reputable analysts on Cognex Corporation.
| Grading Company | Action | New Grade | Date |
|---|---|---|---|
| Barclays | Maintain | Overweight | 2026-01-12 |
| Truist Securities | Maintain | Hold | 2025-12-18 |
| Goldman Sachs | Upgrade | Buy | 2025-12-16 |
| JP Morgan | Downgrade | Underweight | 2025-12-03 |
| DA Davidson | Maintain | Neutral | 2025-11-03 |
| Barclays | Maintain | Overweight | 2025-10-31 |
| Needham | Maintain | Buy | 2025-10-31 |
| Baird | Maintain | Neutral | 2025-10-31 |
| Truist Securities | Maintain | Hold | 2025-10-08 |
| Goldman Sachs | Maintain | Sell | 2025-09-16 |
Cognex Corporation’s grades tend to lean positive with multiple buy and overweight ratings, although some hold and underweight grades indicate a degree of caution among analysts.
Which company has the best grades?
Cognex Corporation has generally received more favorable grades, including several buy and overweight ratings, compared to Garmin Ltd., which shows a split between strong buy and underweight opinions. This divergence may affect investor sentiment and portfolio allocation strategies differently for each stock.
Strengths and Weaknesses
Below is a comparison table highlighting the key strengths and weaknesses of Garmin Ltd. (GRMN) and Cognex Corporation (CGNX) based on recent financial and strategic data.
| Criterion | Garmin Ltd. (GRMN) | Cognex Corporation (CGNX) |
|---|---|---|
| Diversification | Strongly diversified across Automotive Mobile, Aviation, Fitness, Marine, and Outdoor segments with revenues up to $6.6B in 2024 | Less diversified, mainly split between Customer Specific Solutions and Standard Products with total revenue around $0.9B in 2024 |
| Profitability | High profitability: 22.4% net margin, 17.98% ROE, ROIC 16.3% (favorable) | Moderate profitability: 11.6% net margin, 7.0% ROE (unfavorable), ROIC 5.1% (neutral) |
| Innovation | Consistent investments in fitness and outdoor tech, steady ROIC trend (neutral) | Innovation challenged by declining ROIC and profitability, ROIC trend strongly negative |
| Global presence | Strong global footprint across multiple sectors | More niche market presence, focused on machine vision and automation |
| Market Share | Leading in several segments such as fitness and outdoor navigation | Smaller market share in industrial vision systems |
Key takeaways: Garmin’s diverse product portfolio and strong profitability provide a favorable investment profile with stable competitive advantages. Conversely, Cognex faces challenges with declining returns and profitability, indicating higher risk despite niche specialization.
Risk Analysis
Below is a comparison table of key risks for Garmin Ltd. (GRMN) and Cognex Corporation (CGNX) based on the latest available data from 2024.
| Metric | Garmin Ltd. (GRMN) | Cognex Corporation (CGNX) |
|---|---|---|
| Market Risk | Moderate (Beta 1.013, stable tech sector exposure) | Higher (Beta 1.519, more volatile) |
| Debt Level | Very Low (Debt/Equity 0.02, Debt/Assets 1.69%) | Low (Debt/Equity 0.05, Debt/Assets 3.52%) |
| Regulatory Risk | Moderate (Global hardware compliance requirements) | Moderate (Regulations in automation and AI sectors) |
| Operational Risk | Moderate (Diverse product lines, global supply chain) | Moderate (Reliance on manufacturing automation markets) |
| Environmental Risk | Moderate (Sustainability efforts in manufacturing) | Moderate (Energy use in production, e-waste concerns) |
| Geopolitical Risk | Moderate (Swiss-based with global sales) | Moderate to High (US-based, exposed to trade tensions) |
Garmin’s risks are generally moderate, with very low debt minimizing financial risk. Cognex faces higher market and geopolitical risks, driven by its higher beta and US operational exposure. Both companies must manage regulatory and operational challenges in evolving tech landscapes.
Which Stock to Choose?
Garmin Ltd. (GRMN) shows strong income growth with a 50.41% revenue increase over five years and favorable profitability metrics including a 22.41% net margin. Its financial ratios are mostly favorable, supported by low debt levels and a very favorable rating of A-. Garmin’s ROIC exceeds WACC by 7.77%, indicating value creation and stable profitability.
Cognex Corporation (CGNX) exhibits more modest income growth at 12.76% over five years and a lower net margin of 11.61%. Financial ratios are mixed with a slightly unfavorable global evaluation and moderate rating of B. The company’s ROIC falls below WACC by 5.77%, signaling value destruction and declining profitability.
For investors prioritizing consistent profitability and financial stability, Garmin’s strong rating and favorable income and ratio evaluations may appear more aligned with a quality or value investing profile. Conversely, those with a tolerance for higher risk and a focus on potential growth might interpret Cognex’s situation differently, given its mixed financial signals and recent performance trends.
Disclaimer: Investment carries a risk of loss of initial capital. The past performance is not a reliable indicator of future results. Be sure to understand risks before making an investment decision.
Go Further
I encourage you to read the complete analyses of Garmin Ltd. and Cognex Corporation to enhance your investment decisions: