Home > Comparison > Technology > FTV vs CGNX
The strategic rivalry between Fortive Corporation and Cognex Corporation shapes the trajectory of the technology hardware sector. Fortive operates as a diversified industrial technology conglomerate with broad hardware and software solutions. Cognex specializes in machine vision systems, focusing on automation and inspection technologies. This analysis pits Fortive’s scale and diversification against Cognex’s niche innovation to identify which offers a superior risk-adjusted return for a balanced portfolio.
Table of contents
Companies Overview
Fortive and Cognex dominate the industrial technology sector with cutting-edge hardware and software solutions.
Fortive Corporation: Diverse Industrial Technology Leader
Fortive drives revenue through professional and engineered products spanning software and hardware for reliability, calibration, and healthcare. Its 2026 strategy emphasizes expanding intelligent operating solutions and precision technologies across manufacturing, healthcare, and energy sectors. Fortive’s broad portfolio underpins its competitive advantage in delivering integrated, mission-critical tools worldwide.
Cognex Corporation: Machine Vision Automation Specialist
Cognex generates revenue by providing machine vision products that automate manufacturing and distribution via advanced software and sensors. In 2026, it focuses on enhancing VisionPro and deep learning vision software to serve industries like consumer electronics and automotive. Cognex’s specialization in visual inspection and barcode reading sharpens its niche in industrial automation.
Strategic Collision: Similarities & Divergences
Both companies pursue hardware-driven tech solutions but differ in scope—Fortive embraces a diversified industrial platform, while Cognex sharpens its edge in machine vision software. Their primary battleground is industrial automation, yet Fortive’s broad ecosystem contrasts with Cognex’s focused innovation. These distinctions create distinct investment profiles: Fortive offers scale and diversity, Cognex delivers specialized growth potential.
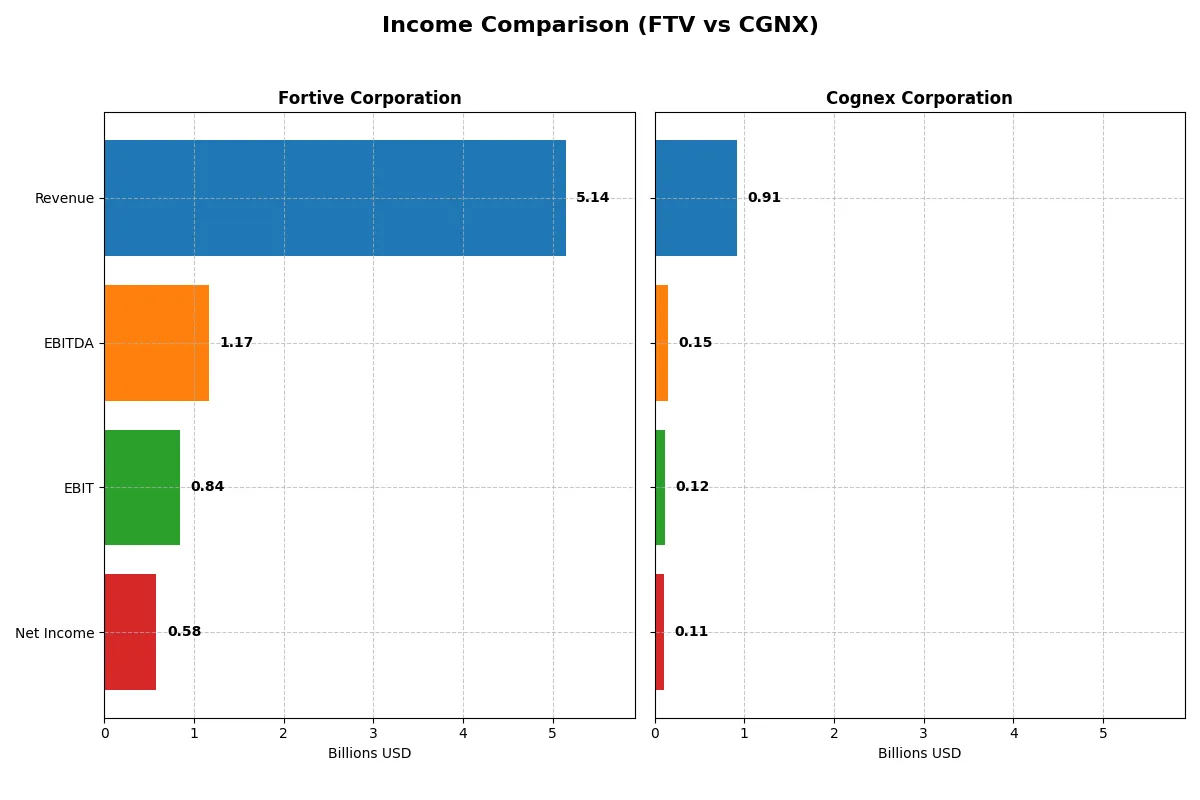
Income Statement Comparison
This table dissects the core profitability and scalability of both corporate engines to reveal who dominates the bottom line:
| Metric | Fortive Corporation (FTV) | Cognex Corporation (CGNX) |
|---|---|---|
| Revenue | 5.14B | 914.5M |
| Cost of Revenue | 2.01B | 288.7M |
| Operating Expenses | 2.23B | 510.7M |
| Gross Profit | 3.13B | 625.8M |
| EBITDA | 1.17B | 147.8M |
| EBIT | 843.4M | 115.1M |
| Interest Expense | 120.5M | 0 |
| Net Income | 579.2M | 106.2M |
| EPS | 1.75 | 0.62 |
| Fiscal Year | 2025 | 2024 |
Income Statement Analysis: The Bottom-Line Duel
This income statement comparison exposes which company operates more efficiently and converts revenue into profit with greater effectiveness.
Fortive Corporation Analysis
Fortive’s revenue shows a decline from $6.23B in 2024 to $5.14B in 2025, dragging net income down from $833M to $579M. Despite this, its gross margin remains strong at 60.96%, and net margin holds a healthy 11.26%. The 2025 results reveal weakening momentum, reflected in a 15.73% net margin contraction over the year.
Cognex Corporation Analysis
Cognex reports revenue growth from $838M in 2023 to $915M in 2024, improving top-line momentum. Gross margin excels at 68.43%, though net income declined to $106M from $113M prior year. Its net margin of 11.61% is solid, but a 14.13% net margin drop signals margin pressure despite sales gains.
Margin Strength vs. Revenue Resilience
Fortive has a larger revenue base but faces declining sales and profitability, while Cognex grows revenue but contends with shrinking net income. Fortive’s higher gross margin and better absolute net income position it as the fundamental winner, though Cognex’s growth profile may attract investors favoring expansion over scale.
Financial Ratios Comparison
These vital ratios act as a diagnostic tool to expose the underlying fiscal health, valuation premiums, and capital efficiency of the companies compared below:
| Ratios | Fortive Corporation (FTV) | Cognex Corporation (CGNX) |
|---|---|---|
| ROE | 8.98% | 7.00% |
| ROIC | 7.44% | 5.07% |
| P/E | 30.16 | 57.90 |
| P/B | 2.71 | 4.05 |
| Current Ratio | 0.71 | 3.62 |
| Quick Ratio | 0.58 | 2.69 |
| D/E (Debt/Equity) | 0.50 | 0.05 |
| Debt-to-Assets | 27.31% | 3.52% |
| Interest Coverage | 7.54 | 0 (not reported) |
| Asset Turnover | 0.44 | 0.46 |
| Fixed Asset Turnover | 19.06 | 5.52 |
| Payout Ratio | 15.92% | 49.29% |
| Dividend Yield | 0.53% | 0.85% |
| Fiscal Year | 2025 | 2024 |
Efficiency & Valuation Duel: The Vital Signs
Ratios form the company’s DNA, unveiling hidden risks and operational excellence behind headline figures.
Fortive Corporation
Fortive posts a modest 9% ROE, trailing ideal profitability benchmarks, while its net margin of 11.26% signals decent operational control. The stock trades at a stretched 30.16 P/E, suggesting premium valuation despite neutral ROIC versus WACC. Dividend yield is low at 0.53%, indicating limited immediate shareholder returns but steady reinvestment in R&D for growth.
Cognex Corporation
Cognex shows a weaker 7% ROE but a slightly higher net margin of 11.61%, reflecting efficient cost management. Its valuation is notably expensive with a 57.9 P/E and 4.05 P/B, highlighting market optimism. The company maintains a 0.85% dividend yield, balancing returns with substantial R&D spend above 15%, fueling innovation and future expansion.
Premium Valuation vs. Operational Safety
Fortive offers more balanced profitability with reasonable growth reinvestment, while Cognex carries a heavier valuation premium despite weaker returns. Risk-averse investors may prefer Fortive’s steadier metrics, whereas those seeking growth might tolerate Cognex’s stretched multiples. Each profile suits distinct risk-reward appetites.
Which one offers the Superior Shareholder Reward?
I see Fortive (FTV) delivers a modest 0.53% dividend yield with a conservative 16% payout, well covered by free cash flow. Buybacks are steady but less aggressive. Cognex (CGNX) yields 0.85% but pays nearly 49% of earnings in dividends, squeezing reinvestment. CGNX’s buybacks are minimal. FTV balances dividends and buybacks sustainably, supporting long-term value. CGNX’s higher yield carries risk from a stretched payout and pricey valuation (P/E ~58). I conclude Fortive offers a more attractive, durable total shareholder return profile for 2026 investors.
Comparative Score Analysis: The Strategic Profile
The radar chart reveals the fundamental DNA and trade-offs of Fortive Corporation and Cognex Corporation, highlighting their strategic financial strengths and vulnerabilities:
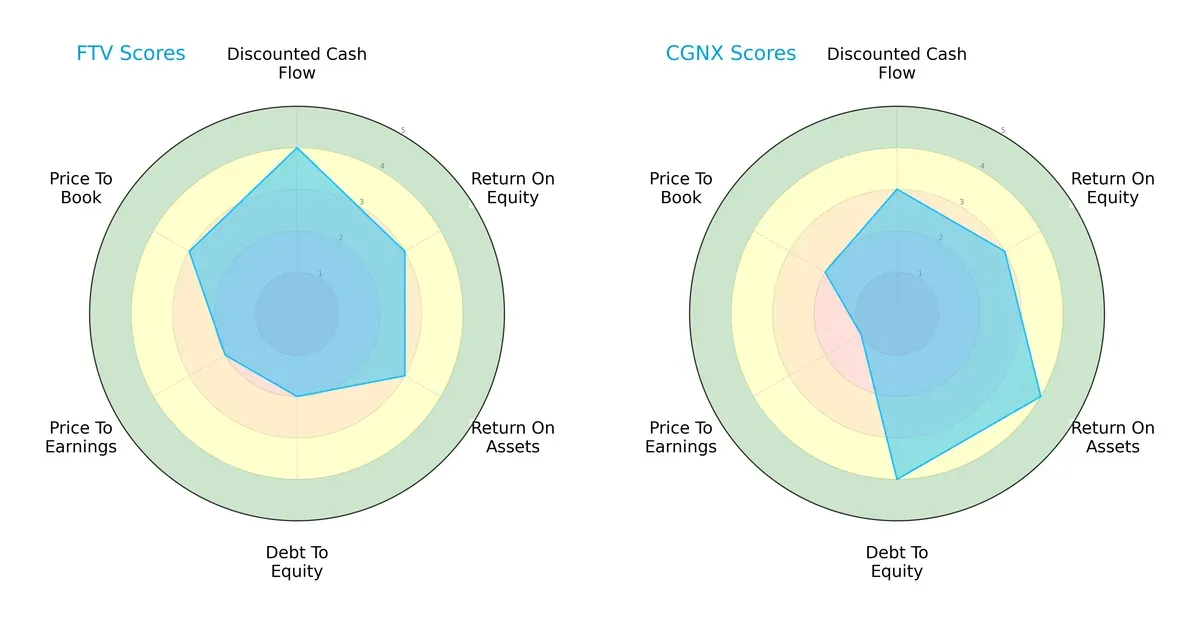
Fortive shows a stronger discounted cash flow (DCF) score at 4 versus Cognex’s 3, indicating better valuation from future cash flows. Cognex excels in return on assets (4) and debt-to-equity (4), reflecting superior asset efficiency and balance sheet strength. Fortive’s weaker debt-to-equity (2) and price-to-earnings (2) scores expose financial risk and valuation concerns. Fortive presents a balanced profile but leans on cash flow advantages, while Cognex relies on operational efficiency and conservative leverage.
Bankruptcy Risk: Solvency Showdown
The Altman Z-Score gap between Fortive (3.58) and Cognex (9.25) signals differing solvency profiles in this cycle:
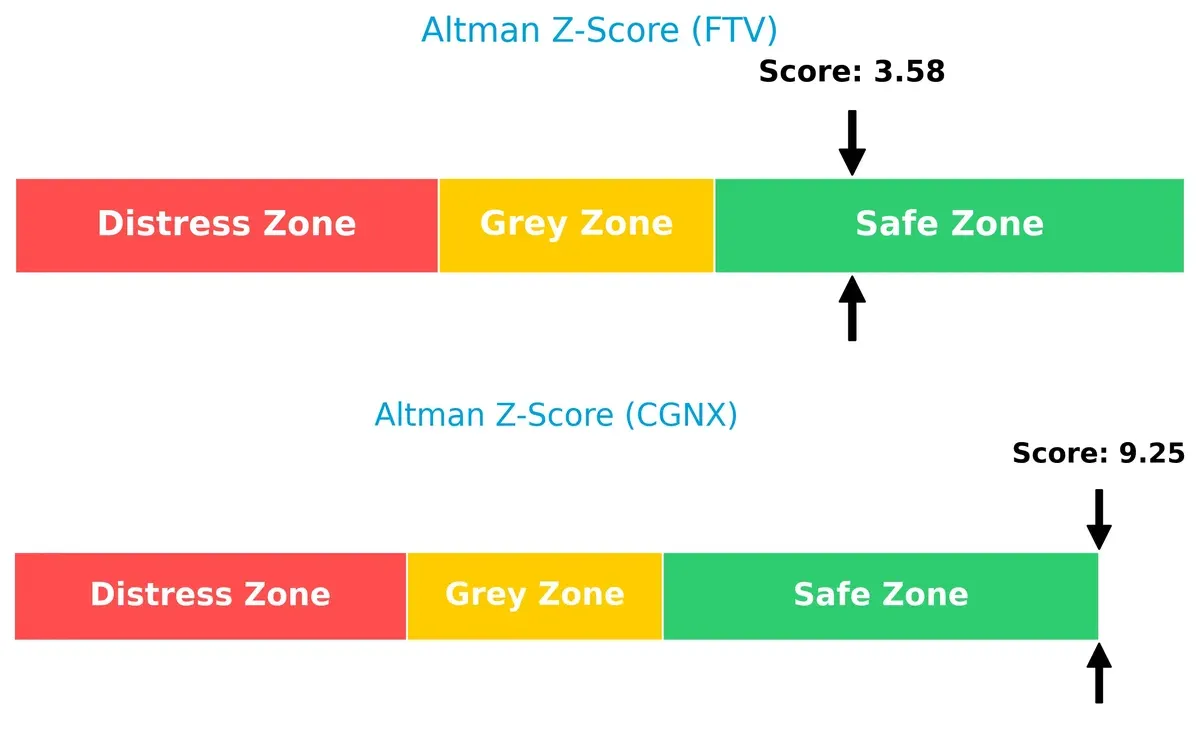
Both firms reside safely above the distress threshold, but Cognex’s exceptionally high Z-score suggests a fortress-like balance sheet, greatly reducing bankruptcy risk. Fortive remains solvent but with a narrower margin, warranting vigilance in economic downturns.
Financial Health: Quality of Operations
Fortive and Cognex each score 7 on the Piotroski F-Score, indicating strong internal financial health:
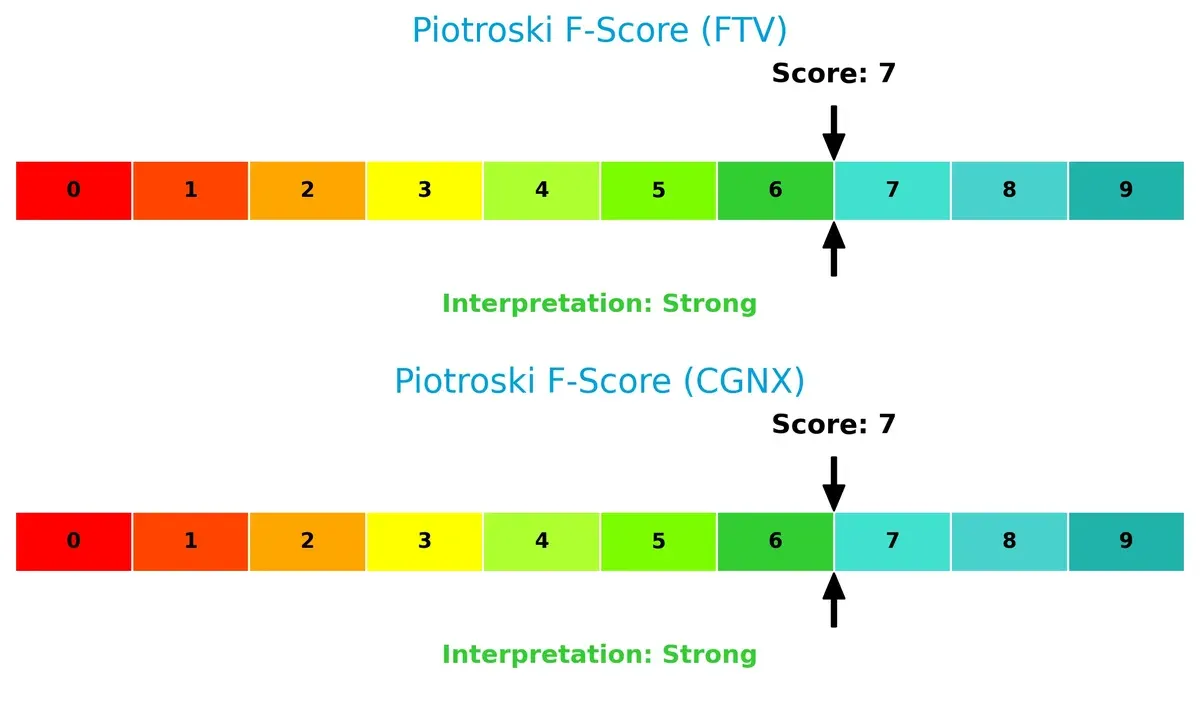
Both companies demonstrate robust profitability, liquidity, and operational efficiency. No red flags emerge in their internal metrics, implying solid foundations for sustained performance. This parity suggests investors can weigh other factors like valuation and leverage for final decisions.
How are the two companies positioned?
This section dissects Fortive and Cognex’s operational DNA by comparing revenue distribution and internal dynamics. The goal is to confront their economic moats and identify which offers the most resilient competitive advantage today.
Revenue Segmentation: The Strategic Mix
This visual comparison dissects how Fortive Corporation and Cognex Corporation diversify their income streams and where their primary sector bets lie:
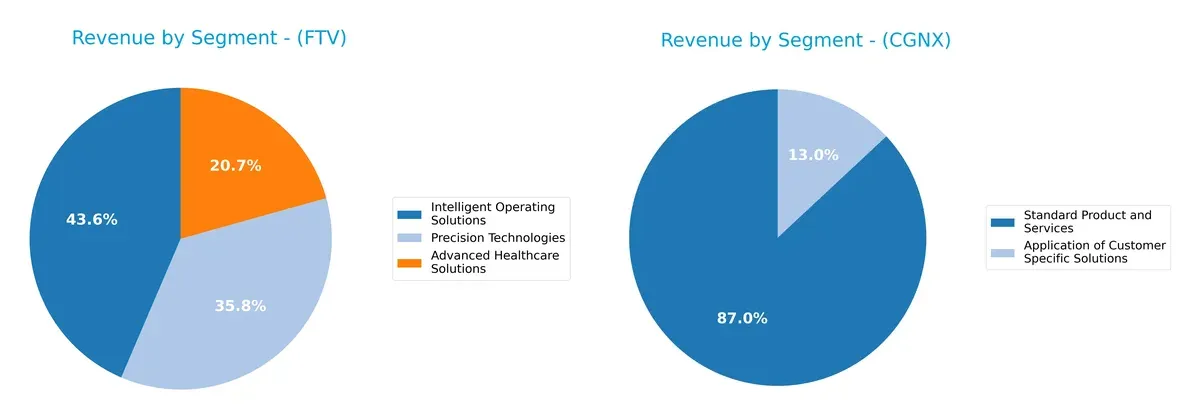
Fortive anchors its revenue in three sizable segments: Intelligent Operating Solutions at $2.7B, Precision Technologies at $2.2B, and Advanced Healthcare Solutions at $1.3B. This balanced mix signals a strategic hedge against sector-specific risks. Cognex, by contrast, pivots heavily on Standard Product and Services with $795M, supported modestly by Customer Specific Solutions at $119M, revealing higher concentration risk but strong niche dominance. Fortive’s ecosystem lock-in contrasts with Cognex’s focused product reliance.
Strengths and Weaknesses Comparison
This table compares the Strengths and Weaknesses of Fortive Corporation and Cognex Corporation:
Fortive Corporation Strengths
- Diversified revenue streams across Advanced Healthcare, Intelligent Operating, and Precision Technologies
- Favorable net margin at 11.26%
- Strong debt management with debt-to-assets at 27.31%
- High fixed asset turnover at 19.06 indicating efficient asset use
- Significant U.S. market presence with $3.37B revenue
- Balanced global presence including China and other countries
Cognex Corporation Strengths
- Favorable net margin at 11.61%
- Strong liquidity with quick ratio at 2.69
- Very low debt-to-assets at 3.52%, signaling low financial risk
- Infinite interest coverage showing robust ability to cover interest expenses
- Diversified geographic presence across Americas, Europe, and Asia
- Focused product segments with Standard Products dominating at $795M
Fortive Corporation Weaknesses
- Low current and quick ratios (0.71 and 0.58) suggesting liquidity concerns
- Unfavorable ROE at 8.98% below typical benchmark
- PE ratio high at 30.16, indicating possible overvaluation risk
- Asset turnover low at 0.44, showing less efficient use of assets
- Dividend yield low at 0.53%
- Limited innovation metrics disclosed
Cognex Corporation Weaknesses
- Unfavorable WACC at 10.93%, increasing cost of capital
- High PE ratio at 57.9, signaling elevated valuation
- Unfavorable PB at 4.05, above typical industry averages
- Current ratio high at 3.62, which might indicate inefficient asset use
- Unfavorable ROE at 7.0% below sector norms
- Dividend yield low at 0.85%
Fortive’s broad diversification and asset efficiency contrast with Cognex’s strong liquidity and low leverage. Both face valuation and profitability challenges, affecting strategic priorities.
The Moat Duel: Analyzing Competitive Defensibility
A structural moat is the only safeguard for long-term profits against relentless competitive pressure and market disruption:
Fortive Corporation: Diversified Industrial Software & Tools Moat
Fortive’s moat stems from its broad portfolio of industrial software and professional tools, delivering margin stability and a growing ROIC trend despite recent revenue declines. Expansion into connected reliability tools in 2026 could deepen this moat.
Cognex Corporation: Specialized Machine Vision Software Moat
Cognex relies on patented machine vision technology, a narrower but deep moat contrasting Fortive’s diversified base. However, declining ROIC and profitability challenge its competitive edge. Opportunities lie in advancing deep learning vision software to disrupt new markets.
Verdict: Diversification vs. Specialization in Moat Resilience
Fortive’s wider moat benefits from diverse end markets and improving profitability, while Cognex’s specialization faces shrinking returns and rising risks. I see Fortive better positioned to defend and grow its market share in 2026.
Which stock offers better returns?
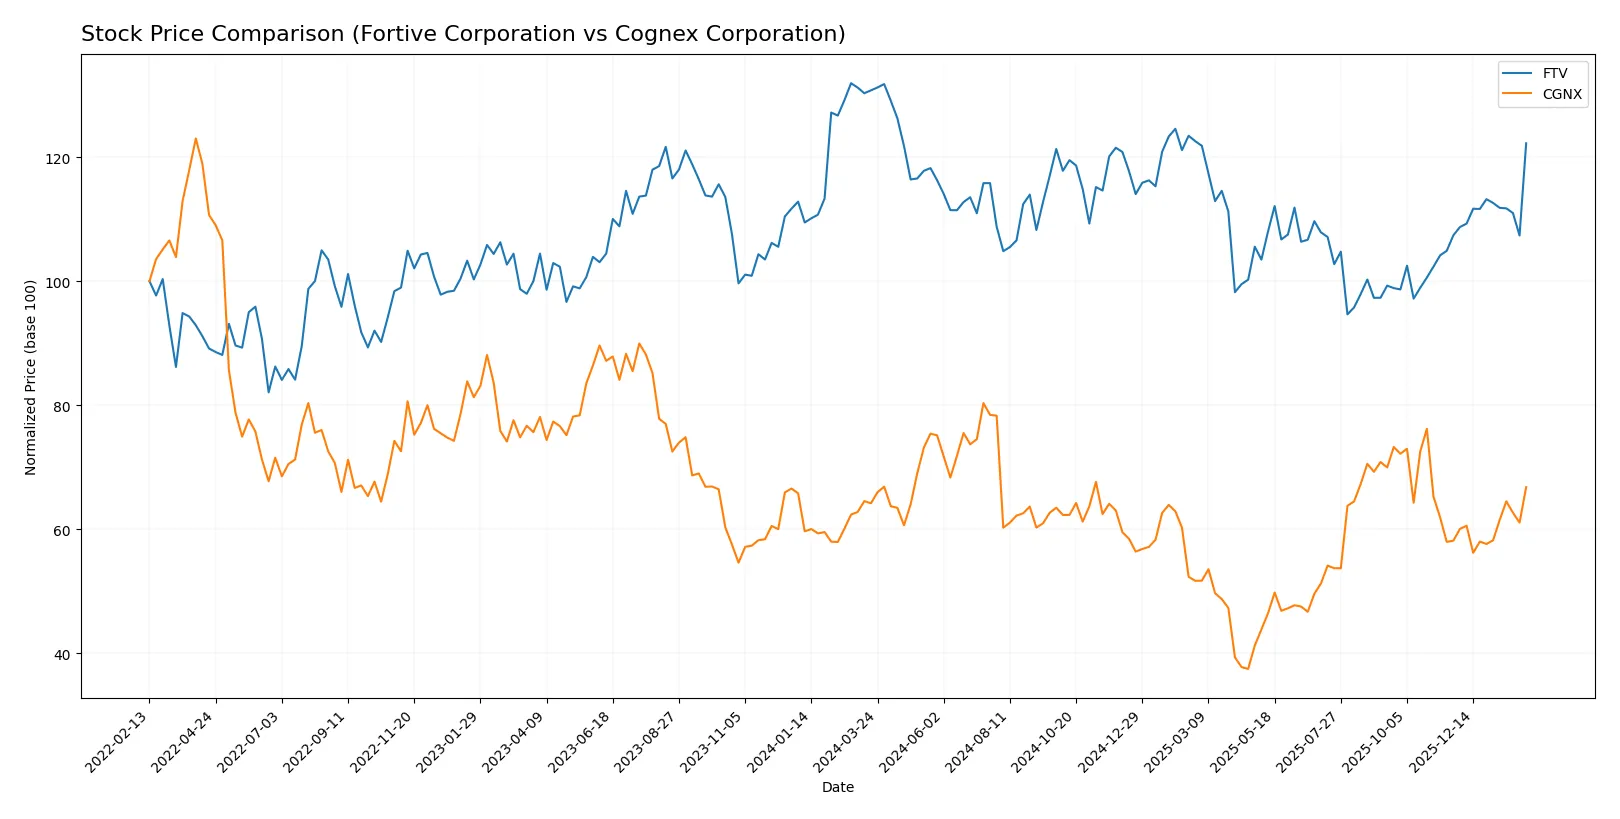
The past year shows contrasting price dynamics: Fortive Corporation declined overall but gained recently, while Cognex Corporation maintained steady growth with accelerating momentum.
Trend Comparison
Fortive Corporation’s stock declined 6.53% over the past 12 months, marking a bearish trend with accelerating downward pressure. It reached a high of 64.82 and a low of 46.55, with a recent rebound of 13.82%.
Cognex Corporation’s stock rose 4.05% over the same period, sustaining a bullish trend backed by acceleration. It recorded a high of 50.98 and a low of 23.77, with a recent gain of 14.85%.
Cognex Corporation outperformed Fortive over the year, delivering positive overall returns compared to Fortive’s decline, despite both showing strong recent rallies.
Target Prices
Analysts present a balanced target consensus for Fortive Corporation and Cognex Corporation, reflecting cautious optimism.
| Company | Target Low | Target High | Consensus |
|---|---|---|---|
| Fortive Corporation | 51 | 70 | 59.83 |
| Cognex Corporation | 38 | 58 | 48.14 |
Fortive’s target consensus slightly undercuts its current price of 60.12, suggesting moderate upside risk. Cognex’s consensus at 48.14 exceeds its 42.37 price, indicating potential growth expectations.

Don’t Let Luck Decide Your Entry Point
Optimize your entry points with our advanced ProRealTime indicators. You’ll get efficient buy signals with precise price targets for maximum performance. Start outperforming now!
How do institutions grade them?
The following summarizes recent institutional grades for Fortive Corporation and Cognex Corporation:
Fortive Corporation Grades
This table details recent grades assigned by reputable financial institutions for Fortive Corporation.
| Grading Company | Action | New Grade | Date |
|---|---|---|---|
| Wells Fargo | Maintain | Equal Weight | 2026-02-05 |
| RBC Capital | Maintain | Sector Perform | 2026-02-05 |
| Citigroup | Maintain | Neutral | 2026-02-05 |
| JP Morgan | Downgrade | Underweight | 2026-01-16 |
| Mizuho | Downgrade | Underperform | 2026-01-05 |
Cognex Corporation Grades
This table presents recent grades from established institutions for Cognex Corporation.
| Grading Company | Action | New Grade | Date |
|---|---|---|---|
| Barclays | Maintain | Overweight | 2026-01-12 |
| Truist Securities | Maintain | Hold | 2025-12-18 |
| Goldman Sachs | Upgrade | Buy | 2025-12-16 |
| JP Morgan | Downgrade | Underweight | 2025-12-03 |
Which company has the best grades?
Cognex shows stronger recent upgrades, including a Buy from Goldman Sachs and consistent Overweight ratings from Barclays. Fortive holds mostly Neutral to Underperform grades, signaling more cautious sentiment. Investors may perceive Cognex as having better growth potential based on these grades.
Risks specific to each company
The following categories identify critical pressure points and systemic threats facing Fortive Corporation and Cognex Corporation in the 2026 market environment:
1. Market & Competition
Fortive Corporation
- Operates in diverse industrial and healthcare sectors, facing broad competitive pressures.
Cognex Corporation
- Focuses on machine vision with niche specialization, but exposed to rapid tech innovation risks.
2. Capital Structure & Debt
Fortive Corporation
- Moderate leverage with debt-to-assets at 27.3%, interest coverage strong at 7x.
Cognex Corporation
- Very low leverage, debt-to-assets only 3.5%, virtually no interest burden.
3. Stock Volatility
Fortive Corporation
- Beta near market average at 1.03, implying typical volatility for sector.
Cognex Corporation
- Higher beta at 1.53, indicating above-average price swings and investor risk.
4. Regulatory & Legal
Fortive Corporation
- Exposure to global industrial and healthcare regulations; compliance complexity high.
Cognex Corporation
- Faces regulatory scrutiny mainly in technology and export controls, with evolving standards.
5. Supply Chain & Operations
Fortive Corporation
- Complex global supply chain in manufacturing and software; potential disruption risks.
Cognex Corporation
- Relies on advanced components for vision systems; supply shortages could impair production.
6. ESG & Climate Transition
Fortive Corporation
- Increasing focus on sustainability in industrial segments; moderate ESG risk.
Cognex Corporation
- ESG considerations rising, particularly related to energy-intensive tech manufacturing.
7. Geopolitical Exposure
Fortive Corporation
- US-based with global markets; moderate exposure to trade tensions and tariffs.
Cognex Corporation
- Also US-based but with higher sensitivity to Asia-Pacific market fluctuations and trade policies.
Which company shows a better risk-adjusted profile?
Fortive’s key risk lies in its stretched liquidity ratios, with current and quick ratios below 1, signaling potential short-term financial stress. Cognex’s most impactful risk is its high stock volatility, reflected in a beta of 1.53, which may deter risk-averse investors. Despite Cognex’s higher valuation multiples and some unfavorable ratios, its very low leverage and strong Altman Z-score at 9.25 place it in a safer financial zone. Fortive’s moderate leverage and weaker liquidity create more caution. Overall, Cognex shows a better risk-adjusted profile due to its stronger balance sheet and lower bankruptcy risk, despite market volatility. The recent surge in Cognex’s share price (+7.3% change) underlines investor appetite but also raises valuation concerns.
Final Verdict: Which stock to choose?
Fortive’s superpower lies in its operational resilience and improving profitability despite recent revenue hiccups. Its growing return on invested capital signals potential for value creation, but a low current ratio is a point of vigilance. It suits investors targeting aggressive growth with an appetite for short-term volatility.
Cognex commands a strategic moat through its specialized vision technology and strong balance sheet, offering more stability than Fortive. Its wide economic moat is challenged by declining ROIC and a rich valuation, making it a candidate for GARP investors who seek steady innovation with moderate risk.
If you prioritize operational momentum and value creation potential, Fortive presents a compelling scenario due to its improving profitability metrics. However, if you seek financial stability and a durable competitive edge, Cognex offers better stability despite its valuation premium. Each fits distinct investor profiles navigating growth versus risk trade-offs.
Disclaimer: Investment carries a risk of loss of initial capital. The past performance is not a reliable indicator of future results. Be sure to understand risks before making an investment decision.
Go Further
I encourage you to read the complete analyses of Fortive Corporation and Cognex Corporation to enhance your investment decisions: