In the dynamic landscape of technology hardware, Fabrinet and Cognex Corporation stand out as key players with distinct yet overlapping capabilities. Fabrinet excels in precision optical and electro-mechanical manufacturing, while Cognex leads in machine vision systems that automate manufacturing processes. Both companies innovate to meet evolving industrial demands, making their comparison crucial for investors seeking growth and stability. This article will help you decide which company holds the most promise for your investment portfolio.

Table of contents
Companies Overview
I will begin the comparison between Fabrinet and Cognex Corporation by providing an overview of these two companies and their main differences.
Fabrinet Overview
Fabrinet specializes in optical packaging and precision manufacturing services across North America, Asia-Pacific, and Europe. The company focuses on advanced optical and electro-mechanical capabilities including process design, supply chain management, and testing. It serves original equipment manufacturers in optical communications, industrial lasers, automotive components, and medical devices, positioning itself as a key player in the hardware and equipment sector.
Cognex Corporation Overview
Cognex Corporation develops machine vision products designed to automate manufacturing and distribution processes worldwide. Its solutions include advanced vision software, sensors, and barcode readers used across industries such as consumer electronics, automotive, pharmaceuticals, and food and beverage. Headquartered in Massachusetts, Cognex operates in the technology sector, emphasizing automation through visual data capture and analysis.
Key similarities and differences
Both Fabrinet and Cognex operate in the hardware and equipment industry, focusing on technology-driven manufacturing solutions. Fabrinet centers on optical and electro-mechanical manufacturing services, while Cognex specializes in machine vision and automation software. Fabrinet’s global footprint contrasts with Cognex’s emphasis on vision-based inspection and identification systems, highlighting distinct approaches within the same sector.
Income Statement Comparison
The table below presents a side-by-side comparison of the most recent fiscal year income statement figures for Fabrinet and Cognex Corporation, highlighting key financial metrics.
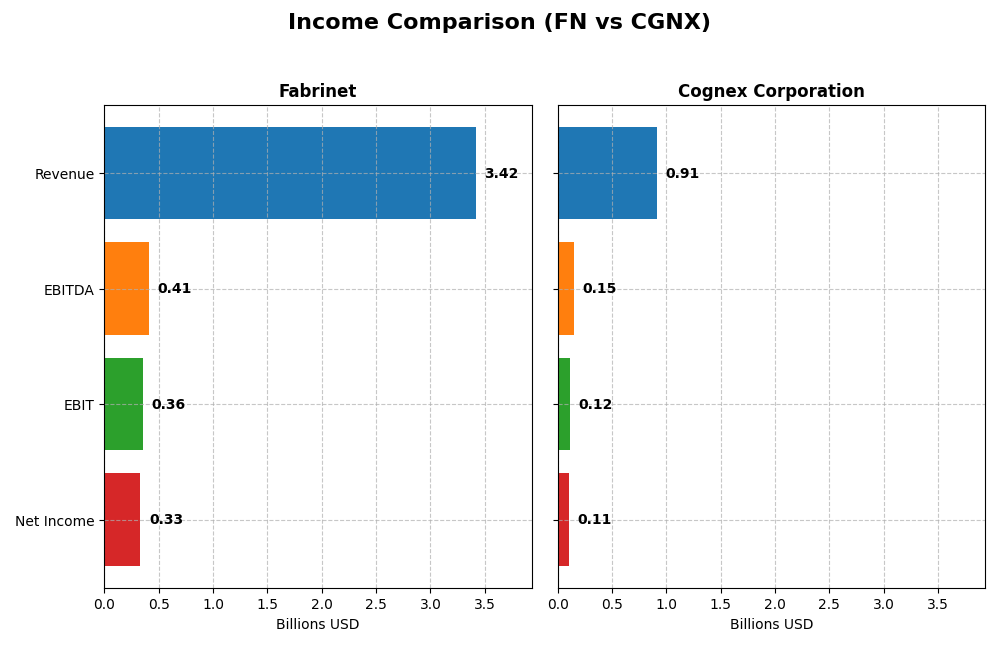
| Metric | Fabrinet (FN) | Cognex Corporation (CGNX) |
|---|---|---|
| Market Cap | 16.9B USD | 6.6B USD |
| Revenue | 3.42B USD (2025) | 914.5M USD (2024) |
| EBITDA | 409M USD (2025) | 148M USD (2024) |
| EBIT | 355M USD (2025) | 115M USD (2024) |
| Net Income | 333M USD (2025) | 106M USD (2024) |
| EPS | 9.23 USD (2025) | 0.62 USD (2024) |
| Fiscal Year | 2025 | 2024 |
Income Statement Interpretations
Fabrinet
Fabrinet’s revenue and net income showed strong growth from 2021 to 2025, with revenue increasing by 82% and net income by 124%. Margins mostly improved, notably the EBIT margin at 10.39% and net margin at 9.72% in 2025, both favorable. The latest year saw revenue growth of 18.6%, stable operating expenses relative to revenue, but a slight 5.34% dip in net margin.
Cognex Corporation
Cognex experienced moderate revenue growth of 12.8% over 2020-2024 but a significant net income decline of nearly 40%. Margins remain favorable, with a strong gross margin of 68.43% and net margin of 11.61% in 2024. The latest year showed 9.2% revenue growth but decreases in EBIT (-6.2%) and net margin (-14.1%), indicating margin pressure despite solid top-line growth.
Which one has the stronger fundamentals?
Fabrinet displays stronger fundamentals with consistent revenue and net income growth, favorable margin improvements, and positive EPS growth over the period. Cognex, while maintaining high gross margins, faces declining profitability and net income, reflecting less stable fundamentals. Overall, Fabrinet’s income statement trends suggest more robust performance sustainability.
Financial Ratios Comparison
The table below presents a side-by-side comparison of key financial ratios for Fabrinet (FN) and Cognex Corporation (CGNX) based on their most recent fiscal year data.
| Ratios | Fabrinet (FN) 2025 | Cognex Corporation (CGNX) 2024 |
|---|---|---|
| ROE | 16.78% | 6.99% |
| ROIC | 15.01% | 5.07% |
| P/E | 32.02 | 57.90 |
| P/B | 5.37 | 4.05 |
| Current Ratio | 3.00 | 3.62 |
| Quick Ratio | 2.28 | 2.69 |
| D/E (Debt-to-Equity) | 0.003 | 0.046 |
| Debt-to-Assets | 0.19% | 3.52% |
| Interest Coverage | 0 | 0 |
| Asset Turnover | 1.21 | 0.46 |
| Fixed Asset Turnover | 8.85 | 5.52 |
| Payout ratio | 0% | 49.29% |
| Dividend yield | 0% | 0.85% |
Interpretation of the Ratios
Fabrinet
Fabrinet shows a generally favorable ratio profile with strong returns on equity (16.78%) and invested capital (15.01%), and solid liquidity indicated by a current ratio of 3.0. However, valuation metrics such as a high P/E of 32.02 and P/B of 5.37 are unfavorable, suggesting the stock may be expensive. The company does not pay dividends, likely focusing on reinvestment or growth strategies.
Cognex Corporation
Cognex displays mixed ratios, with a favorable net margin of 11.61% and good quick ratio of 2.69, but weaker returns including a low ROE of 7% and neutral ROIC at 5.07%. Its valuation is stretched, with a P/E of 57.9 and P/B of 4.05 both unfavorable. The company pays a dividend, albeit modest, with a yield of 0.85%, reflecting cautious shareholder return policies.
Which one has the best ratios?
Fabrinet’s ratios are more favorable overall, with stronger profitability, liquidity, and capital structure metrics, despite some valuation concerns. Cognex’s profile is less consistent, with several unfavorable ratios and lower returns despite paying a dividend. Thus, Fabrinet demonstrates a more robust financial ratio set based on the latest data.
Strategic Positioning
This section compares the strategic positioning of Fabrinet and Cognex Corporation, including Market position, Key segments, and Exposure to technological disruption:
Fabrinet
- Leading provider in optical packaging and precision manufacturing, facing moderate competitive pressure.
- Generates most revenue from optical communications with lasers, sensors, and other industrial components.
- Exposure tied to optical and electro-mechanical manufacturing technologies, with limited info on disruption.
Cognex Corporation
- Focused on machine vision products to automate manufacturing with higher beta, indicating more volatility.
- Revenue driven by standard products and customer-specific machine vision solutions across diverse industries.
- Faces technological disruption through evolving machine vision and deep learning vision software advancements.
Fabrinet vs Cognex Corporation Positioning
Fabrinet’s diversified product range in optical communications and sensors contrasts with Cognex’s concentrated focus on machine vision solutions. Fabrinet’s broader industrial applications provide scale, while Cognex’s specialized technology targets automation and inspection markets, with differing competitive dynamics.
Which has the best competitive advantage?
Fabrinet demonstrates a very favorable moat with growing ROIC and value creation, indicating durable competitive advantage. Cognex shows a very unfavorable moat, with declining ROIC and value destruction, reflecting weaker competitive positioning.
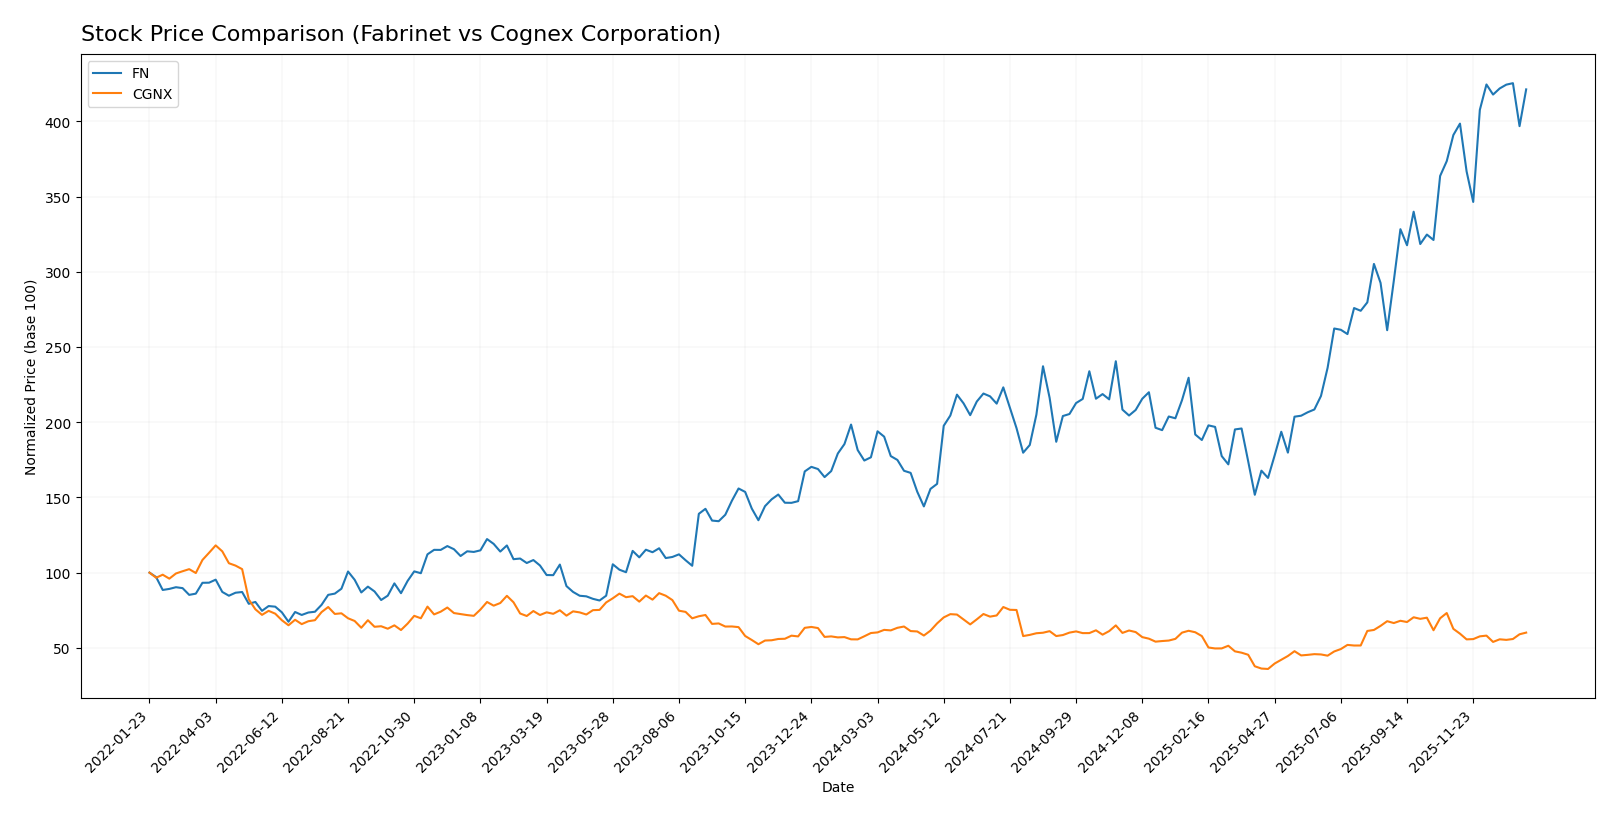
Stock Comparison
The past year has seen Fabrinet’s stock surge with strong upward momentum, while Cognex Corporation’s price has remained largely flat with minor recent weakness, reflecting contrasting trading dynamics and investor sentiment.
Trend Analysis
Fabrinet’s stock shows a bullish trend over the past 12 months with a 138.43% price increase and accelerating momentum, despite high volatility reflected by an 85.6 standard deviation. The stock reached a high of 479.42 and a low of 162.32.
Cognex Corporation’s stock trend is neutral over the same period, with a 0.47% price increase indicating deceleration and low volatility at a 5.92 standard deviation. Recent weeks show a slight bearish shift with a -3.98% change.
Comparing both, Fabrinet has delivered the highest market performance with a strong and accelerating bullish trend, whereas Cognex’s stock remained nearly flat with signs of recent deceleration.
Target Prices
Analysts present a clear consensus on target prices for Fabrinet and Cognex Corporation, indicating potential upside from current levels.
| Company | Target High | Target Low | Consensus |
|---|---|---|---|
| Fabrinet | 600 | 537 | 568.5 |
| Cognex Corporation | 58 | 38 | 48.14 |
The consensus target prices for Fabrinet and Cognex suggest upside potential of approximately 20% and 21% respectively compared to their current stock prices of 471.42 and 39.67 USD. Analysts expect moderate growth in both companies.
Analyst Opinions Comparison
This section compares analysts’ ratings and grades for Fabrinet and Cognex Corporation:
Rating Comparison
Fabrinet Rating
- Rating: A- indicating a very favorable evaluation.
- Discounted Cash Flow Score: 3, moderate outlook on valuation.
- ROE Score: 4, favorable profit generation efficiency.
- ROA Score: 5, very favorable asset utilization.
- Debt To Equity Score: 5, very favorable financial stability.
- Overall Score: 4, favorable overall financial standing.
Cognex Corporation Rating
- Rating: B indicating a very favorable evaluation.
- Discounted Cash Flow Score: 3, moderate outlook on valuation.
- ROE Score: 3, moderate profit generation efficiency.
- ROA Score: 4, favorable asset utilization.
- Debt To Equity Score: 4, favorable financial stability.
- Overall Score: 3, moderate overall financial standing.
Which one is the best rated?
Based on the provided data, Fabrinet is rated higher overall with an A- rating and superior scores in ROE, ROA, debt management, and overall financial standing compared to Cognex Corporation’s B rating and moderate scores.
Scores Comparison
Here is a comparison of the financial health scores for Fabrinet and Cognex Corporation:
Fabrinet Scores
- Altman Z-Score: 13.79, indicating a safe zone with very low bankruptcy risk.
- Piotroski Score: 4, classified as average financial strength.
Cognex Corporation Scores
- Altman Z-Score: 9.07, also in the safe zone, showing low bankruptcy risk.
- Piotroski Score: 7, considered strong financial health.
Which company has the best scores?
Cognex Corporation has a lower Altman Z-Score than Fabrinet but still in the safe zone, and a higher Piotroski Score showing stronger financial health based on the provided data.
Grades Comparison
Here is a detailed comparison of the latest grades assigned to Fabrinet and Cognex Corporation by reputable grading companies:
Fabrinet Grades
The table below presents Fabrinet’s recent grades from established grading companies:
| Grading Company | Action | New Grade | Date |
|---|---|---|---|
| Barclays | Maintain | Equal Weight | 2025-11-05 |
| Needham | Maintain | Buy | 2025-11-04 |
| JP Morgan | Maintain | Overweight | 2025-11-04 |
| Rosenblatt | Maintain | Buy | 2025-11-04 |
| JP Morgan | Maintain | Overweight | 2025-10-16 |
| Rosenblatt | Maintain | Buy | 2025-10-02 |
| JP Morgan | Upgrade | Overweight | 2025-08-25 |
| B. Riley Securities | Maintain | Neutral | 2025-08-19 |
| Needham | Maintain | Buy | 2025-08-19 |
| Rosenblatt | Maintain | Buy | 2025-08-19 |
Fabrinet’s grades demonstrate a consistent positive outlook, predominantly Buy and Overweight ratings, with no downgrades recently.
Cognex Corporation Grades
The table below shows Cognex Corporation’s recent grades by recognized grading companies:
| Grading Company | Action | New Grade | Date |
|---|---|---|---|
| Barclays | Maintain | Overweight | 2026-01-12 |
| Truist Securities | Maintain | Hold | 2025-12-18 |
| Goldman Sachs | Upgrade | Buy | 2025-12-16 |
| JP Morgan | Downgrade | Underweight | 2025-12-03 |
| DA Davidson | Maintain | Neutral | 2025-11-03 |
| Barclays | Maintain | Overweight | 2025-10-31 |
| Needham | Maintain | Buy | 2025-10-31 |
| Baird | Maintain | Neutral | 2025-10-31 |
| Truist Securities | Maintain | Hold | 2025-10-08 |
| Goldman Sachs | Maintain | Sell | 2025-09-16 |
Cognex’s ratings show a mixed trend, including upgrades and downgrades, with ratings spanning from Buy and Overweight to Underweight and Sell.
Which company has the best grades?
Fabrinet holds a stronger and more consistent rating profile, mainly Buy and Overweight grades, compared to Cognex’s more varied and cautious ratings. This suggests Fabrinet is currently viewed more favorably by analysts, potentially implying greater investor confidence and perceived growth prospects.
Strengths and Weaknesses
Below is a comparison of key strengths and weaknesses for Fabrinet (FN) and Cognex Corporation (CGNX) based on the most recent financial and operational data.
| Criterion | Fabrinet (FN) | Cognex Corporation (CGNX) |
|---|---|---|
| Diversification | Focused mainly on Optical Communications (2.62B in 2025) with some exposure to Lasers and Sensors | Balanced between Standard Products & Services (795M) and Customer Specific Solutions (119M) in 2024 |
| Profitability | Favorable ROIC (15.01%), ROE (16.78%), Net Margin Neutral (9.72%) | Mixed margins: Net Margin favorable (11.61%), but ROE (7%) and ROIC (5.07%) weaker; declining profitability trend |
| Innovation | Strong, supported by very favorable moat status and growing ROIC trend | Innovation challenged, reflected in very unfavorable moat and declining ROIC trend |
| Global presence | Significant, as indicated by growing revenues in optical communications segment | Established but less efficient asset turnover (0.46) and slightly unfavorable global ratios opinion |
| Market Share | Strong, shown by high fixed asset turnover (8.85) and asset turnover (1.21) | Smaller scale indicated by lower asset turnover metrics and higher P/E (57.9) and P/B (4.05) ratios |
Fabrinet demonstrates a durable competitive advantage with efficient capital use and strong profitability, primarily driven by its optical communications focus. Cognex, conversely, faces challenges with declining profitability and value destruction, despite a diversified product mix. Investors should weigh Fabrinet’s stable growth against Cognex’s riskier profile.
Risk Analysis
Below is a comparative table of key risks facing Fabrinet (FN) and Cognex Corporation (CGNX) as of the most recent data available:
| Metric | Fabrinet (FN) | Cognex Corporation (CGNX) |
|---|---|---|
| Market Risk | Moderate (Beta 1.04) | High (Beta 1.52) |
| Debt level | Very Low (D/E 0.00) | Low (D/E 0.05) |
| Regulatory Risk | Moderate (Global ops) | Moderate (US-focused) |
| Operational Risk | Moderate (Supply chain) | Moderate (Tech innovation) |
| Environmental Risk | Low (Manufacturing tech) | Low (Vision systems) |
| Geopolitical Risk | Moderate (Asia-Pacific) | Low (Primarily US-based) |
Fabrinet’s most likely and impactful risks are moderate market and geopolitical exposures due to its Asia-Pacific manufacturing footprint. Cognex faces higher market risk with a beta of 1.52 and valuation concerns despite a strong Piotroski score, reflecting sensitivity to market volatility and operational execution. Both companies maintain low debt, reducing financial distress risk.
Which Stock to Choose?
Fabrinet (FN) shows strong income growth with an 81.94% revenue increase over five years, a favorable 16.78% ROE, and low debt levels. Its profitability and financial ratios are mostly favorable, supported by a very favorable A- rating and a very favorable moat indicating durable competitive advantage.
Cognex Corporation (CGNX) has a more modest 12.76% revenue growth over five years and mixed profitability metrics, including a 7.0% ROE and slightly unfavorable financial ratios. Despite a very favorable B rating and strong Piotroski score, its moat is very unfavorable with declining ROIC, signaling shrinking value creation.
For investors prioritizing growth and durable competitive advantage, Fabrinet’s metrics and ratings could appear more favorable. Conversely, those focused on companies with strong financial health scores might find Cognex’s profile appealing despite its challenges in profitability and value creation.
Disclaimer: Investment carries a risk of loss of initial capital. The past performance is not a reliable indicator of future results. Be sure to understand risks before making an investment decision.
Go Further
I encourage you to read the complete analyses of Fabrinet and Cognex Corporation to enhance your investment decisions: