Home > Comparison > Technology > GLW vs CGNX
The strategic rivalry between Corning Incorporated and Cognex Corporation shapes the trajectory of the Technology sector. Corning operates as a diversified hardware and materials powerhouse, with a broad portfolio spanning display technologies and specialty glass. Cognex, by contrast, excels as a focused machine vision equipment innovator, driving automation in manufacturing. This analysis pits Corning’s scale against Cognex’s specialization to identify which offers superior risk-adjusted returns for a balanced portfolio.
Table of contents
Companies Overview
Corning Incorporated and Cognex Corporation each hold critical roles in the hardware and equipment sector, shaping advanced technology markets globally.
Corning Incorporated: Leader in Specialty Glass and Optical Solutions
Corning dominates the display technologies and optical communications markets. It generates revenue by supplying glass substrates for LCDs and OLEDs, alongside optical fibers and hardware. In 2026, Corning focuses on expanding its specialty materials and life sciences segments to leverage its broad product portfolio and industrial expertise.
Cognex Corporation: Pioneer in Machine Vision Automation
Cognex leads in machine vision products that automate manufacturing and distribution by capturing and analyzing visual data. Its revenue stems from advanced vision software and inspection systems used across automotive, pharmaceuticals, and consumer electronics. The company’s 2026 strategy emphasizes enhancing its deep learning vision software to solidify leadership in automated quality control.
Strategic Collision: Similarities & Divergences
Both companies excel in hardware and equipment, yet Corning embraces a diversified industrial approach while Cognex focuses on niche vision automation. Their main battleground lies in supplying core components for high-tech manufacturing. Corning offers a broad exposure to materials science, contrasting with Cognex’s concentrated play on software-driven automation, defining distinct investment profiles.
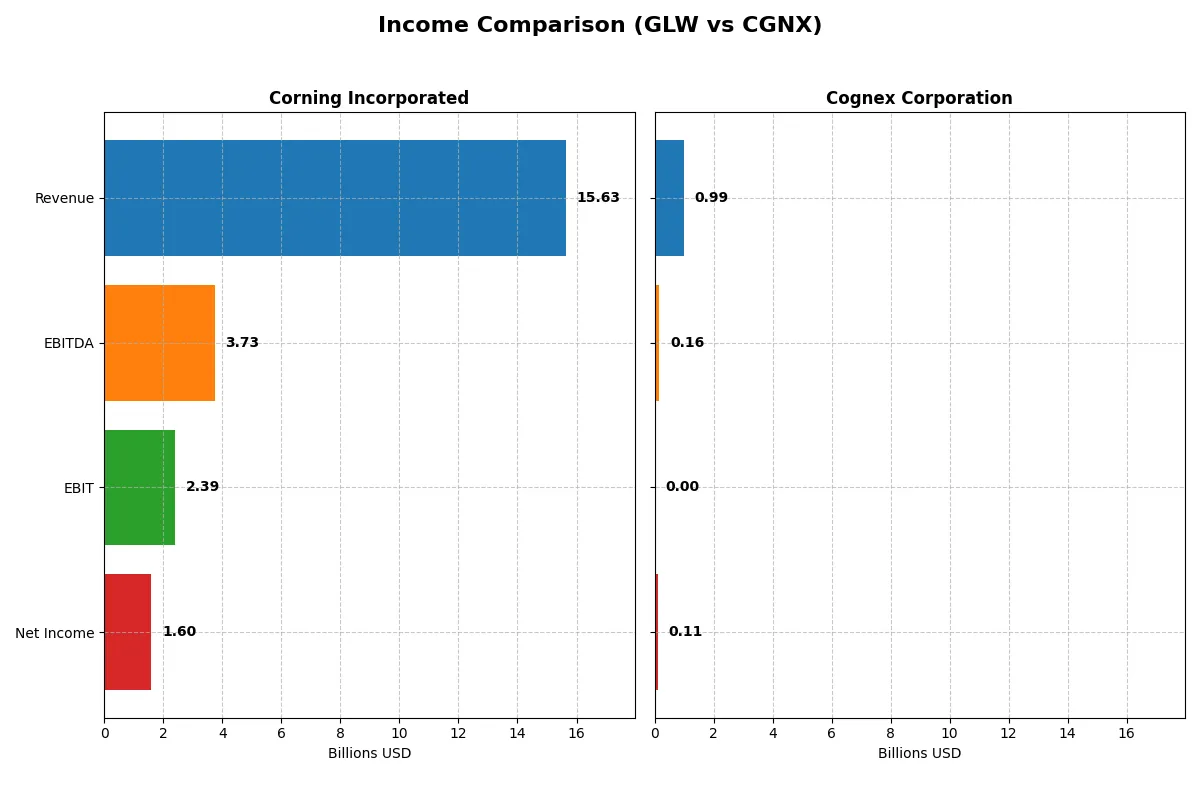
Income Statement Comparison
This table dissects the core profitability and scalability of both corporate engines to reveal who dominates the bottom line:
| Metric | Corning Incorporated (GLW) | Cognex Corporation (CGNX) |
|---|---|---|
| Revenue | 15.6B | 994M |
| Cost of Revenue | 10.1B | 329M |
| Operating Expenses | 3.18B | 503M |
| Gross Profit | 5.51B | 665M |
| EBITDA | 3.74B | 163M |
| EBIT | 2.39B | 0 |
| Interest Expense | 336M | 0 |
| Net Income | 1.60B | 114M |
| EPS | 1.86 | 0.68 |
| Fiscal Year | 2025 | 2025 |
Income Statement Analysis: The Bottom-Line Duel
This income statement comparison reveals which company runs a more efficient and profitable corporate engine through recent financial performance.
Corning Incorporated Analysis
Corning’s revenue climbed steadily from $14.1B in 2021 to $15.6B in 2025, with net income fluctuating but surging to $1.6B in 2025. Its gross margin holds favorable at 35.3%, and net margin improved to 10.2%. The company accelerated operating efficiency notably in 2025, doubling EBIT and tripling net income year-over-year.
Cognex Corporation Analysis
Cognex’s revenue showed modest growth, reaching $994M in 2025, while net income declined overall to $114M. It boasts a robust gross margin near 67%, but EBIT dropped to zero in 2025, signaling operational challenges. Despite a solid net margin of 11.5%, momentum slowed with compressed earnings and negative margin growth over five years.
Margin Prowess vs. Earnings Momentum
Corning demonstrates superior income growth and operational leverage with a favorable 85.7% income statement rating, compared to Cognex’s mixed 50% favorable score. Corning’s scale and accelerating net income make it the clear fundamental winner. Investors seeking strong earnings momentum and margin stability will find Corning’s profile more compelling.
Financial Ratios Comparison
These vital ratios act as a diagnostic tool to expose the underlying fiscal health, valuation premiums, and capital efficiency of the companies analyzed:
| Ratios | Corning Incorporated (GLW) | Cognex Corporation (CGNX) |
|---|---|---|
| ROE | 13.52% | 7.67% |
| ROIC | 7.57% | 5.52% |
| P/E | 47.18 | 52.83 |
| P/B | 6.38 | 4.05 |
| Current Ratio | 1.59 | 3.80 |
| Quick Ratio | 1.04 | 3.05 |
| D/E | 0.71 | 0.05 |
| Debt-to-Assets | 27.23% | 3.80% |
| Interest Coverage | 6.94 | 0 (not reported) |
| Asset Turnover | 0.50 | 0.49 |
| Fixed Asset Turnover | 1.05 | 6.28 |
| Payout ratio | 62.59% | 47.73% |
| Dividend yield | 1.33% | 0.90% |
| Fiscal Year | 2025 | 2025 |
Efficiency & Valuation Duel: The Vital Signs
Financial ratios serve as a company’s DNA, revealing both operational strengths and hidden risks essential for investment insight.
Corning Incorporated
Corning displays solid profitability with a 13.5% ROE and a favorable 10.2% net margin, signaling efficient core operations. However, its P/E of 47.2 and P/B of 6.4 suggest an expensive valuation. Shareholders receive modest dividends at 1.33%, balancing returns with reinvestment in R&D at over 7% of revenue.
Cognex Corporation
Cognex shows a lower ROE at 7.7% despite a slightly higher net margin of 11.5%, indicating moderate profitability. Its valuation is stretched with a P/E of 52.8 and P/B of 4.1. The company offers a small 0.9% dividend yield, focusing heavily on growth through R&D expenditures near 14% of revenue.
Premium Valuation vs. Operational Safety
Corning offers a better balance with stronger returns on equity and a more conservative debt profile despite a high valuation. Cognex’s higher P/E and weaker profitability increase risk. Investors seeking operational safety may prefer Corning’s profile, while growth-oriented investors might lean toward Cognex’s reinvestment strategy.
Which one offers the Superior Shareholder Reward?
I compare Corning Incorporated (GLW) and Cognex Corporation (CGNX) on dividend yield, payout ratio, and buyback intensity. GLW yields 1.33–3.83% with payout ratios often above 60%, showing strong dividend commitment but high payout risks. CGNX yields under 1%, with a modest payout ratio near 48%, emphasizing reinvestment. GLW’s free cash flow per share (1.64 in 2025) covers dividends adequately, yet its payout ratio spikes suggest sustainability concerns. CGNX maintains robust free cash flow coverage (96%) and minimal debt, supporting both dividends and growth. CGNX’s aggressive buybacks and reinvestment in R&D offer a superior total return profile. I find CGNX’s distribution strategy more sustainable and rewarding for long-term investors in 2026.
Comparative Score Analysis: The Strategic Profile
The radar chart reveals the fundamental DNA and trade-offs of Corning Incorporated and Cognex Corporation, highlighting their financial strengths and weaknesses:
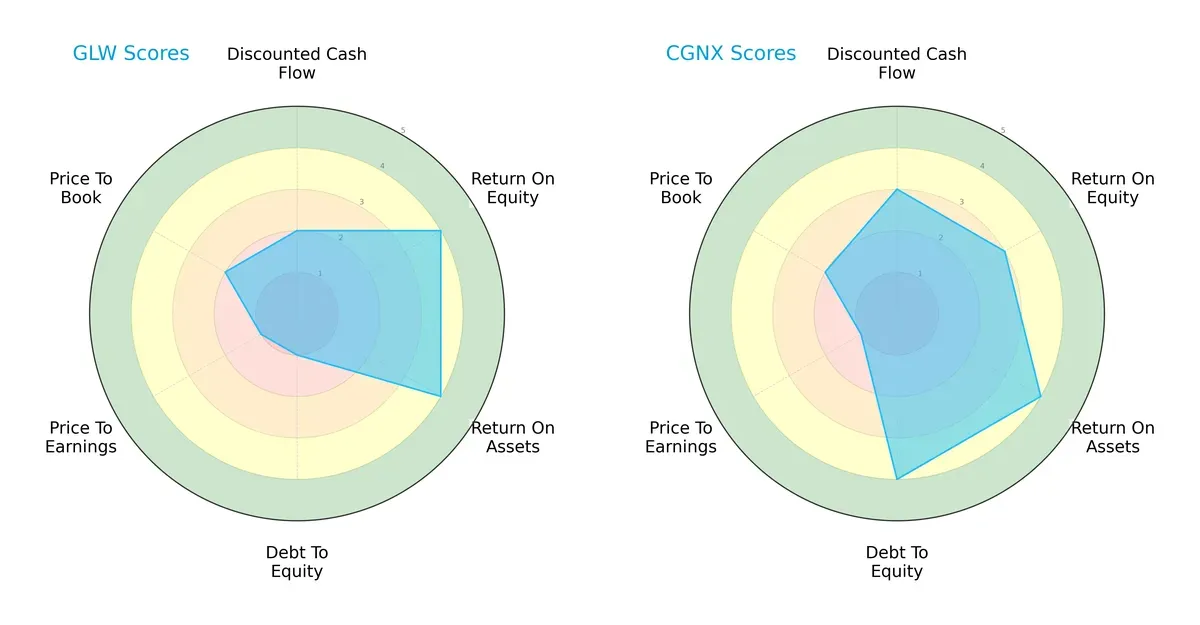
Corning leans heavily on profitability with strong ROE and ROA scores (4 each) but struggles with financial leverage and valuation, scoring very low on debt-to-equity (1) and P/E (1). Cognex displays a more balanced profile, showing moderate scores across DCF (3), ROE (3), and excellent debt management (4). Cognex’s diversified strengths contrast with Corning’s reliance on operational efficiency amid financial risk.
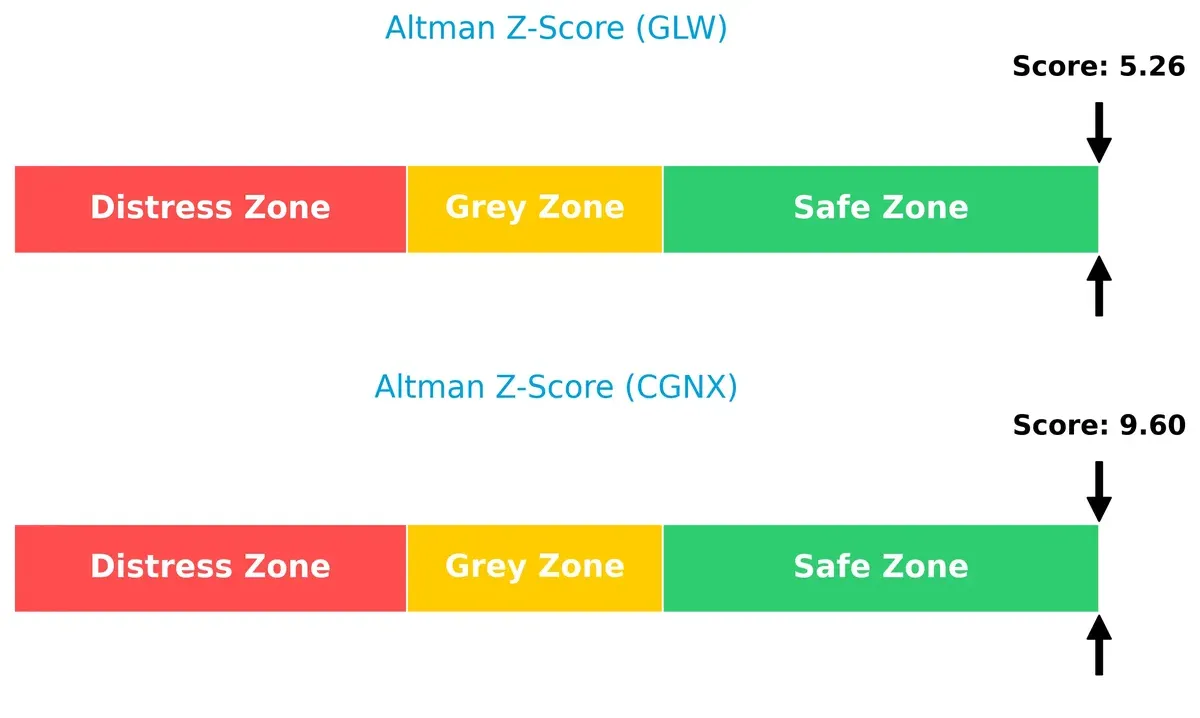
Bankruptcy Risk: Solvency Showdown
Corning’s Altman Z-Score of 5.26 versus Cognex’s 9.60 shows both firms in the safe zone, but Cognex’s higher score signals a stronger buffer against financial distress in this cycle:
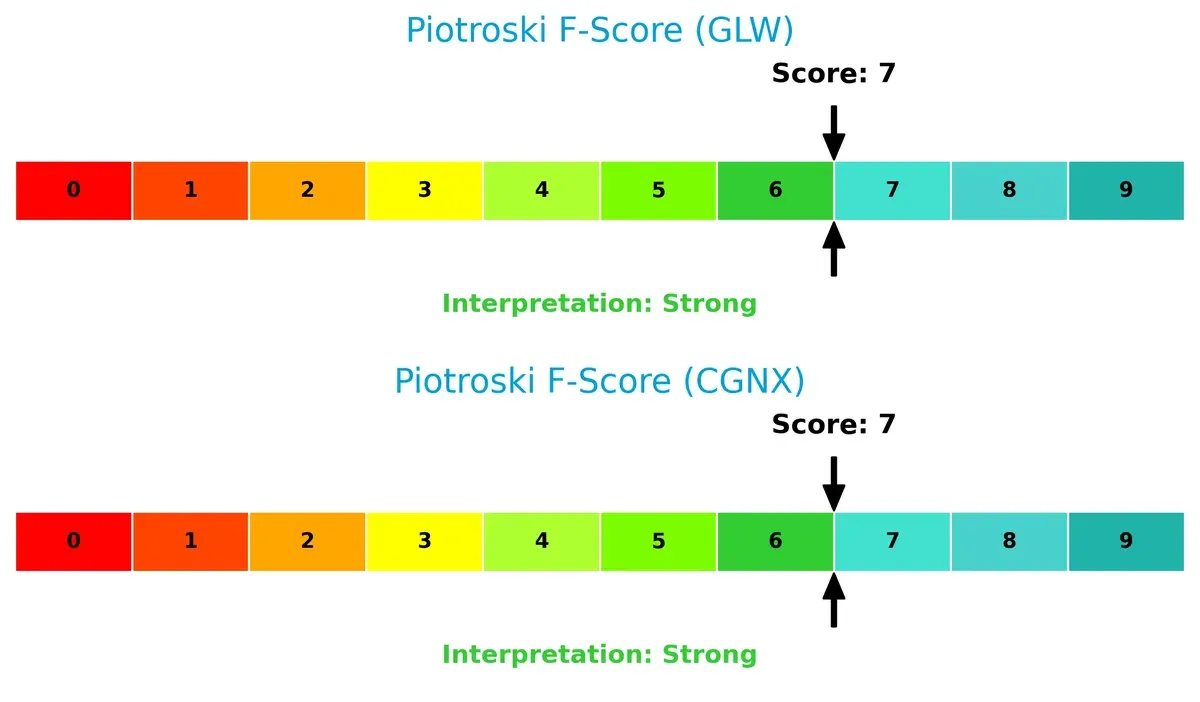
Financial Health: Quality of Operations
Both firms score 7 on the Piotroski scale, indicating strong financial health without glaring internal red flags, suggesting stable profitability, liquidity, and operational efficiency:
How are the two companies positioned?
This section dissects the operational DNA of Corning and Cognex by comparing their revenue distribution and internal dynamics. The goal: confront their economic moats to identify which model delivers the most sustainable competitive advantage today.
Revenue Segmentation: The Strategic Mix
This visual comparison dissects how Corning Incorporated and Cognex Corporation diversify their income streams and where their primary sector bets lie:
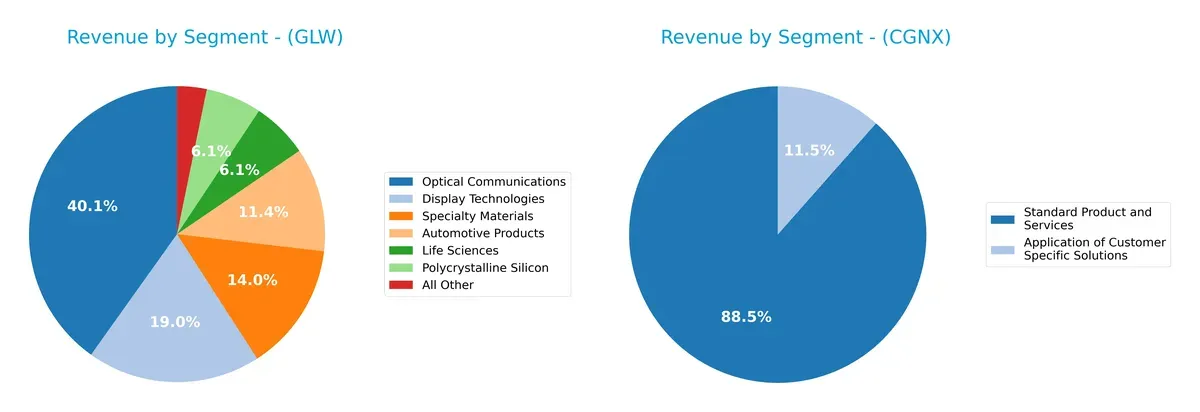
Corning leans heavily on Optical Communications at $6.27B, anchoring its portfolio with infrastructure dominance. Its mix spans seven significant segments, showing broad diversification. Cognex, by contrast, pivots around Standard Products and Services at $880M, with a smaller segment of Custom Solutions at $114M. This concentration highlights higher risk but also sharp focus on machine vision technologies. Corning’s ecosystem lock-in contrasts with Cognex’s niche specialization.
Strengths and Weaknesses Comparison
This table compares the Strengths and Weaknesses of Corning Incorporated and Cognex Corporation:
Corning Incorporated Strengths
- Diversified revenue streams across multiple segments
- Favorable net margin at 10.21%
- Strong global presence with $7.65B Asia Pacific revenue
- Solid current and quick ratios indicating liquidity
- Low debt-to-assets ratio at 27.23%
- Favorable interest coverage at 7.11
Cognex Corporation Strengths
- Favorable net margin at 11.51%
- Very low debt-to-assets ratio at 3.8%
- Strong fixed asset turnover at 6.28
- Favorable quick ratio at 3.05
- Diversified geographic revenue across Americas, Europe, Asia
- Low debt equity ratio of 0.05
Corning Incorporated Weaknesses
- Unfavorable valuation metrics with PE 47.18 and PB 6.38
- Neutral ROE and ROIC not exceeding WACC
- Moderate asset turnover at 0.5
- Dividend yield only neutral at 1.33%
- Large exposure to Optical Communications segment
Cognex Corporation Weaknesses
- Unfavorable PE at 52.83 and PB at 4.05
- Unfavorable ROE at 7.67% below WACC
- Unfavorable current ratio at 3.8 but zero interest coverage
- Low dividend yield at 0.9%
- Asset turnover below 0.5, indicating inefficiency
Corning’s strengths lie in its broad diversification and solid liquidity, supporting resilience across market cycles. Cognex shows operational efficiency in fixed assets and minimal leverage but faces challenges in profitability metrics and interest coverage, signaling risks in capital management.
The Moat Duel: Analyzing Competitive Defensibility
A structural moat is the only reliable shield protecting long-term profits from relentless competition erosion. Let’s dissect the moats of two industry players:
Corning Incorporated: Intangible Assets & Scale Synergy
Corning’s moat stems from decades of specialized glass technology and global scale. Its stable 35% gross margin and rapid EBIT growth reflect strong pricing power. Expansion into life sciences and optical communications in 2026 should deepen its intangible asset moat.
Cognex Corporation: Technology-Driven Switching Costs
Cognex leverages patented machine vision software creating high switching costs for customers. Despite a superior 67% gross margin, declining ROIC warns of value erosion. Future AI integration could restore growth, but current margin volatility tempers optimism compared to Corning.
Verdict: Intangible Assets vs. Switching Costs — Who Defends Better?
Corning’s broader moat, fueled by scale and diversified intangible assets, shows growing profitability despite slight value erosion. Cognex’s narrow, tech-dependent moat faces profitability decline. Corning is better positioned to defend and grow its market share in 2026.
Which stock offers better returns?
Over the past year, both Corning Incorporated and Cognex Corporation displayed strong upward price movements, with Corning showing higher volatility and more pronounced acceleration in gains.
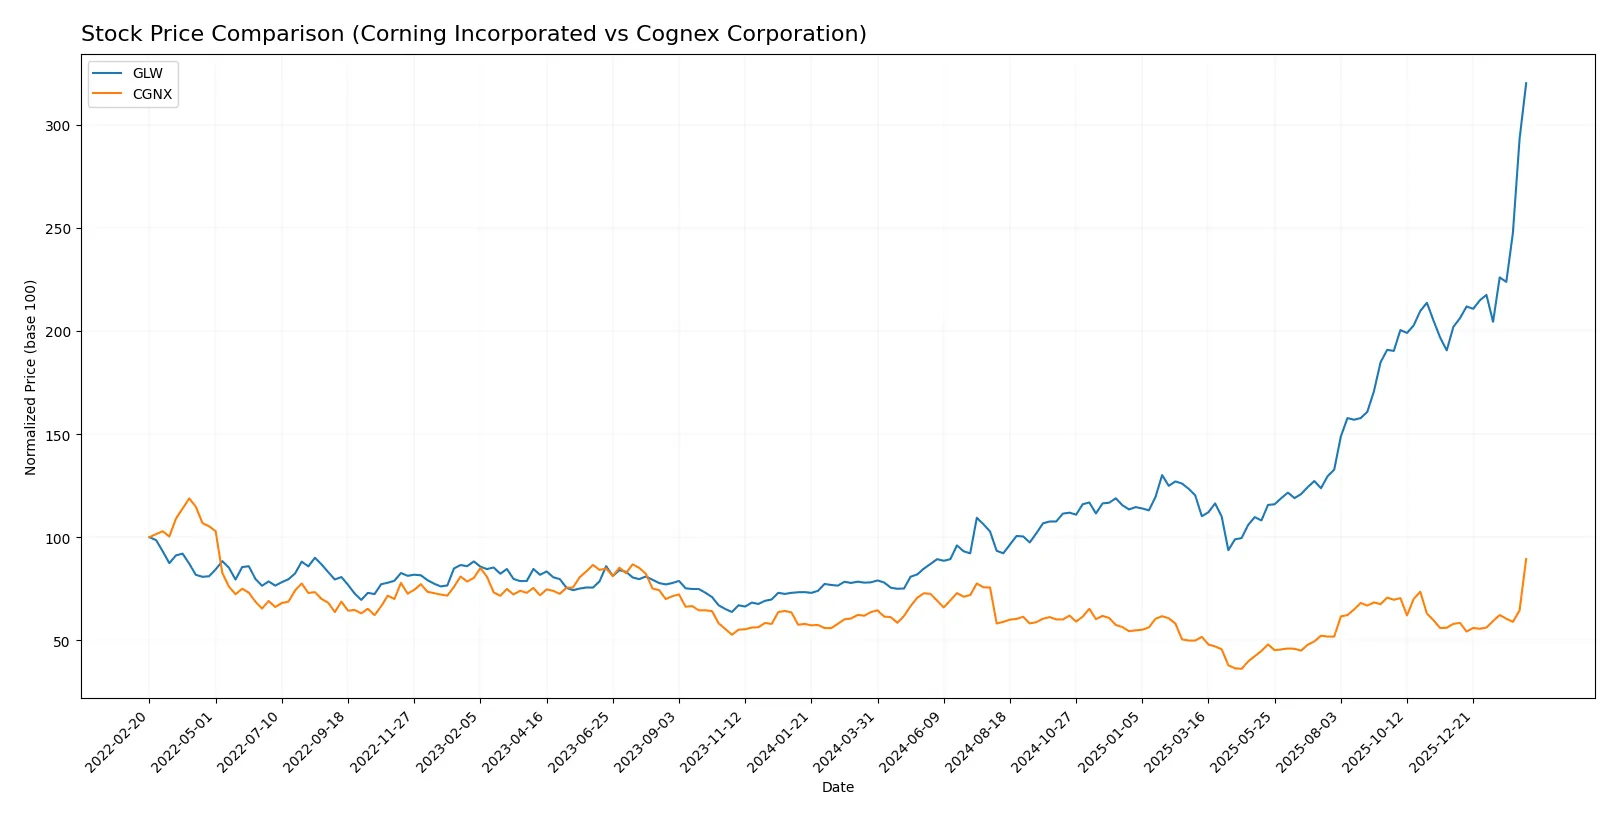
Trend Comparison
Corning Incorporated’s stock surged 310% over 12 months, marking a bullish trend with accelerating momentum. Its volatility is elevated, with prices ranging from 31.27 to 133.46.
Cognex Corporation’s stock gained 40.5% during the same period, also bullish with acceleration but far less volatile. Price moved between 23.77 and 58.79.
Corning’s stock outperformed Cognex by a substantial margin, delivering the highest market return and stronger price acceleration over the year.
Target Prices
Analysts provide a moderate upside for Corning Incorporated and Cognex Corporation based on current consensus targets.
| Company | Target Low | Target High | Consensus |
|---|---|---|---|
| Corning Incorporated | 100 | 135 | 118.67 |
| Cognex Corporation | 38 | 70 | 54.88 |
Corning’s target consensus at 118.67 is slightly below its current price of 133.46, suggesting limited near-term upside. Cognex’s consensus target of 54.88 sits below its 58.79 market price, indicating cautious analyst expectations.

Don’t Let Luck Decide Your Entry Point
Optimize your entry points with our advanced ProRealTime indicators. You’ll get efficient buy signals with precise price targets for maximum performance. Start outperforming now!
How do institutions grade them?
Corning Incorporated Grades
The following table summarizes recent institutional grades for Corning Incorporated:
| Grading Company | Action | New Grade | Date |
|---|---|---|---|
| Morgan Stanley | Maintain | Equal Weight | 2026-01-29 |
| Mizuho | Maintain | Outperform | 2026-01-29 |
| Citigroup | Maintain | Buy | 2026-01-29 |
| Susquehanna | Maintain | Positive | 2026-01-29 |
| JP Morgan | Maintain | Overweight | 2026-01-28 |
| Citigroup | Maintain | Buy | 2026-01-12 |
| Morgan Stanley | Maintain | Equal Weight | 2025-12-17 |
| UBS | Maintain | Buy | 2025-11-21 |
| UBS | Maintain | Buy | 2025-10-29 |
| Susquehanna | Maintain | Positive | 2025-10-29 |
Cognex Corporation Grades
The following table summarizes recent institutional grades for Cognex Corporation:
| Grading Company | Action | New Grade | Date |
|---|---|---|---|
| Keybanc | Maintain | Overweight | 2026-02-13 |
| Barclays | Maintain | Overweight | 2026-02-13 |
| Needham | Maintain | Buy | 2026-02-12 |
| Barclays | Maintain | Overweight | 2026-01-12 |
| Truist Securities | Maintain | Hold | 2025-12-18 |
| Goldman Sachs | Upgrade | Buy | 2025-12-16 |
| JP Morgan | Downgrade | Underweight | 2025-12-03 |
| DA Davidson | Maintain | Neutral | 2025-11-03 |
| Baird | Maintain | Neutral | 2025-10-31 |
| Needham | Maintain | Buy | 2025-10-31 |
Which company has the best grades?
Corning shows consistently positive grades with multiple Buy and Outperform ratings, indicating broad institutional confidence. Cognex’s grades are more mixed, including upgrades but also downgrades and neutral positions. Investors might view Corning’s steadier, more favorable consensus as a sign of stronger institutional support.
Risks specific to each company
The following categories identify the critical pressure points and systemic threats facing both firms in the 2026 market environment:
1. Market & Competition
Corning Incorporated
- Large market cap supports scale advantages but faces intense competition in display and specialty materials.
Cognex Corporation
- Smaller market cap limits scale; competes in niche machine vision with rapid innovation demands.
2. Capital Structure & Debt
Corning Incorporated
- Moderate debt-to-equity ratio (0.71) with solid interest coverage (7.11) indicates manageable leverage risk.
Cognex Corporation
- Very low debt-to-equity (0.05) but zero interest coverage signals potential liquidity concerns.
3. Stock Volatility
Corning Incorporated
- Beta of 1.124 suggests moderate sensitivity to market swings, reflecting typical sector volatility.
Cognex Corporation
- Higher beta at 1.534 indicates above-average stock price swings and elevated investor risk.
4. Regulatory & Legal
Corning Incorporated
- Operates in multiple industries, potentially increasing regulatory complexity and compliance costs.
Cognex Corporation
- Concentrated in machine vision; fewer regulatory layers but exposed to tech export restrictions.
5. Supply Chain & Operations
Corning Incorporated
- Diverse product lines and global operations create supply chain complexity risks amid global disruptions.
Cognex Corporation
- Focused product scope reduces complexity but increases vulnerability to single-supplier or tech component shortages.
6. ESG & Climate Transition
Corning Incorporated
- Environmental technologies segment provides a positive ESG angle but faces transition risks in emissions regulations.
Cognex Corporation
- Limited product focus may constrain ESG initiatives; pressure to adapt machine vision tech for sustainability trends.
7. Geopolitical Exposure
Corning Incorporated
- Global footprint subjects Corning to geopolitical tensions impacting supply chains and trade tariffs.
Cognex Corporation
- Smaller scale and more niche markets limit but do not eliminate geopolitical risk exposure.
Which company shows a better risk-adjusted profile?
Corning’s biggest risk lies in complex supply chain and regulatory pressures due to its scale and diversification. Cognex faces substantial financial risk from weak interest coverage and elevated stock volatility. Corning’s moderate leverage and stable Altman Z-Score (5.26) contrast with Cognex’s riskier capital structure despite a higher Z-Score (9.60). Overall, Corning offers a better risk-adjusted profile, supported by stronger liquidity and manageable debt, while Cognex’s financial fragility and price swings demand caution.
Final Verdict: Which stock to choose?
Corning Incorporated’s superpower lies in its steady operational efficiency and robust cash flow generation. Its slightly unfavorable ROIC versus WACC signals a point of vigilance, suggesting the company is still working to fully convert growth into value. It suits investors seeking exposure to industrial innovation with an aggressive growth appetite.
Cognex Corporation benefits from a strategic moat anchored in high-margin, recurring revenue from its machine vision technology. Its balance sheet shows exceptional liquidity and low debt, offering a safer profile compared to Corning. This makes it more fitting for portfolios focused on GARP — growth at a reasonable price — despite some pressure on profitability trends.
If you prioritize operational resilience and cash generation in cyclical sectors, Corning outshines with its accelerating revenue growth and improving profitability. However, if you seek stability backed by a dominant niche technology and strong liquidity, Cognex offers better safety amid declining margins. Both present analytical scenarios worth tailoring to your risk tolerance and investment horizon.
Disclaimer: Investment carries a risk of loss of initial capital. The past performance is not a reliable indicator of future results. Be sure to understand risks before making an investment decision.
Go Further
I encourage you to read the complete analyses of Corning Incorporated and Cognex Corporation to enhance your investment decisions: